Research Article - Journal of Clinical Ophthalmology (2023) Volume 7, Issue 4
Tactile-visual cross modal transfer after an extended period of congenital blindness
Sowmya Srinivas*
Department of Ophthalmology, Dartmouth Hitchcock Medical Center, New Hampshire, USA
- Corresponding Author:
- Dr. Sowmya Srinivas
Department of Ophthalmology Dartmouth Hitchcock Medical Center New Hampshire USA
E-mail: srinivas.sowmya@gmail.com
Accepted date: 25 April, 2021
Citation:Srinivas S. Tactile-visual cross modal transfer after an extended period of congenital blindness. J Clin Ophthalmol 2021;5(S3): 395-408.
Abstract
Purpose: In underdeveloped villages of India, infants with congenital cataracts often do not undergo cataract surgery due to socioeconomic reasons. Consistent with a strict interpretation of the critical period, if congenital cataracts are treated within a few months of birth it leads to a near normal development of vision but after age 6 or 7 years there should be little or no improvement. The experiments below show that vision can be regained after the critical period. The objective of Experiment 1 is to assess the development of the tactile-visual link compared to intramodal tactile and visual object recognition while Experiment 2 assesses precision of the tactile-visual link.
Methods: Subjects were between 8 and 15 years old. In Experiment 1 objects were used to assess tactile-to-tactile, tactile-to-visual, visual-to-tactile, and visual-to-visual transfer in three patients. In Experiment 2, objects of a specific length, aspect ratio, or curvature ratio were used to assess the precision of tactile-to-visual transfer in three other patients and four normally sighted control subjects.
Results: In Experiment 1, tactile-to-visual transfer accuracy pre-operatively was about 20% and improved to above 50% during one week. In Experiment 2 the patients had a preoperative error range of 23-51%. There was a 25% improvement on post operation day 1 and by the day 4 there was a 50% improvement in the number of errors.
Conclusion: We have demonstrated that the link between touch and vision strengthened significantly after the classic critical period.
Keywords
Tactile-visual, Congenital blindness, Cataract, Amblyopia
Introduction
Congenital cataracts are removed within a few months after birth in developed nations. It is widely believed that early surgical intervention for bilateral congenital cataracts leads to better visual outcomes (Birch, Cheng, Stager Jr., Weakley, and Stager Sr., 2009; Bradford, Keech, and Scott, 1994; Jain, Ashworth, Biswas and Lloyd, 2010, Lambert, Lynn, Reeves, Plager, Buckley, and Wilson, 2006). Congenital cataract patients from the underdeveloped villages of India often do not undergo cataract surgery soon after birth due to lack of education, medical resources and the cost of surgery. Instead these children remain blind for many years.
There is strong evidence that a shorter period of early visual deprivation leads to better vision. If a patient with congenital cataracts has cataract surgery within a few months after birth, visual acuity develops rapidly and attains levels normal for their age [1-4]. The brain shows great plasticity in the early months so that sensory experience can repair the effects of sensory deprivation.
Neuroplasticity is the concept used to try to explain the neural or behavioral changes that occur during recovery from neural insult. It is simply the ability of the nervous system to reorganize its structure, function and connections, and it works at many levels from molecular to cellular to systems to behavioral. Neuroplasticity is now being studied in relation to brain trauma, stroke, mental and addictive disorders, neurodegeneration and aging, and pediatric and developmental disorders as well as recovery from different types of amblyopia (Cramer et al, 2011). Most of these recovery processes occur well after the “critical period for plasticity.”
Hubel and Wiesel (1970) in a brilliant series of experiments showed that sensory deprivation induced neural losses associated with deprivation amblyopia only during a limited time window, “ the critical period for plasticity. ” They concluded that after the critical period neuroplasticity was not possible[5] . However, many have shown using the same type of experiments that significant change is possible well after the critical period.
The present study examines neuroplasticity in response to treatable forms of visual deprivation, specifically congenital cataracts. The underlying question is whether functional vision can be regained in children who have been blind for many years due to bilateral congenital cataracts and how the children accomplish their recovery.
According to the World Health Organization, India with its huge population has the largest percentage of blind people. Most of these are correctable forms of blindness involving uncorrected refractive errors and untreated cataracts (Ostrovsky, Andalman, and Sinha, 2006). A rare subset of patients who have not been treated for congenital blindness is currently being studied in India by Dr. Pawan Sinha and his research team. Dr. Sinha is the founder of "Project Prakash", an initiative to search for congenitally blind children in India, treat the children whose blindness is correctable, and study their visual development (Sinha, 2003 & 2010).
Children who fit our criteria are found either through eye camps or door to door visits by project volunteers and doctors. They are then brought to Dr. Shroff’s Charity Eye Hospital in Delhi, cataract surgery is performed and longitudinal studies are initiated to monitor their progress[6-9].
The studies discussed earlier emphasize that a shorter period of visual deprivation leads to better vision. The aim of the present study is to examine whether recovery of functional vision is possible after many years of congenital blindness. For this thesis we studied the ability of patients to perform intramodal and intermodal recognition of objects during the week of cataract surgery.
More than 300 years ago, an Irish scientist and politician Molyneux asked the question whether immediately after a blind man regains his sight, can he without touching a cube and a globe be able to distinguish them purely by sight. In other words, can a former blind patient who is newly sighted identify by sight the objects they experienced only by touch. This is an example of cross-modal transfer which involves some type of interaction between two different sensory modalities-vision and touch. Molyneux’s specific question only concerned crossmodal transfer of shape from touch to vision and not from vision to touch[10-12].
The development of cross-modal transfer ability can be studied in two groups of subjects. The first is normal infants to learn about the developmental process. The second is patients who have forms of treatable congenital blindness such as congenital cataracts, extreme refractive error, and corneal opacities. Infant studies highlight the developmental processes that can be compared to the development of vision in subjects recovering from congenital blindness. Cross-modal transfer is assessed by familiarization with a test stimulus in one sensory modality and then recognizing the test stimulus in another modality. The primary objective in the present study is to determine whether subjects with recently removed severe bilateral congenital cataracts can transfer information about the shape of objects from the sense of touch to the newly functioning visual modality.
The present study can be compared to normal infant studies of cross-modal abilities. Cross-modal transfer is an important cognitive ability that is detectable in infancy (Rose, Feldman, Futterweit and Jankowski, 1998). One month old infants were not able to transfer information about the shapes of smooth and nubby objects between touch and vision (Maurer, Stager, and Mondloch, 1999). Streri and Molina (1993) showed that after visual habituation to a novel and familiar object, 2-month-old infants held the tactually familiar object for a longer time than a novel object. This provided evidence for visual to tactual transfer in 2-month-old infants.
Held’s study demonstrated that newly sighted patients from underdeveloped villages in India who had their congenital cataracts removed showed little transfer from touch to vision immediately after sight onset. However, the link between touch and vision was acquired within a few weeks (Held, 2009).
In summary, the brain retains plasticity even though the normal timeline for visual learning has been delayed for many years.
Experiments 1 and 2: Descriptions
This study presents two experiments studying touch to vision transfer during the week of cataract removal in congenitally blind children. Experiment 1 assesses the existence of a tactilevisual link and compares it to intramodal touch or vision object recognition. The results from Experiment 1 will be used to interpret whether the poor performance is due to poor visual to tactile recognition, poor tactile recognition, or poor visual recognition. Experiment 2 assesses the precision of the tactile to visual transfer. It is designed to quantify the precision of tactile to visual recognition ability by using objects of different lengths, aspect ratios and edge curvatures. How well the patients do will allow us to quantify their performance improvement from session to session and to compare it to normal control subjects [13-15].
Methods
Hypotheses
Visually-based object recognition improves with cataract removal and visual experience.
Tactile object recognition is excellent before and after cataract removal.
Visual object recognition is very poor in the congenitally blind child but improves dramatically after surgery and continues to improve with visual experience.
Intermodal transfer of object recognition from tactile to visual and visual to tactile improves more slowly than intramodal improvement.
Experiment 1 tests both intramodal and intermodal object recognition paradigms by assessing the percentage of errors the subjects make.
Experiment 2 tests the precision of the subjects’ ability to perform tactile-to-visual intermodal transfer object recognition using both percent errors and magnitudes of the errors for three object dimensions: length, aspect ratio, and curvature ratio.
Subjects
Inclusion and exclusion criteria
Some forms of treatable congenital blindness include dense congenital cataracts, corneal opacities, or extreme refractive error. To fit the criteria of the present study, a patient must have dense bilateral congenital cataracts contributing to severely reduced vision. Patients who have congenital cataracts with corneal opacities were eligible. Although difficult to quantify, change of behavior such: as stumbling in the environment, not playing with other children and having difficulty reading during the initial onset of anterior segment opacities also helped with the patient selection process. According to the parent’s history, the reason that children in the present study were not brought to medical attention earlier in their life is due to lack of parental education and financial resources.
Children whose congenital blindness could not be corrected were not included in the study. Children with poor systemic health were excluded due to the risk that surgery might imperil the health of the patient.
Patients: Experiment 1
The three patients who participated in Experiment 1 are described below.
Deepana is a 15 year old female with congenital cataracts and congenital adherent leukoma in both eyes with nystagmus. Her vision was light perception in the right and left eyes upon initial evaluation at Shroff’s Eye Hospital in 2008. She had penetrating keratoplasty (graft rejection) in her right eye after cataract surgery in March 2008. During the time of the study, she still had cataracts and adherent leukoma in her left eye and had not been operated on because of possible graft rejection. Cataract extraction may not have yielded functional vision due to the extreme density of the adherent leukoma in the left eye. At the time of the cross modal testing at Shroff’s Eye Hospital, the patient was monocular after cataract surgery with adherent leukoma in the right eye and a cataract with adherent leukoma in the left eye. The visual acuity in the right eye after cataract surgery is counting fingers close to her face.
Vikram is a 15-year-old male with congenital cataracts in both eyes and congenital adherent leukoma which is worse in the left eye than the right eye with nystagmus. His vision was light perception in the right and left eyes upon initial evaluation at Shroff’s Eye Hospital. Cataract surgery was performed on July 21st 2009 in the right eye after a failed surgical attempt at another hospital in 2008 possibly due to corneal complications. The visual acuity after cataract surgery in the right eye in 2009 was counting fingers at 120 cm. At the time of the cross modal testing at Shroff’s Eye Hospital, the patient was monocular after cataract surgery with adherent leukoma in the right eye and cataracts with adherent leukoma in the left eye.
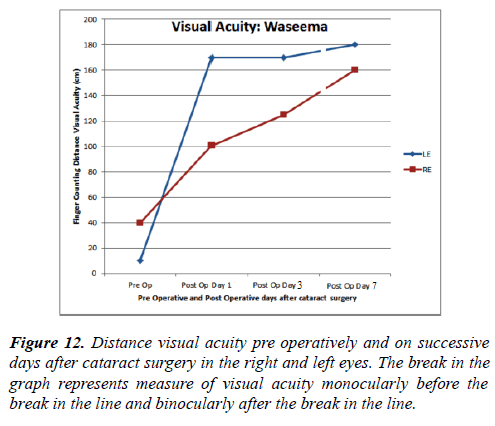
Waseema is a 14 year old female patient who presents with bilateral congenital cataracts. Waseema came to the Prakash Eye Camp before she was referred to Shroff’s Eye Hospital. Her vision was light perception in the right and left eyes upon initial evaluation at the Prakash Eye Camp and Shroff’s Eye Hospital. She also had nystagmus. Waseema had cataract surgery in the left eye on Monday, June 15th 2009 and cataract surgery in right eye on Thursday, June 18th 2009. Her final visual acuity in each eye after surgery was counting fingers at 160 cm in the right eye & 180 cm in the left eye.
Patients: Experiment 2
The three patients and four control subjects who participated in Experiment 2 are described below. Rustom is an 8 year old male who presented with bilateral congenital cataracts. His visual acuity at distance was perception of light with the right and left eyes. Cataract surgery was performed in both eyes just before testing began for the present study. The final visual acuity in each eye after surgery was counting fingers at 100 cm in the right eye & 120 cm in the left eye.
Rahul is a 10 year old male who presented with bilateral congenital cataracts. His visual acuity at distance is perception of light for the right and left eyes. Cataract surgery was performed in the left eye just before testing began for the present study however cataract surgery on the right eye was performed one month before testing began for the present study. Therefore Rahul had approximately one month of monocular visual experience prior to testing. The final visual acuity in the right eye after surgery was counting fingers at 80 cm. and 50 cm in the left eye.
Faisal is a 14 year old male who presented with bilateral cataracts. His visual acuity at distance was perception of light with the right and left eyes with nystagmus. Cataract surgery was performed in the left eye just before testing began for the present study however cataract surgery on the right eye was performed one month before testing began for the present study. Therefore Faisal had approximately one month of monocular visual experience prior to testing. The final visual acuity in the right eye after surgery was counting fingers at 110 cm and 80 cm in the left eye.
Four normal control subjects participated in this study. They were between the ages of 8 to 12 years old. Distance visual acuity for the normal subjects was 20/20 and their ocular history was normal.
Procedures
The following experiments were performed in a well-lit room. The patient was seated comfortably in front of a table.
Experiment 1
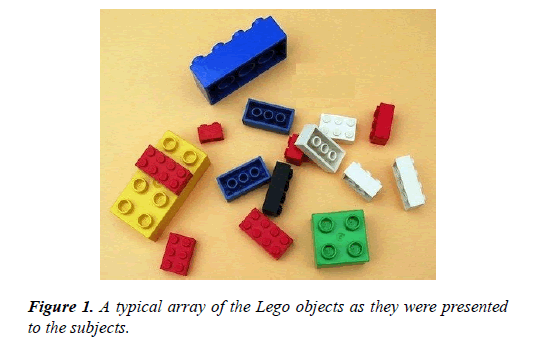
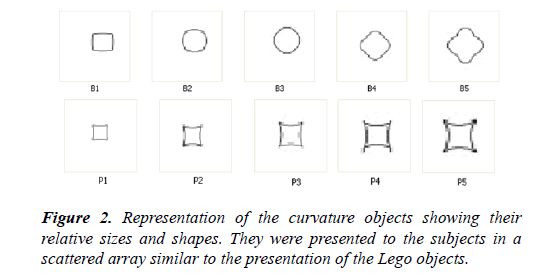
The intramodal and cross-modal tests were performed postoperatively on the three patients described above. Two different sets of objects were used to assess object recognition and its cross-modal transfer using four procedures: tactile-totactile, visual-to-visual, tactile-to-visual, and visual-to-tactile. In the Lego study the subject must differentiate between 15 Lego objects of very different sizes and shapes (Figure 1). In the Curvature study the subject must differentiate among an array of 5 barrel shaped and 5 pincushion shaped flat objects that also had different sizes (Figure 2). Thus, the array had a total of 10 objects.
1. In the tactile-tactile condition, the patient was blindfolded. Fifteen Lego objects or 10 curvature objects were placed on a board in front of where the subject was seated. The patients examined by touch one of the randomly selected Lego objects that the experimenter placed in his/her hand. The subject had 10 seconds to examine each object by touch. The object was then placed back on the board with the other objects. The patient then had to choose by touch which objects he/she had just examined by touch.
2. In the tactile-visual task, the patient was blindfolded when he/she was given a shape to examine first by touch. The subject had 10 seconds to examine each object by touch. The object was then placed back with the other objects. The blindfold was removed and the patient had to visually choose which object he/she had just examined by touch.
3. In the visual-tactile condition the patient had to visually examine each object for 10 seconds. The experimenter took back the object and blindfolded the subject. The object was then placed back on the board with the other objects. The subject then had to examine the objects by touch and select the object he/she had examined visually.
4. In the visual-visual condition the subject had to visually examine an object for 10 seconds. The experimenter replaced the object back on the board while the subject was momentarily blindfolded. When the blindfold was removed, the patient had to visually select the object they had just examined visually.
The testing of the four conditions was always presented in the same order as in 1 through 4 above. Lego testing preceded Curvature testing. Each object in an array was used as the sample object in each condition. Thus, there were 15 trials for each Lego test and 10 trials for each Curvature test. The number of correct responses was divided by the total number of objects and multiplied by 100 to calculate the percentage of correct responses. Table 1 shows correct percentages in the cross modal task for four conditions: tactile-tactile, tactilevisual, visual-tactile, and visual-visual for each patient pre and post-operatively.
Experiment 2
The perception of shape can be assessed in more detail by measuring the error incurred in matching objects of different lengths, aspect ratios and curvatures. In Experiment 2, the perception and visual-to-tactile intermodal transfer of object shape recognition has been assessed before and after cataract surgery.
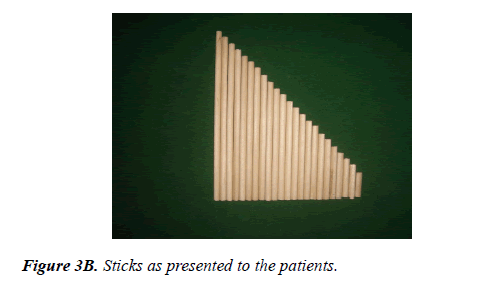
Light colored wooden objects of different lengths, aspect ratios or curvatures were presented on a dark board. The patient was asked to close his/her eyes. One object was handed to the patient on each trial in a pre-determined random order. First the patient was told to carefully examine the object by touch and to remember its characteristics. The patient was given 10 seconds to examine the object by touch. The object was then placed back on the board with the other objects. Then, without touching the object, the patient was asked to visually identify the object among the many others by pointing to it.
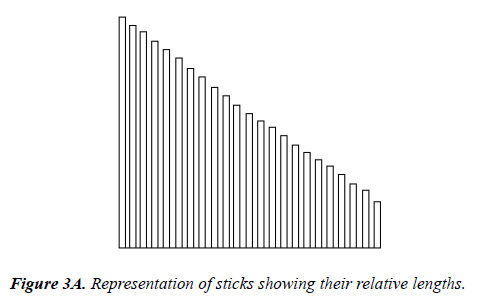
Part I: LengthThe patient was blindfolded and examined a small wooden stick of a specific length by touch. The object was then placed back on the board with the other objects. The patient was then shown the array of 23 sticks of different lengths. The patient had to visually choose the stick that most closely matched the length of the stick that he/she had touched. The patient was not allowed to touch the object sticks while trying to identify the stick of the specified length (Figure 3).
Part 2: Aspect Ratio
Rectangles can look almost like squares if the length of one side is almost the same as the other side. If one side is much longer than the other side a rectangle can look like the sticks presented in part 1. We can define the shape of a rectangle by its aspect ratio which is the ratio of the long side of the rectangle to the small side of the rectangle. In this experiment aspect ratio is the main experimental variable. In addition, the rectangles come in 3 sizes. The small sizes were between 1 to 1.5 cm, medium sizes were between 1.5-2.0 cm, and large sizes were between 2.0-2.5 cm.
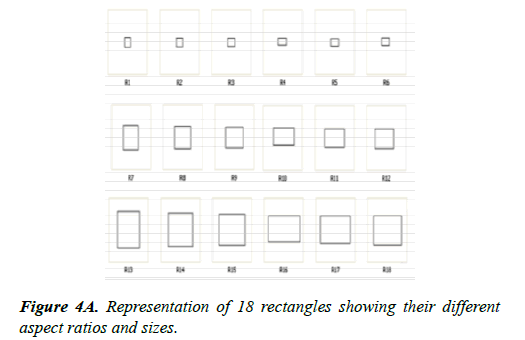
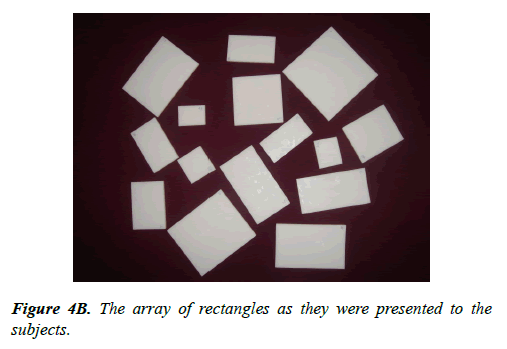
Figure 4A below shows the array of shapes and sizes of the rectangles in this experiment. Objects R1-R6 are the smallsized rectangles of different aspect ratios, R7-R12 show the medium-sized aspect ratios, and R13-18 show the large-sized aspect ratios (Figure 4B). The patient was blindfolded and an object with a specific aspect ratio was examined by touch by the patient. The object was then placed back on the board with the other objects. The patients had to visually choose the object that most closely matched the size and aspect ratio of the object they had touched. The patient was not allowed to touch the objects while trying to visually identify the specified object.
Part 3: Curvature
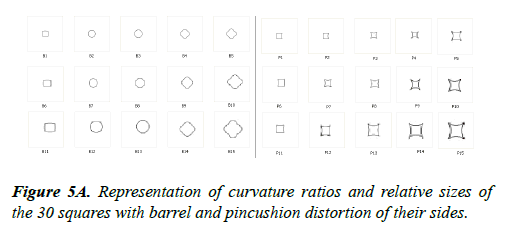
The curvature experiment is based on distorting the sides of a series of squares. The experiment consisted of 15 pincushion shaped objects, squares with their sides curved inward, and 15 barrel shaped objects, squares with their sides bulging outward. There were 3 different sizes (small, medium, and large) for each of the pincushion and barrel objects. B1-B5 and P1-P5 represent small-sized, B5-B10 and P5-P10 represent mediumsized and B10-B15 and P10-P15 represent large-sized objects. The curvature of an object relative to its size, the curvature ratio, was calculated by measuring the distance from the middle of the side to the middle of the opposite side of the square in both directions and then measuring the distance between opposite corners of the square. The cross-corner distance is divided by the cross-side distance to calculate each curvature ratio.
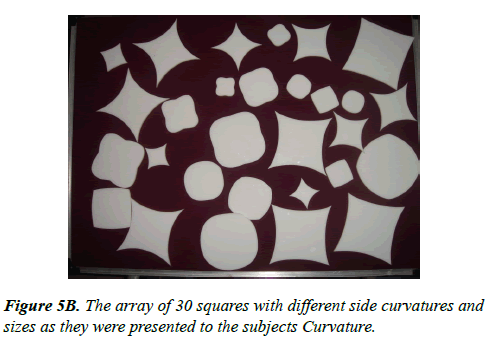
A total of 30 white objects were laid down on a surface of dark solid cardboard. The patient was blindfolded and an object of a specific curvature was examined by touch by the patient. The object was then placed back on the board with the other objects. The patient was then shown the array of objects with different curvatures. The patient had to visually choose the object that closely matched the curvature of the object he/she had just touched. The patient was not allowed to touch the objects when trying to identify the specified object. In the diagram below, “B” refers to barrel shape and “P” refers to pincushion shape.
The length task involves a single one dimensional discrimination. The aspect ratio and curvature tests assessed the patients ’ ability to differentiate their two shape characteristics and the sizes of objects. It should be noted that the number of objects the subject had to choose from in the three parts of Experiment 2 varied. The length test (Part 1) had 23 objects, the aspect ratio test (Part 2) had 18 objects and the curvature test (Part 3) and 30 objects (15 barrels and 15 pincushions) (Figure 5).
In the results for Experiment 2, the first set of graphs show the overall error percent incurred in the experiments. The second set of graphs highlight the sizes of the errors the patients made in when recognizing length, aspect ratio and curvature ratios.
Visual Acuity Measurement
Visual acuity was measured before cataract surgery by assessing the presence of light perception with a pen light at 1.0 meter, hand motion at 1.0 meter in different parts of the visual field and monocular Finger Counting Visual Acuity in the right and left eyes. Post operatively, visual acuity was recorded as the distance at which patients could accurately perform the Finger Counting Test. One, two or four fingers were shown at pre-determined distances. The patients had to accurately state the number of fingers the examiner was holding up and perform this test for 10 trails.
Visual acuity was measured pre-operatively and postoperatively for all patients. In addition, Waseema ’ s visual acuity was measured over time as she was at the Shroff’s Hospital for a longer duration compared to the other patients.
Results
Experiment 1
Table 1 shows the percentages correct in the four conditions of the cross modal task pre-operatively and post-operatively. Deepana and Vikram had cataract surgery performed on only one eye due to corneal disease in both eyes. Waseema had cataract surgery on both eyes.
The table below presents the data twice. The first number represents the percentage correct. It is the number of correct responses divided by the total number of trials (Table 1).
The second number represents the percentage corrected for chance. The following formula was used to calculate this number: xc=(x – c)/(100 – c) where ‘ xc ’ represents the percentage corrected for chance, ‘x’ represents the percentage correct, and ‘c’ represents the number of objects. There were 15 Lego objects and 10 Curvature objects.
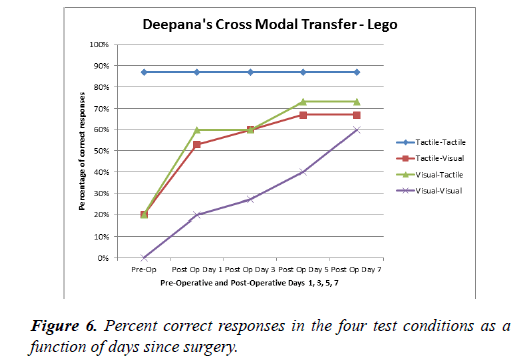
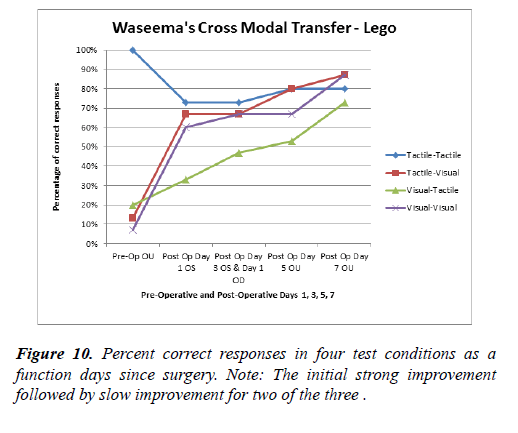
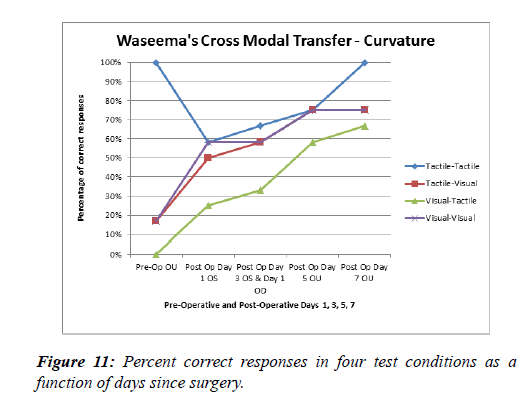
The graphs above represent the percentage correct in the cross modal and intramodal tasks for the Lego and the Curvature tests for each of the patients (Figure 6).
| Lego | Tactile-Tactile | Tactile-Visual | Visual-Tactile | Visual-Visual |
|---|---|---|---|---|
| Deepana | ||||
| Pre-Op | 87%, 85% | 20%, 6% | 20%, 6% | 0%, -18% |
| Post Op Day 1 | 87%, 85% | 53%, 45% | 60%, 53% | 20%, 6% |
| Post Op Day 3 | 87%, 85% | 60%, 53% | 60%, 53% | 27%, 14% |
| Post Op Day 5 | 87%, 85% | 67%, 61% | 73%, 68% | 40%, 29% |
| Post Op Day 7 | 87%, 85% | 67%, 61% | 73%, 68% | 60%, 53% |
| Curvature | ||||
| Pre-Op | 75%, 72% | 25%, 17% | 25%, 17% | 8%, 2% |
| Post Op Day 1 | 75%, 72% | 67%, 63% | 75%, 72% | 100%, 100% |
| Post Op Day 3 | 75%, 72% | 67%, 63% | 75%, 72% | 92%, 91% |
| Post Op Day 5 | 75%, 72% | 75%, 72% | 83%, 81% | 100%, 100% |
| Post Op Day 7 | 75%, 72% | 75%, 72% | 100%, 100% | 100%, 100% |
| Vikram | ||||
| Pre-Op | 100%, 100% | 20%, 6% | 20%, 6% | 20%, 6% |
| Post Op Day 1 | 100%, 100% | 87%, 85% | 100%, 100% | 73%, 68% |
| Post Op Day 3 | 93%, 92% | 73%, 68% | 93%, 92% | 73%, 68% |
| Post Op Day 5 | 100%, 100% | 80%, 76% | 100%, 100% | 80%, 76% |
| Post Op Day 7 | 100%, 100% | 87%, 85% | 100%, 100% | 93%, 92% |
| Curvature | ||||
| Pre-Op | 75%, 72% | 25%, 17% | 33%, 26% | 17%, 8% |
| Post Op Day 1 | 75%, 72% | 42%, 36% | 50%, 44% | 42%, 36% |
| Post Op Day 3 | 83%, 81% | 50%, 44% | 58%, 53% | 42%, 36% |
| Post Op Day 5 | 83%, 81% | 67%, 63% | 83%, 81% | 75%, 72% |
| Post Op Day 7 | 83%, 81% | 75%, 72% | 83%, 81% | 83%, 81% |
| Waseema | ||||
| Pre-Op | 100%, 100% | 13%, 2% | 20%, 6% | 7%, -9% |
| Post Op Day 1 | 73%, 68% | 67%, 61% | 33%, 21% | 60%, 53% |
| Post Op Day 3 | 73%, 68% | 67%, 61% | 47%, 38% | 67%, 61% |
| Post Op Day 5 | 80%, 76% | 80%, 76% | 53%, 45% | 67%, 61% |
| Post Op Day 7 | 80%, 76% | 87%, 85% | 73%, 68% | 87%, 85% |
| Curvature | ||||
| Pre-Op | 100%, 100% | 17%, 8% | 0%, -18% | 17%, 8% |
| Post Op Day 1 | 58%, 53% | 50%, 44% | 25%, 17% | 58%, 53% |
| Post Op Day 3 | 67%, 63% | 58%, 53% | 33%, 26% | 58%, 53% |
| Post Op Day 5 | 75%, 72% | 75%,72% | 58%, 53% | 75%, 72% |
| Post Op Day 7 | 100%, 100% | 75%, 72% | 67%, 63% | 75%, 72% |
Table 1: Percent correct responses in four test conditions as a function of time. The first number represents the percentage correct. The second number represents the percentage corrected for chance.
Deepana performed very well in the tactile-tactile condition in the Lego task. The percentage correct was above 80% for the tactile-tactile task before and after surgery. Her tactile-visual and visual-tactile skills were about 20% preoperatively and improved to better than 50% on postoperative day 1. But then both tasks improved little during the following days. On the visual-visual task performance was at 0% preoperatively and slowly improved to about 70% on the seventh day after cataract surgery (Figure 7).
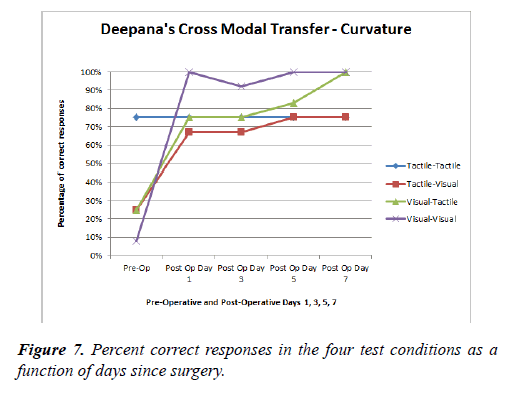
Deepana’s performance was 75% on the tactile-tactile task in the curvature experiment on every day of testing. She performed poorly on the tactile-visual and visual-tactile tasks scoring just 25% correct preoperatively. Her percentage of correct responses improved to about 70% postoperatively on day 1 improving just slightly thereafter. In the visual-visual task she scored 0% correct preoperatively and then on the 1st post-operative day she scored 100% correct and remained at 90% to 100% on the following days.
Deepana performed similarly on the Lego and curvature tasks for tactile-tactile and the intermodal tasks but remarkably different on the visual-visual task. On the curvature visualvisual task she improved slowly after surgery improving up to a 70% correct on day 7 while on the Lego task she went from 0% preoperatively to 100% on post-operative day 1 and remained at this high performance level thereafter (Figures 8,9).
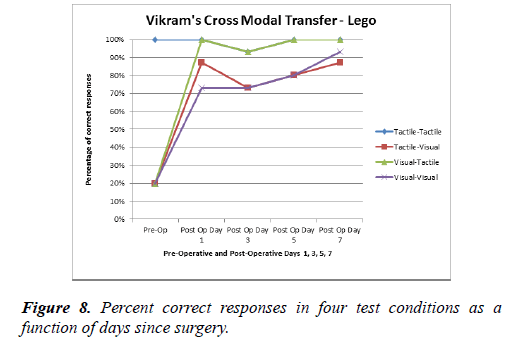
Vikram obtained 100% in the tactile-tactile task in the Lego task pre and postoperatively. Vikram’s percentage of correct responses improved to 87%, 100%, and 73% in tactile-visual, visual-tactile and visual-visual tasks respectively on postoperative day 1 and improved little after that.
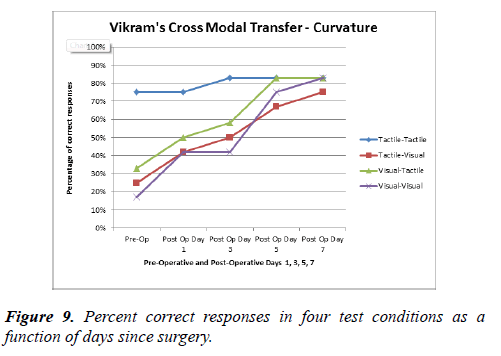
In the Curvature task, Vikram’s percentage correct was above 70% in the tactile-tactile transfer and remained high thereafter. The tactile-visual, visual-tactile, and visual-visual tasks slowly improved over the course of the testing period. Thus the Lego task showed an immediate post-operative improvement but no further improvement during the next week while the curvature task showed a slow improvement during the week after surgery (Figures 10,11).
Waseema had cataract surgery on the right eye 3 days after surgery on the left eye. Therefore pre-operative was before cataract surgery in both eyes. Post-operative day 1 was after cataract surgery in the left eye and post-operative day 3 was 3 days after the first cataract surgery while the right eye had surgery early that morning. Therefore, starting on day 3 postoperative, Waseema had visual experience in both eyes. The experiments were performed binocularly thereafter.
Waseema had 100% correct responses in the tactile-tactile preoperative condition for the Lego task but then performed slightly worse (about 80% correct) after surgery. Her performance in the tactile-visual, visual-tactile, and visualvisual tasks were under 20% pre operatively. Waseema showed improvement to about 60% immediately after surgery on the tactile-visual and visual-visual tasks and then showed only slight improvement over the course of the 7-day testing period. Her visual-tactile performance showed slow improvement and was close to 80% on post-operative day 7. Waseema ’ s performance on the curvature task was very similar to that on the Lego task.
Waseema was the only subject with systematic visual acuity testing (Figure 12). For the left eye there was strong improvement immediately after surgery. The right eye also improved after left eye surgery but showed a lesser improvement when the right eye itself underwent surgery.
| Tactile-Tactile | Tactile-Visual | Visual-Tactile | Visual-Visual | ||
|---|---|---|---|---|---|
| Deepana | Lego | 0% | 32% | 33% | 40% |
| Curvature | 0% | 40% | 40% | 43% | |
| Vikram | Lego | 3% | 44% | 51% | 37% |
| Curvature | 5% | 27% | 35% | 19% | |
| Waseema | Lego | 0% | 31% | 20% | 24% |
| Curvature | 0% | 27% | 30% | 30% |
Table 2. Trend analysis for each patient for four test conditions.
Trend analysis is used in the present study to assess how patients’ performance changes over time. A linear trend line is modeled in the present study by y=mx+c where x and y are the variables, m is the slope and c is the ‘y’ intercept. Trend analysis was calculated using Excel software. Table 2 shows the trend analysis for each patient for both the Lego and Curvature tasks. The analysis shows relatively similar changes for the all three subjects and tasks. Deepana showed about a 40% improvement in the visual-visual and intermodal tasks for both the Lego and Curvature tasks. Vikram showed a greater improvement for the Lego than the curvature tests and the least improvement for the visual-visual task in both cases. Waseema showed similar changes for the visual-visual and intermodal tasks for both the Lego and Curvature tests. Cross modal transfer improved after cataract surgery in all cases. Since Waseema had cataract surgery in both eyes at the time of testing she should have shown a larger improvement than the other two children but this was not the case.
Experiment 2
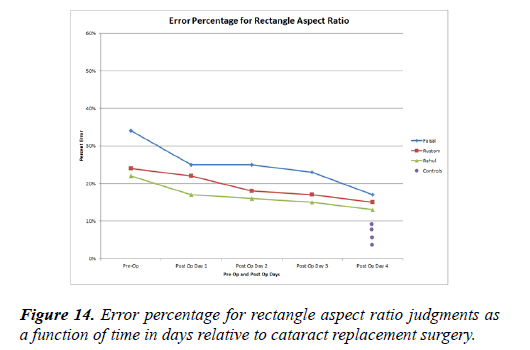
The table below shows the error percentage for stick length, aspect ratio, and curvature ratio for three patients and four control subjects. Note that these are different subjects than in experiment 1 and each control subject performed the experiment just once. The data listed below shows just the one trial for each control patient (Table 3).
| Faisal | Rustom | Rahul | Controls | |
|---|---|---|---|---|
| Error Percentage for Stick Length | ||||
| Pre-Op | 52% | 31% | 31% | |
| Post Op Day 1 | 35% | 28% | 29% | |
| Post Op Day 2 | 32% | 24% | 24% | |
| Post Op Day 3 | 29% | 23% | 24% | |
| Post Op Day 4 | 23% | 22% | 19% | 9%, 10%, 10%, 2% |
| Error Percentage for Rectangle Aspect Ratio | ||||
| Pre-Op | 34% | 24% | 22% | |
| Post Op Day 1 | 25% | 22% | 17% | |
| Post Op Day 2 | 25% | 18% | 16% | |
| Post Op Day 3 | 23% | 17% | 15% | |
| Post Op Day 4 | 17% | 15% | 13% | 7%, 9%, 6%, 4% |
| Error Percentage for Curvature Ratio | ||||
| Pre-Op | 54% | 38% | 40% | |
| Post Op Day 1 | 43% | 22% | 30% | |
| Post Op Day 2 | 32% | 18% | 27% | |
| Post Op Day 3 | 28% | 17% | 26% | |
| Post Op Day 4 | 28% | 15% | 21% | 6%, 2%, 9%, 3% |
Table 3. Error percentage for stick length, rectangle aspect ratio, and curvature ratio as a function of time in days after surgery. Each of the four control subject performed the experiment once.
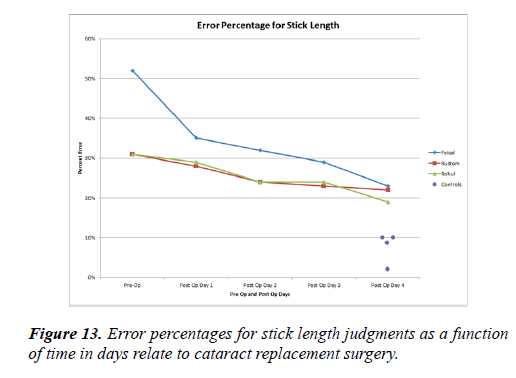
Figure 13 shows error percentage in tactile-to-visual transfer of stick length pre-operatively and four days post operatively. Faisal had the largest pre-operative error percentage at 50% compared to Rustom and Rahul who had about a 30% error rate preoperatively. Faisal showed a large improvement in error percentage of about 15% between preoperatively and 1 day post operatively. Rustom and Rahul showed almost no change in error percentage (about 2-3%) between the preoperative and 1 day post-operative measurement. The three subjects continued to show an improvement of about 2-3% each day after the initial post-operative measurement. The four control subjects showed 10% or less error rates.
Figure 14 shows error percentages in the tactile-visual transfer of rectangle aspect ratio judgments. Faisal showed the largest error percentage at 34% pre operatively. Rustom and Rahul showed a 22% and 24% error respectively. Post operatively, Faisal showed the largest decrease in error percentage (10%) on post-operative 1 day. Rustom and Rahul showed just a 2% and 3% error decrease, respectively. Rustom’s day 1 postoperative measurement was 22% and Rahul’s was 18%. Faisal, Rustom and Rahul showed a 2-3% day-by-day decrease in error percentage post-operatively. On post-operative day 4, Faisal, Rustom and Raul’s error percentages were 17%, 15% and 14%, respectively. The four control subjects showed less than a 10% error in the tactile-to-visual transfer of rectangle aspect ratio.
Although Faisal showed a worse performance preoperatively, the three patients showed a relatively similar pattern of postoperative improvement. On day 4 they had a mean error rate of 15% while the control subjects had a mean rate of just 6.5%.
The patient who had cataract surgery performed in both eyes (Rustom) just prior to testing and the two patients (Faisal and Rahul) who had one cataract removed a month earlier showed similar postoperative error rates and improvement rates.
All three patients demonstrated a small decrease in errors the day after surgery and showed slow improvement thereafter.
Figure 15 shows the error percentages incurred in the tactileto- visual transfer of judgments about the curvature of the edges of squares. Faisal showed the largest error percentage preoperatively at 55% while Rustom’s percent error was 40% and Rahul’s percent error was 38% pre operatively. Faisal and Rahul showed a 10% improvement in error percentage the day after surgery. Rustom showed a 16% decrease in errors on the day after surgery. All three patients showed a slow improvement thereafter until at day 4 their error rates were about half that of the preoperative day. The four control subjects showed less than a 10% error rate in the tactile-tovisual transfer of rectangle aspect ratio.
The trend analysis table above shows the improvement seen in each of the three patients for the Length, Aspect Ratio and Curvature paradigms (Table 4). Faisal ’ s improvement was better than Rustom’s and Rahul’s performance in all of the three studies, perhaps because he started pre-operatively with the worst performance. All three patients showed the greatest improvement in the Curvature experiment.
| Faisal | Rustom | Rahul | |
|---|---|---|---|
| Length | 47% | 30% | 31% |
| Aspect Ratio | 32% | 24% | 21% |
| Curvature | 50% | 32% | 37% |
Table 4. Trend analysis for each patient for stick length, aspect ratio, and curvature ratio.
Amplitude of length, aspect ratio and curvature ratio errors
In the previous section we have seen how the number of length, aspect ratio and curvature ratio errors decreases with time after surgery. However the amount of the individual errors can also reveal how well the patients can perform on these perceptual tasks. For example are there grossly inaccurate errors pre-surgically but only small errors post-operatively? In addition, the testing of aspect ratios and curvature are confounded by the fact that the selected shapes come in three sizes and all three sizes were presented as a group. From this data we now wish to determine how large the individual errors are and if the subjects perform better when matching the larger objects. Secondarily, we ask if they make size errors, choosing the right shape but the wrong size because the aspect ratio task and the curvature task both tested the patients ’ ability to differentiate between sizes (small, medium, and large) as well as the main factor in those tests.
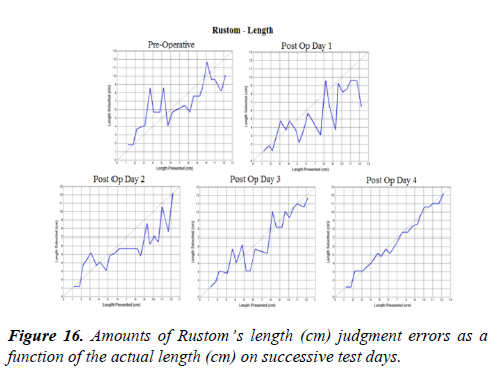
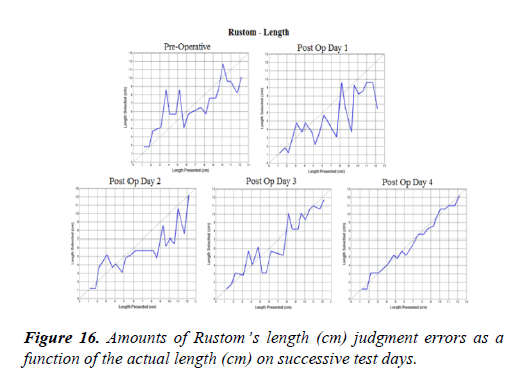
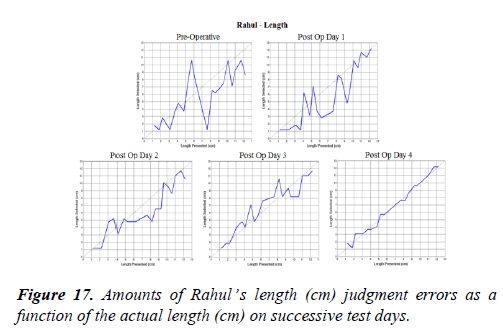
Lengths
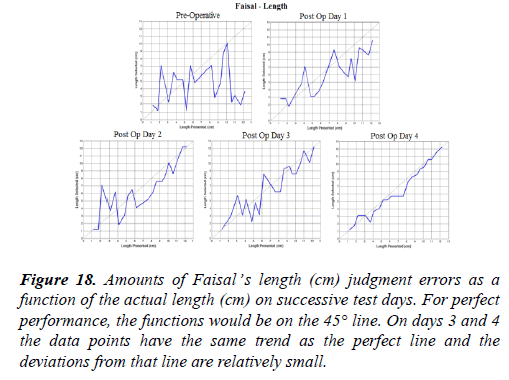
The precision of cross modal perceptions of length are especially informative because the task is cognitively the simplest. Just one dimension is being tested. We can easily measure that dimension and make an absolute estimate of the tactile-to-visual transfer precision. The relative sizes of stick length are shown in figures 16 to 19. The length ranged from 1.2 cm to 12.2 cm with each increasingly long stick increasing by about 1.0 cm (Figures 16-18).
