Research Article - Biomedical Research (2017) Volume 28, Issue 18
T helper cell 1 (Th1)/Th2 cytokine profile in the ovalbumin-induced rat model of otitis media with effusion
Hua Liu1,2, Shouqin Zhao1*, Jie Li3, Danni Wang1, Yang Wang1, Ying Li1
1Department of Otolaryngology Head and Neck Surgery, Beijing Tong Ren Hospital, Capital Medical University, Key Laboratory of Otolaryngology Head and Neck Surgery (Capital Medical University), Ministry of Education, Beijing 100730, PR China
2Department of Otolaryngology, Tangshan Workers′ Hospital, Hebei Medical University, Tangshan 063000, Hebei, PR China
3Department of Otolaryngology, Fuxing Hospital, Capital Medical University, Beijing 100038, PR China
- *Corresponding Author:
- Shouqin Zhao
Department of Otolaryngology Head and Neck Surgery
Beijing Tongren Hospital
Key Laboratory of Otolaryngology Head and Neck Surgery (Capital Medical University)
Ministry of Education, PR China
Accepted date: November 24, 2016
Abstract
Otitis media with effusion (OME) is a disease with a complicated pathogenesis that remains unclear. Previous studies have shown that allergy is one of the pathogenic factors involved in OME. However, the regulatory mechanism of allergy in OME is unknown. This study evaluated the T helper cell 1 (Th1)/Th2 polarization tendency in the middle ear microenvironment. To investigate the differentiation of Th cells in the middle ear of a rat model of OME, 20 Sprague-Dawley rats were randomly divided into an OME group (Exp group) and a control group (Con group). The levels of interferon (IFN)-γ and IL-4 in the tympanic lavage fluid were evaluated by ELISA. Additionally, the levels of IFN-γ and IL-4 in the middle ear mucosa and bone marrow cavity were examined by immunohistochemistry. Compared to those in the Con group, the levels of IL-4 and ratio of Th2/Th1 (IL-4/IFN-γ) in the tympanic lavage fluid, middle ear mucosa, and bone marrow of the Exp group were increased significantly, whereas there was no significant difference in IFN-γ levels between groups. The expression of IL-4 in the middle ear highly increased following allergy stimulation, whereas the expression of IFN-γ was decreased. A Th1/Th2 immune response imbalance results in a Th2 response in the middle ear microenvironment of an allergic OME rat model.
Keywords
Th1, Th2, Rat, Otitis media with effusion, Immunohistochemistry
Introduction
Otitis media with effusion (OME) is one of the main threats to children's health, but its pathogenesis is unclear. As an etiologic factor of OME, the relationship between allergic disease and OME has been widely investigated [1]. However, the regulatory mechanism of allergy during OME is unclear [2]. Recent studies have shown that different antigens induce T helper cells into a polarized reaction, producing two types of effector cells (Th1 and Th2). This plays an important role in the development of allergic diseases [3]. In this study, we evaluated the expression of the Th2 type cytokine interleukin 4 (IL-4) and Th1 type cytokine γ-interferon (IFN-γ) in tympanic lavage fluid of the middle ear in a rat model of OME to analyze the Th1/Th2 polarization tendency in the middle ear microenvironment.
Materials and Methods
Experimental animals
Twenty male Sprague-Dawley rats weighing 250-300 g (SPF, Beijing Weitonglihua Experimental Animals Technology Co., Ltd., Beijing, China) were randomly grouped into an experimental group and a control group. Each group contained 10 rats (20 ears); however, two in the experimental group and one in the control group died due to anesthesia complication. All rats were examined by electric auriscope to exclude any infection in the external auditory meatus or in middle ear. This study was carried out in strict accordance with the recommendations in the Guide for the Care and Use of Laboratory Animals of the National Institutes of Health. The animal use protocol has been reviewed and approved by the Institutional Animal Care and Use Committee (IACUC) of Beijing Tongren Hospital.
Molding method
We used the Hardy SM molding Method as described previously [4]. In the experimental group, rats were sensitized to ovalbumin (OVA) (1.2 mg ovalbumin OVA, V, Sigma level, the United States) via subcutaneous injection of 1.2 mg OVA in 0.6 mL phosphate-buffered saline solution (PBS) mixed with 5.14 mg aluminum hydroxide in 0.6 ml PBS as a local adjuvant. On day 8, the process was repeated once, which was considered the systemic sensitization stage. On day 15, we performed anesthesia via intraperitoneal injection of 10% chloral hydrate (15 mg/kg). Under a surgical microscope, 0.1 mg OVA dissolved in 35 μL PBS was injected into the middle ear cavity of the rat with a micro syringe through the tympanic membrane. On day 16, we anesthetized the rats again, observed the tympanic membrane, and repeated the second injection. This was defined as the ear stimulation stage. This procedure was used to prepare the OME model. For the control group, 5.14 mg aluminum hydroxide dissolved in 1.2 mL PBS was intraperitoneally injected during the systemic sensitization stage, while during the ear stimulation stage we used PBS rather than OVA. On day 18, we sacrificed these rats and removed the bilateral middle ear. We used 50 μL PBS to wash the middle ear cavity three times and collected 150 μL of lavage fluid. After 10 min of centrifugation at 1500 rpm, we froze the supernatant fluid in -80°C until cytokine detection. Bilateral middle ear tissue samples were fixed with 4% paraformaldehyde and decalcified with 10% nitric acid solution. After dehydration, paraffin-embedded slices were prepared. Next, we used a microscope to examine the pathological changes in the middle ear and Eustachian tube which had been stained by routine hematoxylin and eosin staining and counted the eosinophils. The expression of IL-4 and IFN-γ in the middle ear mucosa and marrow cavity was evaluated by immunohistochemistry. Mast cells were counted following toluidine blue staining.
Measuring of cytokine expression in washing solutions of the middle ear
The expression of IFN-γ and IL-4 in tympanic lavage fluid was measured by ELISA (Jingmei Biological Engineering Co., Ltd., Yancheng, China). First, we drew a standard curve according to the standard concentration of substance primitive that kit shown. Next, we tested the light absorbance of each sample by ELISA at a wavelength of 450 nm. These values were compared with the standard curve to determine the sample concentrations. The calculated average concentration included data that was lower than the lowest standard density (IL-4 7 pg/ml; IFN-γ 15 pg/ml).
Immunohistochemistry
The levels of IFN-γ and IL-4 in the middle ear mucosa and marrow cavity were measured using an immunohistochemistry kit (Jingmei Biological Engineering Co., Ltd.) with the ABC method. The operations are as follows. First, the samples were dewaxed using standard procedures. Second, samples were boiled in PBS (0.01 mM, pH 7.0) for 6 min in order to repair the antigens. Third, samples were soaked in 3% H2O2 for 10 min and then washed with PBS 3 times. Finally, we used 10% goat serum to block non-specific antigens at room temperature for 20 min. We added rabbit biotinylation fluid at 37°C incubation for 40 min and washed the samples three times with PBS. Albumin fluid labeled by horseradish peroxidase was added. After incubation for 30 min at 37°C, the samples were washed three times with PBS and then stained with 3, 3′- diaminobenzidine. Next, the samples were counter-stained with hematoxylin, gradually dehydrated, and sealed by neutral gum. We used PBS to rather than primary antibodies for the control group.
Method of cell counting
For inflammatory cell counting, an eyepiece was matched with the counting lattice. Next, under the low power lens, we choose five visual fields containing a greater number of positive than negative cells. The fields were selected in the lamina propria of the middle ear mucosa epithelium and bone marrow cavity. Under high power-magnification, we counted the cells and recorded the mean differences. The result is expressed as the mean ± standard deviation. To count IL-4- and IFN-γ-positive cells, an eyepiece was matched with the counting lattice. Brown-dyed cytoplasmic granules and/or the nucleus were selected in positive cells. Next, similar to the procedure of inflammatory cell counting, under a low-power lens five visual fields containing a greater number of positive than negative cells were chosen. The fields were selected in the lamina propria of the middle ear mucosa epithelium and bone marrow cavity. The cells were counted under high-power magnification. The ratio of positive cells was calculated. The ratio can be used as an index to evaluate cytokine activity. The result was recorded in the form of mean ± standard deviation.
Ratio of positive cells=positive cells in brown-dyed cytoplasmic granules and/or nucleus/all cells in the counting lattice × 100%.
Statistical analysis
We used the statistical package SPSS11.5 (SPSS, Inc., Chicago, IL, USA). Groups were compared using the means of the independent-samples t-test. Values were considered statistically significant when P<0.05 (two-sided test).
Results
Result of molding
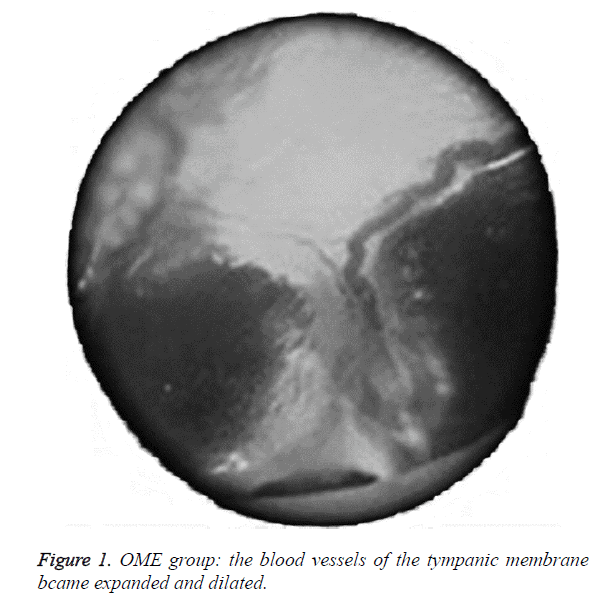
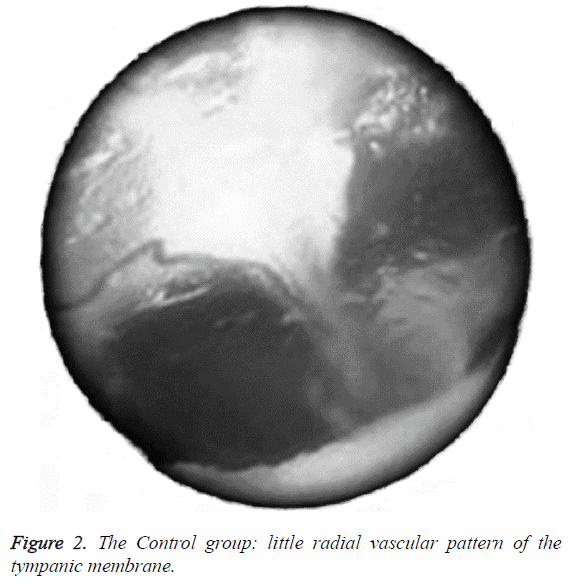
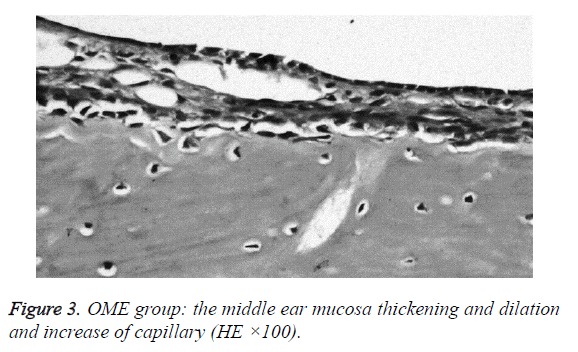
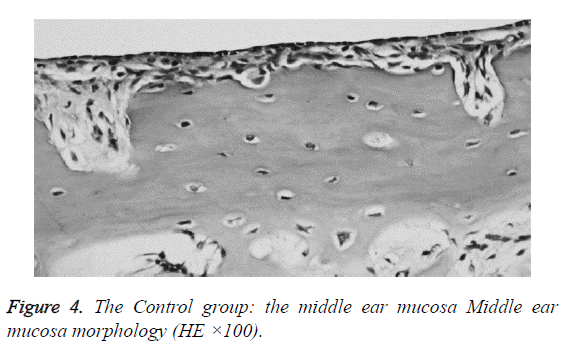
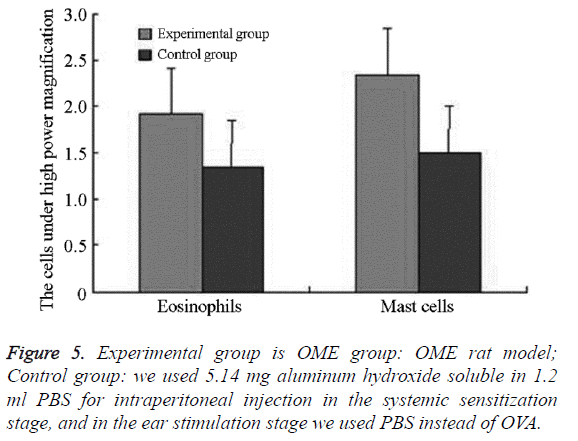
We examined all rats with otoscopes each day after injections. The tympanic membrane and its surrounding tissue in the experiment group became hyperemic after the first 24 h. The blood vessels of the tympanic membrane became expanded and were dilated radially. Next, the vessels became prominently sunken and hyperemic after 48 h. In some rats, we observed liquid and gas bubbles in the middle ear (Figure 1). The control group was generally normal. Some rats showed a slight radial vascular pattern (Figure 2). Samples of the tympanic segment of Eustachian tube and middle ear were successfully obtained from the eight rats in the experimental group (16 ears) and nine in control group (18 ears). The pathological study of the experimental group showed that the epithelium of the Eustachian tube tympanic segment was swollen, disrupted, and partially missing cilia (Figures 3 and 4); the middle ear mucosa was thickened, dilated, and showed increased capillaries (Figures 3 and 4). In addition, the submucosa of the middle ear and bone marrow cavity showed an increased number of eosinophils, lymphocytes, and neutrophils. Furthermore, there was increase in the number and degranulation of mast cells in the surrounding tissue of the Eustachian tube. The number of the eosinophils in the middle ear mucosa or bone marrow cavity and the mast cells in tissues around the Eustachian tube in the experimental group were significantly greater than those in the control group (P<0.05) (Figure 5 and Table 1).
| Group | Rat ears (cases) | Eosinophils | Mast cells |
|---|---|---|---|
| Experimental group | 16 | 1.925 ± 0.484* | 2.35 ± 0.459* |
| Control group | 18 | 1.35 ± 0.329* | 1.500 ±0.354* |
| t | -4.091 | -6.125 | |
| P | <0.01 | <0.01 |
Table 1. The number of the eosinophils in the middle ear mucosa or bone marrow cavity, the mast cells in tissues around the Eustachian tube (![]() ).
).
Changes of IL-4 and IFN-γ in the middle ear washing fluid
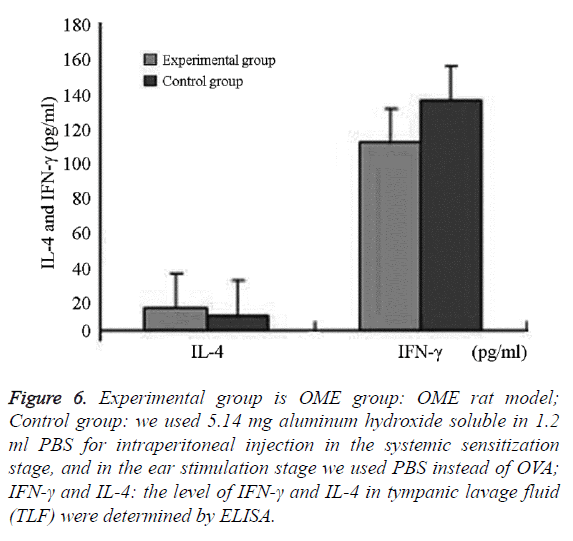
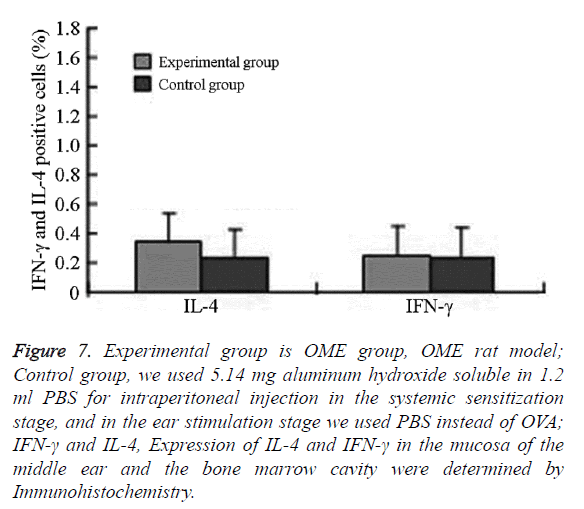
We successfully collected the middle ear washing fluids from eight ears (of 16 ears) in the experimental group and nine ears in the control group (of 18 ears). The IL-4 levels and IL-4/IFN- γ ratio in the experimental group were significantly higher than that in the control group (P=0.006; P=0.037, P<0.05). IFN-γ in the experimental group was lower than that in the control group, without significant differences between the groups (P=0.685, P>0.05) (Figures 6 and 7 and Table 2).
Figure 6: Experimental group is OME group: OME rat model; Control group: we used 5.14 mg aluminum hydroxide soluble in 1.2 ml PBS for intraperitoneal injection in the systemic sensitization stage, and in the ear stimulation stage we used PBS instead of OVA; IFN-γ and IL-4: the level of IFN-γ and IL-4 in tympanic lavage fluid (TLF) were determined by ELISA.
Figure 7: Experimental group is OME group, OME rat model; Control group, we used 5.14 mg aluminum hydroxide soluble in 1.2 ml PBS for intraperitoneal injection in the systemic sensitization stage, and in the ear stimulation stage we used PBS instead of OVA; IFN-γ and IL-4, Expression of IL-4 and IFN-γ in the mucosa of the middle ear and the bone marrow cavity were determined by Immunohistochemistry.
| Groups | Rat ears (cases) | IL-4 (pg/ml) | IFN-γ (pg/ml) | IL-4/IFN-γ (concentration) | IL-4 positive cells (%) | IFN-γ positive cells (%) | IL-4 /IFN-γ positive cells (%) |
|---|---|---|---|---|---|---|---|
| Experimental group | 16 | 13.076 ± 6.029* | 107.392 ± 54.804 | 0.139 ± 0.077* | 0.338 ± 0.119* | 0.253 ± 0.056 | 1.357 ± 0.498* |
| Control group | 18 | 8.312 ± 3.753.* | 132.56 ± 94.198 | 0.087 ± 0.052* | 0.220 ± 0.080* | 0.242 ± 0.092 | 0.979 ± 0.389* |
| t | -2.8 | 0.965 | -2.328 | -3.118 | -0.351 | -2.179 | |
| P | 0.009 | 0.343 | 0.026 | 0.004 | 0.729 | 0.41 |
Experimental group is OME group: OME rat model; Control group: we used 5.14 mg aluminum hydroxide soluble in 1.2 ml PBS for intraperitoneal injection in the systemic sensitization stage, and in the ear stimulation stage we used PBS instead of OVA; IFN-γ and IL-4: the level of IFN-γ and IL-4 in tympanic lavage fluid (TLF) were determined by ELISA.
Table 2. IL-4 and IFN-γ in the washing fluids, mucosa of the middle ear and the bone marrow cavity ( ).
).
Expression of IL-4 and IFN-γ in the mucosa of the middle ear and bone marrow cavity
In the experimental group, IL-4 was mainly expressed in eosinophils, neutrophils, and lymphocytes in the submucosa in the middle ear and bone marrow cavity. The expression of IL-4 in the experimental group was significantly higher than that in the control group.
The difference was statistically significant (P=0.001, P<0.05) IFN-γ was mainly expressed in eosinophils, neutrophils, lymphocytes, and epithelial cells in the submucosa in the middle ear and bone marrow cavity. The expression of IFN-γ in the experimental group was higher than that in the control group without significant difference (Figures 6 and 7 and Table 2).
Discussion
With the development of immunology and molecular biology, the mechanism of immunological regulation in OME has gained attention. As the mediators of immunological regulation and inflammatory reactions, T helper cells and cytokines have been widely evaluated. Currently, there is epidemiological evidence supporting the allergic disease as a risk factor for OME [5-7].
T helper cells (Th) play a major role in the allergic inflammatory response. The "Th1/Th2 balance hypothesis" proposes that reactions to antigens depend on the interaction between of immune cells and their products. T helper cells differentiate into two different effector cells upon reacting with different antigens (Th1 and Th2 cells). They mount different immune responses and co-regulate each other. Th1 cells secrete cytokines (IL-2, IFN-γ) involved in autoimmune diseases and chronic infection, whereas Th2 cells secrete cytokines (IL-4, IL-5, IL-9, and IL-13) that regulate and augment allergic inflammation. Studies have shown that asthma and allergic rhinitis are diseases showing an abnormal immune response, which is characteristic of an imbalance between the Th1 and Th2 immune response. Inflammation is mainly caused by a Th2 immune response in the respiratory mucosa. The main histopathological feature is large amounts of Th2 cytokines in the tissue [8-10]. Furthermore, the lymphocyte subtypes ratio (T/B, CD4+/CD8+, αβT/γδT) are similar to those of the nasal mucosa [11-13]. Thus, the middle ear mucosa is derived from the upper respiratory system and has a similar immune function as the upper respiratory mucosa. Th1 cells produce IFN-γ, which acts on its target cells by binding to multimeric cell-membrane receptors, while Th2 cells express IL-4, which is a major determinant of the Th2 phenotype. The main signal transduction pathway that mediates IL-4 signals is well documented by Nelms, and starts with the binding of IL-4 to its receptor, IL-4R, which is also preferentially expressed in Th2 cells. The IL-4R signal is transduced by STAT-6, which in turn activates GATA-3. GATA-3 itself can induce IL-4, thus establishing a positive feedback loop. Additionally, the influence of the IL-4 pathway on IFN-r is down-regulated. In order to observe the polarization tendency of T helper cells in the microenvironment of the middle ear, we measured IL-4 and IFN-γ levels in the middle ear fluid of rats in this study. The results showed that IL-4 levels in the middle ear effusion in experimental rats were markedly elevated and the Th2/Th1 ratio was significantly increased. These results agree with those observed in OME patients [14,15], confirming that OME can be induced by upper airway allergy. However, the level of Th1-type cytokines IFN-γ of the middle ear effusion was somewhat lower in the experimental group than in the control group, but the difference was not significant. This result is similar to that of Sun et al. [16-19] and may be related to variations in cytokine secretion, the distribution of discrete data, and the small number of samples included. Furthermore, an improved study with a larger number of experimental rats will be performed in the near future in order to evaluate the mechanism of OME. Our findings confirmed that the middle ear mucosa is a continuation of the upper respiratory mucosa, which is immuno-active. Following exposure to allergens, T cell in the middle ear microenvironment was activated. As a result, a Th polarization response favoring Th2 cells and their cytokines, which is characteristic of type I hypersensitivity, occurred. This can enhance transcription of the IL-4 gene and promote the expression of IL-4, leading to the proliferation and differentiation of Th2 cells in the rat middle ear microenvironment.
Our study showed that an “imbalance in Th1/Th2” is the most important mechanism of OME. Thus, our results may be valuable clinically for estimating the progress of OME by detecting cytokine levels. Further investigations of the regulation of Th2/Th1 polarization in the middle ear microenvironment are warranted to clarify the inflammatory process of OME.
Acknowledgements
This work was supported by the National Natural Science Foundation of China (Grant No.81070777). URL: http://npd.nsfc.gov.cn/. The authors thank Erzhong Fan, Department of Otolaryngology Head and Neck Surgery, Beijing Tong Ren Hospital, Capital Medical University, Key Laboratory of Otolaryngology Head and Neck Surgery (Capital Medical University), for his invaluable technical and scientific assistance without which this project could not have taken place.
References
- Kwon C, Lee HY, Kim MG, Boo SH, Yeo SG. Allergic diseases in children with otitis media with effusion. Int J Pediatr Otorhinolaryngol 2013; 77: 158-161.
- Barrett NA, Austen KF. Innate cells and T helper 2 cell immunity in airway inflammation. Immunity 2009; 31: 425-437.
- Hardy SM, Heavner SB, White DR, McQueen CT, Prazma J, Pillsbury HC. Late-phase allergy in the development of Eustachian tube dysfunction. Otolaryngol Head Neck Surg 2001; 125: 339-345.
- Juhn YJ, Wi CI. What does tympanostomy tube placement in children teach us about the association between atopic conditions and otitis media? Curr Allergy Asthma Rep 2014; 14: 447.
- Alles R, Parikh A, Hawk L, Darby Y, Romero JN. The prevalence of atopic disorders in children with chronic otitis media with effusion. Pediatr Allergy Immunol 2001; 12: 102-106.
- Jang CH, Jung JK. Expression of mast cell tryptase in pediatric otitis media with effusion. Int J Pediatr Otorhinolaryngol 2003; 67: 1185-1188.
- Hurst DS. The role of allergy in otitis media with effusion. Otolaryngol Clin North Am 2011; 44: 637-654, viii-ix.
- Kariya S, Okano M, Hattori H, Sugata Y, Matsumoto R. TH1/TH2 and regulatory cytokines in adults with otitis media with effusion. Otol Neurotol 2006; 27: 1089-1093.
- Zhang L, Zhou B, Han DM. Research allergic rhinitis (a) of the pathogenesis of China. Otolaryngol Head Neck Surg 2003; 10: 316-320.
- Suenaga S, Kodama S, Ueyama S, Suzuki M, Mogi G. Mucosal immunity of the middle ear: analysis at the single cell level. Laryngoscope 2001; 111: 290-296.
- Nguyen LH, Manoukian JJ, Sobol SE, Tewfik TL, Mazer BD, Schloss MD, Taha R, Hamid QA. Similar allergic inflammation in the middle ear and the upper airway: evidence linking otitis media with effusion to the united airways concept. J Allergy Clin Immunol 2004; 114: 1110-1115.
- Nguyen LH, Manoukian JJ, Tewfik TL, Sobol SE, Joubert P, Mazer BD, Schloss MD, Taha R, Hamid QA. Evidence of allergic inflammation in the middle ear and nasopharynx in atopic children with otitis media with effusion. J Otolaryngol 2004; 33: 345-351.
- Sobol SE, Taha R, Schloss MD, Mazer BD, Manoukian JJ, Tewfik TL, Hamid Q. T(H)2 cytokine expression in atopic children with otitis media with effusion. J Allergy Clin Immunol 2002; 110: 125-130.
- Wright ED, Hurst D, Miotto D, Giguere C, Hamid Q. Increased expression of major basic protein (MBP) and interleukin-5 (IL-5) in middle ear biopsy specimens from atopic patients with persistent otitis media with effusion. Otolaryngol Head Neck Surg 2000; 123: 533-538.
- Sun R, Hong S, Tang X. The expression of cytokines in experimental otitis media with effusion. Lin Chuang Er Bi Yan Hou Ke Za Zhi 2005; 19: 170-172.
- Pahl HL. Activators and target genes of Rel/NF-kappaB transcription factors. Oncogene 1999; 18: 6853-6866.
- Das J, Chen CH, Yang L, Cohn L, Ray P. A critical role for NF-kappa B in GATA3 expression and TH2 differentiation in allergic airway inflammation. Nat Immunol 2001; 2: 45-50.
- Li-Weber M, Giaisi M, Baumann S, Pálfi K, Krammer PH. NF-kappa B synergizes with NF-AT and NF-IL6 in activation of the IL-4 gene in T cells. Eur J Immunol 2004; 34: 1111-1118.
