Research Article - Current Pediatric Research (2022) Volume 26, Issue 8
STOPS as a prognostic indicator for outcome of new born babies admitted in NICUâ??s of central India.
Jean Pratheesh J*, Jagdish Chandra Mandliya, AkhanshaMuvel
Department of Pediatrics, RD Gardi Medical College, Ujjain (MP), India
- *Corresponding Author:
- Jean Pratheesh J
Department of Pediatrics
RD Gardi Medical College
Ujjain (MP)
India
E-mail: drjeanpratheesh94@gmail.com
Received: 04 August, 2022, Manuscript No. AAJCP-22-72072; Editor assigned: 05 August, 2022, PreQC No. AAJCP-22-72072 (PQ); Reviewed: 08 August, 2022, QC No. AAJCP-22-72072; Revised: 15 August, 2022, Manuscript No. AAJCP-22-72072(R); Published: 29 August, 2022, DOI:10.35841/0971-9032.26.8.1593-1597.
Abstract
Background: STOPS is a simple physiological scoring tool that can be effectively applied even in a very small/resource limited NICU set up. Aim and Objective: To estimate the prognostic accuracy of outcome of babies admitted in NICU of Ujjain city. Material and Methods: The current study was a prospective observational study. All admitted babies in neonatal intensive care unit of Ujjain city in RD gardi medical college, UCTH hospital and CharakBhawanhospital Ujjain, MP were part of the study. STOPS scoring is done at the time of admission and followed up to look for their outcome death/discharge (duration of stay). The data was collected using a Scoring system “STOPS” which include sensorium, temperature, oxygenation, perfusion and sugar. Results: The stops score Predicts the accuracy of mortality when the score cut off >2 among all the cases are 83%. In our present study, all the samples were taken during the time of admission in NICU. Our study included 184 out of which males were (64.1%) and females were (35.9%). In our study we found that 52 babies had a STOP score of >2 and 132 had ≤ 2 STOP score. 34.5% of the babies died who had a perfusion STOPS score of 1. In our study out of the 12 babies with sugar STOPS score 1, in which 7(58.3%) of the babies died. Also we found that out of the 37 VLBW babies, 8(21.6%) had mortality. Conclusion: The present study explained that STOPS was a good prognostic indicator and useful in predicting the outcome of the babies admitted in NICU.
Keywords
STOPS, NICU, Newborn, Prognosis.
Introduction
Globally there were 2.4 million children deaths reported in the first month of life in the year 2019. Further an approximate number of deaths of new born per day were 6700. The Infant Mortality Rate (IMR) is an indicator of overall health scenario of a country or a region. In the last ten years, IMR has witnessed a decline of about 35% in rural areas and about 32% in urban areas. In India level has declined from 50 to 32 in the last decade. The corresponding decline in rural areas is 55 to 36, and for urban areas it is from 34 to 23.
Despite the decline in IMR over the last decades, one in every 31 infants die within first year of their life at the national level (irrespective of rural and urban); one in every 28 infants in rural areas and one in every 43 infants in urban areas still die within one year of life. Among the states/union territories, the IMR ranges from 4 in Nagaland to 48 in Madhya Pradesh for 2018 [1]. Hence, there is a need for reliable and simple scoring systems to assess well-being of newborns at arrival to a tertiary center after transportation over long distances [2]. The STOPS scoring system is an indigenous scoring system that was designed by Prof. Naveen Jain et al. [3,4]. However, there are few studies supporting the use of the STOPS. Hence, the present study was undertaken to STOPS as a prognostic indicator for outcome of new born babies admitted in NICU’s of Ujjain city.
Aim and Objectives
To assess the usefulness of the indigenously developed simple cheap and easy to perform physiological scoring system “STOPS”.
To estimate the prognostic accuracy of outcome of babies admitted in NICU of Ujjain city.
Material and Methods
Study design: Prospective analytic study.
Study setting: NICU’s of Ujjain city.
Study participants: All admitted babies in neonatal intensive care unit of Ujjain city in RD Gardimedical college, UCTH hospital and CharakBhawanhospital Ujjain, MP were part of the study. The following inclusion and exclusion criteria were used in recruiting the participants.
Inclusion criteria:
- Babies >28 weeks of gestation
- Babies >1000 grams of birth weight
- Babies without any major surgical problems
- Babies without any major congenital anomalies
- Babies less than 29 days of age
Exclusion criteria
Babies <28 weeks of gestation, babies <1000 grams of birth weight, babies with major surgical problems, babies with major congenital anomalies, babies admitted in PNC ward
Sample size: To calculate the sample size based on the estimating sensitivity and specificity with 95% confidence level. The required sample size was 183.
Tools: STOPS scoring is done for all babies admitted in NICU at the time of admission and these babies are followed up to look for their outcome death/discharge (length of stay). STOPS scoring are performed as soon as the baby is received in the NICU.
| Stops | Score 0 | Score 1 | Score 2 |
|---|---|---|---|
| Sensorium | Alert and active | Irritability/poor response To touch/reduced spontaneous Movements | Floppy/comatose Seizures on admission |
| Temperature | Euthermic (36.5c–37c) | Cold stress (36c-36.4c)Fever (37.1c-38c) | Hypothermia (<36c)/ fever(>38c) |
| Oxygenation | Norespiratory distress/no oxygen requirement | Tachypnea(RR 60-80/mt)/mild grunting/minimal chest retractions/need forFiO2<60% | Tachypnea (RR>80/mt)/grunt/marked chest retractions/need for FiO2>60%/CPAP/ventilator support |
| Perfusion | HR 100-160/mt CRT<3secs | Tachycardia (HR>160/mt)/ CRT>3 sec | Cold and clammy extremities/CRT>5 sec/oliguria/bradycardia |
| Sugar | CBG 45-180 mg/dl | <45mg/dl corrected by dextrose bolus/>180mg/dl | <45 mg/dl requiring glucose infusions>8mg/kg/min |
Table 1.Stops scoring.
Ethical considerations: The present study protocol was approved by the institutional human ethical committee of RD Gardi Medical College.
Statistical analysis: Data was analyzed using SPSS 21.0 version. McNemarchi square test was used to assess significance.
Results
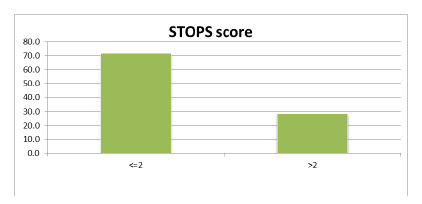
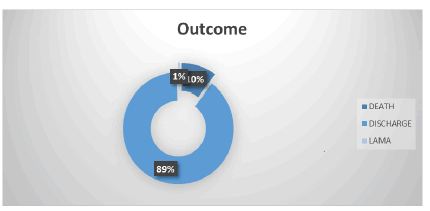
The number of babies admitted in our new born care unit was 184. The age distribution was explained in Figure 1. Most of the study participants were ≤ 1 day of age (74.5%). Table 1 presents the birth weight Category. Figure 2 presents the STOPS score distribution. STOPS Score <=2 was 132(71.7%). STOPS Score >2 was 52 (28.3%). Figure 3 presents the distribution of outcome. Out of 184, 164 babies got discharged, 19 babies died and 1 baby was discharged against the medical advice. Table 2 presents the association between birth weight and mortality. Out of 82 babies who had a normal birth weight, on 2 (2.4%) had mortality. Out of 65 babies who were LBW, 9 (13.8%) had mortality and out of the 37 VLBW babies, 8(21.6%) had mortality.
This difference in proportion was statistically significant at 95% CI (p=0.003). Table 3 presents the association between gestational age and length of stay. Out of 61 babies who were in the gestational age group of ≥37 weeks, 36 (59%) had <7 day of hospital stay, 15 (24.6%) had 8-14 day of hospital stay and 10(16.4%) had >14 days hospital stay. Out of 104 babies who were in the gestational age group of <37 weeks, 34(32.7%) had <7 day of hospital stay, 26(25%) had 8-14 day of hospital stay and 44(42.3%) had >14 days hospital stay. This difference in proportion of Length of stay among the two gestational age group was statistically significant at 95% CI (p=0.001).
Table 4 presents the association between Mortality and Gestational age. Out of 64 babies who had a gestational age of ≥ 37 weeks, 61(95.3%) had no mortality. Whereas 104 (86.7%) of the babies had mortality out of the 120 who had gestational age of <37 weeks. This difference in proportion was statistically significant at 95% CI (p=0.04). Table 5 presents the association between mortality and STOPS score. Out of 184 study participants, 52 had a STOP score of >2 and 132 had ≤ 2 STOP score. Among those who had a STOP score of >2, 32.7% had mortality as against 1.5% who had a STOP score of ≤ 2. This difference in proportion was statistically significant at 95% CI (p=0.000). Table 6 presents the prediction of mortality on the basis of STOPS among all cases.
| Birthweightgategory | Frequency | % |
|---|---|---|
| Normal | 82 | 44.6 |
| LBW | 65 | 35.3 |
| VLBW | 37 | 20.1 |
| Total | 184 | 100 |
Table 2.Birth weight category.
| Birthweightcategory | Mortality | Total | |
|---|---|---|---|
| No | Yes | ||
| NORMAL | 80 | 2 | 82 |
| 97.60% | 2.40% | 100.00% | |
| LBW | 56 | 9 | 65 |
| 86.20% | 13.80% | 100.00% | |
| VLBW | 29 | 8 | 37 |
| 78.40% | 21.60% | 100.00% | |
| TOTAL | 165 | 19 | |
| 89.70% | 10.30% | 100.00% | |
| Chi-square=11.47,p=0.003 | |||
Table 3.Association between birth weight and mortality.
| Gestational age(weeks) | Length of stay | Total | ||
|---|---|---|---|---|
| <=7days | 8-14days | >14days | ||
| >=37weeks | 36 | 15 | 10 | 61 |
| 59.0% | 24.6% | 16.4% | 100.0% | |
| <=2weeks | 34 | 26 | 44 | 104 |
| 32.7% | 25.0% | 42.3% | 100.0% | |
| Total | 70 | 41 | 54 | 165 |
| 42.4% | 24.8% | 32.7% | 100.0% | |
| Chi-square=14.17,p=0.001 | ||||
Table 4.Association between gestational age and length of stay.
| Gestational | Mortality | Total | |
|---|---|---|---|
| Age(weeks) | No | Yes | |
| >=37weeks | 61 | 3 | 64 |
| 95.30% | 4.70% | 100.00% | |
| <37weeks | 104 | 16 | 120 |
| 86.70% | 13.30% | 100.00% | |
| Total | 165 | 19 | 184 |
| 89.70% | 10.30% | 100.00% | |
| Chi-square=3.87,p=0.04 | |||
Table 5.Association between mortality and gestational age.
| Stopsscore | Mortality | Total | |
|---|---|---|---|
| No | Yes | ||
| >2 | 35 | 17 | 52 |
| 67.30% | 2.40% | 100.00% | |
| <=2 | 130 | 2 | 132 |
| 98.50% | 1.50% | 100.00% | |
| Total | 165 | 19 | 184 |
| 89.70% | 10.30% | 100.00% | |
| Chi-Square=39.15,p=0.000 | |||
Table 6.Association between mortality and STOPS score.
| Areaunderthecurve | ||||
|---|---|---|---|---|
| Testresultvariable(s):Total | ||||
| Area | Std.Errora | AsymptoticSig.b | Asymptotic95%Confidence | |
| LowerBound | UpperBound | |||
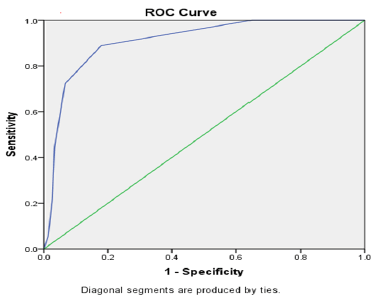
| 0.899 | 0.033 | 0 | 0.834 | 0.964 |
Table 7.Prediction of mortality on the basis of STOPS among all cases.
Discussion
The present study was undertaken to STOPS as a prognostic indicator for outcome of new born babies admitted in NICU’s of Ujjain city. The stops score Predicts the accuracy of mortality when the score cut off >2 among all the cases are 83%. In our present study, all the samples were taken during the time of admission in NICU. Our study included 184 out of which males were (64.1%) and females were (35.9%). In our study we found that 52 babies had a STOP score of >2 and 132 had ≤ 2 STOP score. 34.5% of the babies died who had a perfusion STOPS score of 1. In our study out of the 12 babies with sugar STOPS score 1, in which 7(58.3%) of the babies died. Also we found that out of the 37 VLBW babies, 8 (21.6%) had mortality.
The study results explained that gender does not have any significant correlation with the STOPS score. The present study included neonates included <1 day of age. The study results suggest that the age does not have any significant correction with STOPS score. The current study used the STOPS score cut off as 2 to predict the mortality of the neonates. Earlier studies conducted by Senthil Murgan observed that the STOPS score of 3 or more is a good predictor of the death of the babies admitted in NICU [3]. The current study was conducted at the level 3 NICU. The study results explain that individual parameters in STOPS also have great association for predicting the mortality and its association with the STOPS scores. This score can be used to predict mortality in low resource settings.
Conclusion
The present study results conclude that STOPS score is a useful tool in predicting the outcome of the babies admitted in NICU. Further, it was also observed that if STOPS score is extended giving importance to gestational age and birth weight for the prognostic accuracy.
Acknowledgement
The authors were thankful to the whole pediatrics department, RD Gardimedical college and our admitted patients of CR Gardi Hospital, Ujjain, without their support this study would not have been possible.
References
- Dorling JS, Field DJ, Manktelow B. Neonatal disease severity scoring systems.Arch Dis Child Fetal Neonatal Ed 2005;90(1):F11-6.
- Sankar MJ, Neogi SB, Sharma J, et al.State of newborn health in India. J Perinatol 2016;36(3):S3-8.
- http://repository-tnmgrmu.ac.in/6921/
- James J, Tewari VV, Jain N. Diagnostic accuracy of clinical tool 'stops' and serum procalcitonin for optimizing antibiotic therapy in neonates born at ≥ 28 weeks of gestation with neonatal sepsis. Mediterr J Hematol Infect Dis 2021;13(1):e2021019.
- Stomnaroska O, Danilovski D. The CRIB II (Clinical Risk Index for Babies II) score in predictionof neonatal mortality. Pril (MakedonAkadNaukUmet Odd Med Nauki) 2020; 41(3): 59-64.
- Ray S, Mondal R, Chatterjee K, et al. Extended Sick Neonate Score (ESNS) for clinical assessment and mortality prediction in sick newborns referred to tertiary care. Indian Pediatrics 2019; 56(2): 130-3.
- KP Mansoor, SR Ravikiran, VamanKulkarni, et al. "Modified Sick Neonatal Score (MSNS): A Novel Neonatal Disease Severity Scoring System for Resource-Limited Settings". Crit Care Res Pract 2019;
- Mathur NB, Arora D. Role of TOPS (a simplified assessment of neonatal acute physiology) in predicting mortality in transported neonates. ActaPaediatrica. 2007; 96(2): 172-5.


