Research Paper - Archives of General Internal Medicine (2017) Volume 1, Issue 4
Serum Osteocalcin Level in Type 2 Diabetes and its Relation to the Severity of Coronary Heart Disease, Insulin Resistance and High Sensitive-CRP.
Nagwa Amr Lacine1, Magy Abd El-Monem Shalash1, Eman Youssef Moursy1, Mohamed Ahmed Sadaka2, Gihane Ibrahim Khalil3 and Asmaa kamal Eldine Elshobaky1*
1Departments of Internal Medicine, Institute of Medical Research, Alexandria University, Egypt
2Departments of Cardiology and Angiology, Institute of Medical Research, Alexandria University, Egypt
3Department of Chemical Pathology, Faculty of Medicine, Institute of Medical Research, Alexandria University, Egypt
- *Corresponding Author:
- Asmaa kamal Eldine Elshobaky
Departments of Internal Medicine
Institute of Medical Research
Alexandria University, Egypt
E-mail: generalmedicine@alliedacademies.org
Accepted on October 09, 2017
Citation: Lacine NA, Shalash MAEM, Moursy EY, et al. Serum osteocalcin level in type 2 diabetes and its relation to the severity of coronary heart disease, insulin resistance and high sensitive-CRP. Arch Gen Intern Med. 2017;1(4):7-15
Abstract
Introduction: Among macrovascular diabetes complications, CAD has been associated with diabetes in numerous studies beginning with the Framingham study. More recent studies have shown that the risk of myocardial infarction (MI) in people with diabetes is equivalent to the risk in non-diabetic patients with a history of previous MI. Osteocalcin is the most abundant noncollagenic protein of the bone matrix. It has have been reported to be inversely associated with measures of insulin resistance Recent cross sectional and prospective studies suggest it to be an established surrogate of atherosclerosis and related cardiovascular risk. Aim of the work: The objective of the study was to investigate the link between serum osteocalcin and hs-CRP in the different degrees of severity of atherosclerotic CAD in patients with and without T2DM. Patients and method: This cross-sectional study was, conducted on 160 male subjects divided into four groups: Group A: 40 CAD patients with T2DM. Group B: 40 CAD patients without T2DM. Group C: 40 T2DM patients without CAD. Group D: 40 healthy control subjects matched for age, sex and socioeconomic status. They were subjected to: complete history taking, thorough clinical examination, Lab investigations (routine, serum insulin, osteocalcin, hs-CRP), ECG, Groups A and B subjected to Cardiac catheterization and coronary angiography. Angiographic analysis was done using the SYNTAX score (SS). Results: there was a statistically significant decrease in serum osteocalcin level in diabetic than non-diabetic subjects; also there was a statistically significant negative correlation between serum osteocalcin and fasting plasma glucose and HbA1c. While there was no difference in serum osteocalcin level between CAD and non CAD subjects and no difference between 3 syntax group of severity of CAD patients. Hs-CRP was statistically significantly higher in CAD than non CAD patients, smokers than non-smokers, syntax group 3 than group 2, and there was a statistically significant positive correlation with the duration of CAD. There was no difference in serum hs-CRP level between diabetic and non-diabetic subjects. Conclusion: Serum osteocalcin level may be considered as an indicator to the severity of glycemic control. While serum hs-CRP level is demonstrated to be an indicator to the degree of atherosclerosis and smoking as both represent a state of chronic inflammation.
Keywords
T2DM, ACVD, Osteocalcin, hs-CRP, Syntax score.
Introduction
Among macrovascular diabetes complications, CAD has been associated with diabetes in numerous studies beginning with the Framingham study [1]. More recent studies have shown that the risk of myocardial infarction (MI) in people with diabetes is equivalent to the risk in non-diabetic patients with a history of previous MI [2] These discoveries have lead to new recommendations by the ADA and AHA that diabetes be considered a CAD risk equivalent rather than a risk factor [3].
A new insight into the study of atherosclerotic plaques has evolved over the past decade and now the accepted role of inflammation in vulnerable plaque pathology has been widely accepted in the field of atherosclerosis. The continued release of cytokines and growth factors by activated endothelial cells and foam cells is responsible for atheromatous lesion growth as it influences smooth muscle activity, besides perpetuating inflammation and lipid accumulation [4]. Baseline hs-CRP concentrations have been shown to be one of the most powerful predictors of both long- and short-term CVD in men and women, [5] and they appear to add to the predictive value of lipid screening [6].
Osteocalcin or GLA protein (protein containing γ-carboxyglutamic acid) is the most abundant non-collagenic protein of the bone matrix [7]. In some animal studies, osteocalcin has been associated with pancreatic islet-cell proliferation and insulin expression, adiponectin gene expression in white adipose tissue, and hypoglycemia [8]. In humans, circulating osteocalcin levels have been reported to be inversely associated with measures of insulin resistance (fasting insulin and glucose levels and homeostasis model assessment of insulin resistance [HOMA-IR]) [9-11].
Cross sectional and prospective studies suggest independent associations between bone mineral density and vascular calcification, an established surrogate of atherosclerosis and related cardiovascular risk [12,13].
The objective of the study was to investigate the link between serum osteocalcin and high sensitive CRP (hs-CRP) in the different degrees of severity of atherosclerotic CAD in patients with and without T2DM.
Material and Methods
This cross-sectional study was, conducted on 160 male subjects divided into four groups:
Group A: 40 CAD patients with T2DM.
Group B: 40 CAD patients without T2DM.
Group C: 40 T2DM patients without CAD.
Group D: 40 Healthy control subjects matched for age, sex and socioeconomic status.
Patients of groups A & B were recruited from patients presenting to the Catheter Lab of Alexandria University Hospital. Patients of groups A and B had angiographically documented CAD. CAD was excluded in patients of group C by the presence of negative stress test and/or coronary angiography. Subjects of group C were recruited from those undergoing coronary angiography and/or stress test for a justified indication at the Cardiology Department in Alexandria University Hospital and were proven to be free of CAD. Control subjects were subjected to full history taking, clinical examination, ECG and to laboratory investigations as the other groups.
None of the subjects of the study had hepatic, renal, endocrinal or metabolic disease other than T2DM. Patients with history of acute coronary syndrome in the last 6-month precedent to the study, patients with history of heart failure, history of infection within the last two months precedent to the study, history of anemia of hemoglobin less than 10 g/dl, history of blood transfusion in the last two months precedent to the study were excluded.
Patients receiving the following medications were excluded: antibiotics in the last two months precedent to the study, anti-Hyperlipidemia agents other than Statins and fibrates, antioxidants as Vitamin C and vitamin E in the last two weeks precedent to the study, digoxin, diuretics, calcium, and vitamin D. All patients were on low dose Aspirin 75-200 mg/dl as an anti-platelet agent, statins and/or fibrates.
All selected individuals were subjected to the following:
Full history taking, Complete physical examination including;
Anthropometric measures, pulse and blood pressure assessment. Laboratory investigations after 12-14 hours fast including: Fasting serum glucose, Serum insulin level, Glycated hemoglobin (HbA1C), Lipid profile including; Total serum cholesterol level, LDL-C, HDL-C, serum triglycerides, Complete urine analysis, hs-CRP leve, Serum osteocalcin level and Resting ECG.
Sampling was done in the morning (8.00 - 10.00 am) of the same day of the Cardiac Catheterization and coronary angiography after an overnight fast of 12 hours. All subjects were asked to refrain from smoking and strenuous exercise during the fasting period. The collected venous samples were divided into 2 parts, one part in plain vacutainer tube left to clot at 37◦C: sera were separated by centrifugation and divided into 2 parts, one used for immediate assay of fasting glucose, insulin level, lipid profile and ALT. The other was kept at -70◦C for assay of osteocalcin and Hs CRP. The second part of blood sample was collected on dipotassium ethelene diamine tetraacetic acid (EDTA) tube for complete blood count and glycated haemoglobin (HbA1c).
Homeostasis model assessment 2 (HOMA2)
Calculator was used to estimate insulin resistance (%S) (HOMA-IR) according to the updated computer based HOMA2 mode in subjects with normal or impaired glucose tolerance [14].
Serum osteocalcin level using the osteocalcin ELISA assays kit
The kits were got from DIAsource hOST-EASIA company which used a solid phase Enzyme Amplified Sensitivity, Immunoassay performed on breakable microtiterplates [15]. The assay used monoclonal antibodies (MAbs) directed against distinct epitopes of human osteocalcin. The amount of substrate turnover was determined colourimetrically by measuring the absorbance, which is proportional to the osteocalcin concentration. Normal values where expected between 5 to 25 ng/ml.
Hs CRP
CRP was determined by a high sensitivity latex assay (lower limit of detection ≤ 0.79 mg/L) on the Dade–Behring (BN Prospec) analyzer using standards and controls supplied by Siemens Company (Health Care Diagnostic) [16].
Cardiac catheterization and coronary angiography, angiographic analysis was done using the SYNTAX score (SS)
All CAD patients underwent coronary angiography with the Judkins technique. Coronary angiography was performed with standard femoral approach with a 6-F diagnostic catheter. The SYNTAX angiographic grading tool was published in 2005 [17] it is the sum of the points assigned to each individual lesion identified in the coronary tree with >50% diameter narrowing in vessels >1.5 mm diameter. On-Line calculator was used to calculate the SS score. According to SS value, subjects in groups A and B were classified as [18,19] low: 0-22, Moderate: 23-32, high: ≥ 33.
High syntax scores; in addition to age, gender, smoking, diabetes and acute coronary syndromes, are one of the highest predictors of cardiac mortality and major adverse cardiac events in patients undergoing multivessel and, specifically, unprotected left main percutaneous coronary intervention (PCI) [18,19].
Statistical analysis
Clinical data are expressed as mean ± standard deviation; test the significance of the difference between two groups, Student “t” test was used. ANOVA test was used to test the significance of the difference between more than two groups. To compare between every two groups, LSD (Least significant difference) test was done, it is used when the F-test is significant. Chi square test was used to compare between qualitative parameters. Correlation coefficient (r) was used to study the relation between two quantitative parameters. Statistical significance was accepted if the null hypothesis could be rejected at p ≤ 0.05. All analyses were done using Windows-based SPSS statistical software (version 15.0).
Results
Characteristics of study population: Anthropometric, biochemical and other clinical profiles of study subjects are listed in Table 1:
| Minimum | Maximum | Mean | SD | |
|---|---|---|---|---|
| Age (years) | 39.0 | 77.0 | 55.35 | 7.65 |
| Weight (Kg) | 60.0 | 110.0 | 82.59 | 10.29 |
| Height (cm) | 155 | 187 | 171.62 | 6.64 |
| Body mass index(BMI) (Kg/m2) | 20.23 | 37.11 | 28.08 | 3.50 |
| Waist circumference (cm) | 67.0 | 132.0 | 100.07 | 8.18 |
| Hip circumference (cm) | 70.0 | 130.0 | 103.81 | 7.73 |
| Waist to hip Ratio | 0.80 | 1.10 | 0.96 | 0.029 |
| Systolic BP (mmHg) | 100 | 150 | 127.0 | 11.54 |
| Diastolic BP (mmHg) | 60 | 110 | 81.19 | 9.74 |
| Fasting plasma glucose (mg/dl) | 65.0 | 380.0 | 120.94 | 62.49 |
| Total Cholesterol (mg/dl) | 66.0 | 266.0 | 171.34 | 39.20 |
| Serum Triglycerides (mg/dl) | 38.0 | 406.0 | 145.17 | 67.61 |
| HDL-C (mg/dl) | 8.0 | 88.0 | 39.18 | 12.99 |
| LDL-C (mg/dl) | 26.50 | 192.20 | 103.13 | 33.56 |
| Hs-CRP (mg/L) | 0.40 | 281.0 | 16.92 | 40.74 |
| Fasting serum insulin (µIU/ml) | 1.03 | 81.90 | 12.35 | 10.01 |
| HbA1c (%) | 4.10 | 13.0 | 7.072 | 1.86 |
| Homeostasis model assessment of insulin resistance (HOMA2-IR) | 0.10 | 9.20 | 1.71 | 1.38 |
| Osteocalcin (ng/ml) | 5.25 | 79.45 | 23.54 | 14.72 |
| Duration of DM (Group A & C) years | 1 | 30 | 10.15 | 7.33 |
| Duration of CAD (Group A & B) years | 1 | 20 | 5.2 | 4.71 |
Table 1. Descriptive statistical data of the studied patients (n=160 patients).
The group A with CAD and T2DM showed a statistically significant increase in the mean serum hs-CRP compared to the control group D as shown in Table 2 The mean serum osteocalcin levels were statistically significantly lower in the diabetic groups whether with or without CAD (groups A and C) compared to the control group D as shown in Table 3.
| Group A | Group B | Group C | Group D | F | P | ||
|---|---|---|---|---|---|---|---|
| (CAD & DM) | (CAD) | (DM) | (Control) | ||||
| hsCRP (mg/L) | Mean | 27.72 | 22.77 | 11.63 | 5.58 | 2.542 | 0.058 |
| ± SD | ± 57.54 | ± 54.55 | ± 10.92 | ± 6.66 | |||
| LSD | A vs B | A vs C | A vs D | B vs C | B vs D | C vs D | |
| 0.58 | 0.08 | 0.015* | 0.22 | 0.057 | 0.5 | ||
Table 2. Comparison between the four groups as regards the serum level of hs-CRP.
| Group A | Group B | Group C | Group D | F | P | ||
|---|---|---|---|---|---|---|---|
| (CAD & DM) | (CAD) | (DM) | (Control) | ||||
| Osteocalcin (ng/ml) | Mean | 19.7 | 24.26 | 19.19 | 31.01 | 6.062* | 0.001* |
| ± SD | ± 15.18 | ± 18.09 | ± 9.32 | ± 12.13 | |||
| LSD | A vs B | A vs C | A vs D | B vs C | B vs D | C vs D | |
| 0.74 | 0.998 | 0.002* | 0.374 | 0.144 | 0.001* | ||
Table 3. Comparison between the four groups as regards serum osteocalcin level (ng/ml).
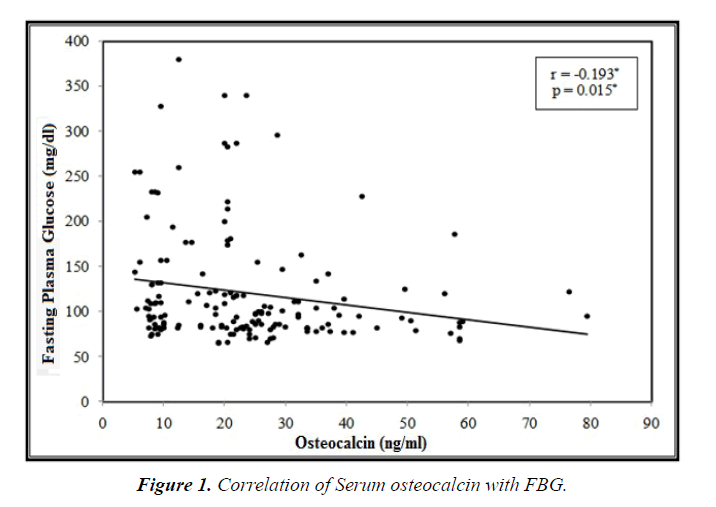
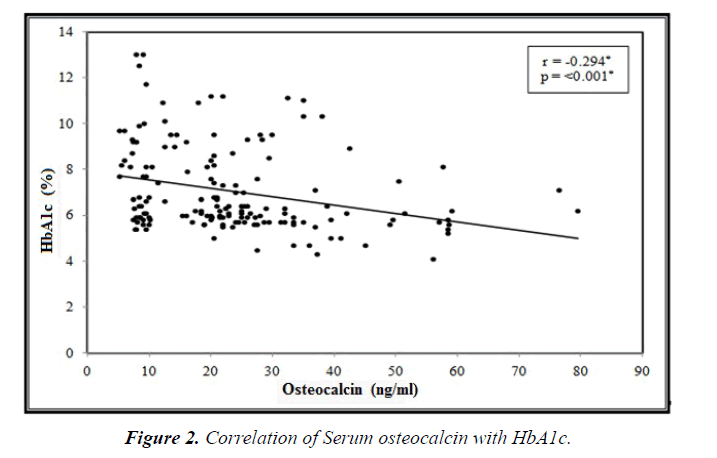
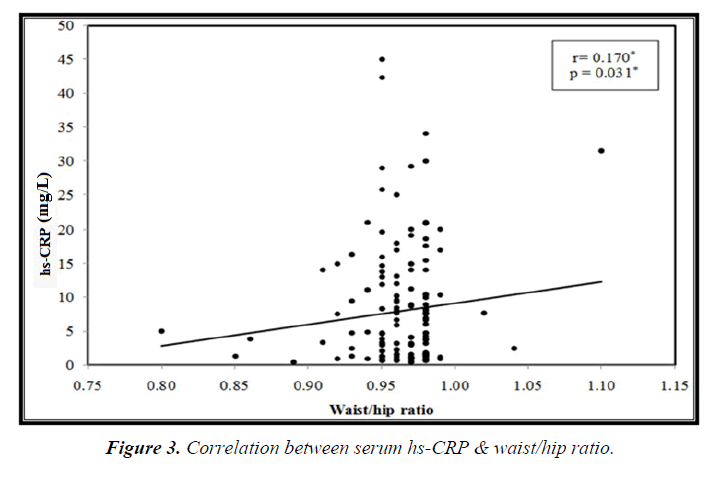
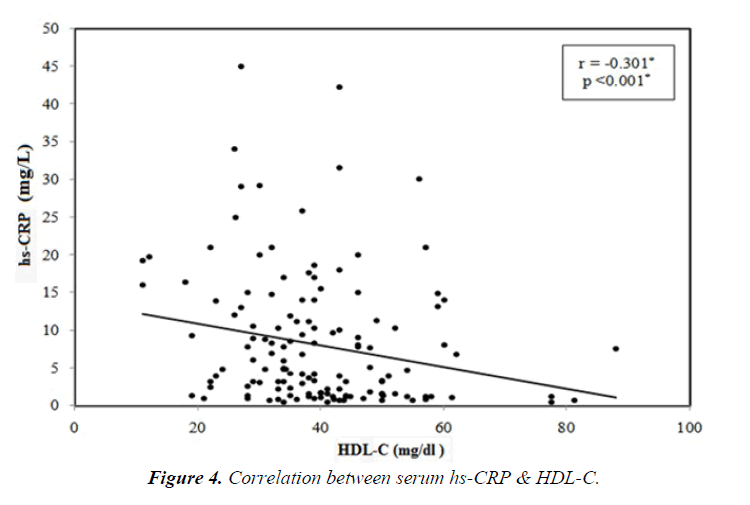
Among the studied groups there was statistically significant negative correlation between serum osteocalcin and each of the FPG (p=0.015) and HbA1C (p=0.001), (Figures 1 and 2). While, there was a significant positive correlation between serum hs-CRP and waist/hip ratio (p=0.031). And a statistically significant negative correlation between serum hs-CRP and HDL-C, (p<0.001) (Figures 3 and 4).
Among the studied groups, there was a statistical significant difference in serum osteocalcin level between the diabetics (groups A&C) and the non-diabetics (groups B&D) (p<0.001), as shown in Table 4. Moreover, there was no statistically significant difference in serum osteocalcin level in subjects with CAD (groups A&B) compared to those without CAD (groups C&D) as shown in Table 5.
| Diabetes | Osteocalcin | p-value |
|---|---|---|
| (mean ± S.D.) | ||
| (ng/ml) | ||
| Non-diabetic (n=80) (Groups B & D) | 27.63 ± 15.68 | <0.001* |
| Diabetic (n=80) (Groups A & C) | 19.44 ± 12.52 |
Table 4. Comparison of serum osteocalcin level between subjects with & without diabetes.
| Coronary artery disease | Osteocalcin | p-value |
|---|---|---|
| (mean ± S.D.) | ||
| (ng/ml) | ||
| No (n=80) (Group C & D) | 25.10 ± 12.28 | 0.182 |
| Yes (n=80) (Groups A & B) | 21.98 ± 16.75 |
Table 5. Comparison of serum osteocalcin level between subjects with & without CAD.
Among the studied groups there was no statistically significant difference in serum hs-CRP level between diabetic (groups A&C) and non-diabetic (groups B&D) subjects (p=0.395) as shown in Table 6. While, there was a statistically significant difference in serum hs-CRP level between subjects with CAD (groups A&B) and subjects without CAD (groups C&D) (p=0.009), as shown in Table 7.
| Diabetes | Hs-CRP (mean ± S.D. (mg/L ) | p-value |
|---|---|---|
| Non- diabetic (n=80) (Group B & D) | 14.17 ± 39.57 | 0.395 |
| Diabetic (n=80) (Group A & C) | 19.68 ± 41.94 |
Table 6. Comparison of hs-CRP level between subjects with & without diabetes.
| Coronary artery disease | Hs-CRP (mean ± S.D.) | p-value |
|---|---|---|
| (mg/L) | ||
| No (n=80) (Group C & D) | 8.60 ± 9.49 | 0.009* |
| Yes (n=80) (Groups A & B) | 25.24 ± 55.76 |
Table 7. Comparison of serum hs-CRP level between subjects with & without CAD.
The correlation between serum osteocalcin and the various parameters among the studied CAD patients (Groups A&B) showed that there were no statistically significant correlations with age, weight, BMI, waist circumference, hip circumference, Waist/hip ratios, systolic blood pressure, diastolic blood pressure, FPG, HbA1c, serum insulin, HOMA-IR, lipid parameters and hs-CRP level in the studied groups.
The correlation between serum hs-CRP and the various parameters among the studied CAD patients (Groups A&B) showed that there was a statistically significant positive correlation with the duration of CAD (p=0.016) and a negative highly statistically significant correlation with HDL-C level (p<0.001). On the other hand, there was no statistically significant correlation between hs-CRP levels and all other parameters.
Among the four groups of the study, there was no statistically significant difference in serum osteocalcin level between subjects with smoking history (n=95) (22.66 ± 14.43 ng/ml) and subjects who never smoked. (n=65) (24.82 ± 15.16 ng/ml) and there was no statistically significant difference in serum osteocalcin level between subjects with albuminuria (urinary Albumin/Creatinine ratio >30 mg alb/1 mg Cr) (n=37) (21.68 ± 13.99 ng/ml) and subjects without albuminuria. (n=123) (24.1 ± 13.88 ng/ml).
There was a statistically significant increase in serum hs-CRP level among subjects with smoking history(n=95) (23.53 ± 51.43 mg/dl) compared to subjects who never smoked(n=65) (7.27 ± 8.88 mg/dl) (p=0.013) also, the serum hs-CRP level was statistically significantly higher in subjects with albuminuria (urinary Albumin/Creatinine ratio >30 mg alb/1 mg Cr) (n=37) (34.50 ± 56.69 mg/dl) compared to subjects without albuminuria. (n=123) (11.64 ± 33.05 mg/dl) (p=0.003).
The CAD studied subjects (80 patients), were further, divided according to their SYNTAX score into three groups.
• Group 1 (SYNTAX score 0-22): included 22 patients (27.5%).
• Group 2 (SYNTAX score 23-32): included 24 patients (30%).
• Group 3 (SYNTAX score ≥ 33): included 34 patients (42.5%)
The comparison between various parameters according to SYNTAX score (groups 1, 2&3) among the CAD patients diabetic and non-diabetic (groups A and B) showed that there was a statistically significant increase in the waist/hip ratio in syntax group 3 compared to syntax group 2. (p=0.009) Table 8.
| Group 1 N=22 SS=0-22 |
Group 2 N=24 SS=23-32 |
Group 3 N=34 SS ≥ 33 |
F | P | ||
|---|---|---|---|---|---|---|
| Age (YEARS) |
56.64 ± 8.17 |
58.17 ± 8.07 |
56.12 ± 10.10 |
0.374 | 0.68 | 1 vs 2 0.567 1 vs 3 0.834 2 vs 3 0.397 |
| Body mass index (BMI) (kg/m2) |
28.92 ± 3.43 |
28.1 ± 3.38 |
28.6 ± 3.40 |
0.448 | 0.641 | 1 vs 2 0.410 1 vs 3 0.940 2 vs 3 0.410 |
| Waist circumference (cm) |
100.63 ± 9.45 |
99.12 ± 6.36 |
103.61 ± 11.62 |
0.611 | 0.206 | 1 vs 2 0.60 1 vs 3 0.266 2 vs 3 0.087 |
| Hip Circumference (cm) | 104.27 ± 7.15 | 104.61 ± 8.5 | 106.23 ± 10.49 | 0.422 | 0.657 | 1 vs 2 0.957 1 vs 3 0.433 2 vs 3 0.455 |
| Waist/hip ratio | 0.961 ± 0.04 |
0.95 ± 0.027 |
0.973 ± 0.03 |
3.543 | 0.034* | 1 vs 2 0.186 1 vs 3 0.252 2 vs 3 0.009* |
| Systolic blood pressure (SBP) (mm hg) |
129.09 ± 12.69 |
127.29 ± 9.21 |
126.91 ± 9.54 |
0.311 | 0.734 | 1 vs 2 0.560 1 vs 3 0.450 2 vs 3 0.891 |
| Diastolic blood pressure ( DBP) (mm hg) |
83.63 ± 10.02 |
82.00 ± 9.89 |
82.05 ± 9.78 |
0.173 | 0.841 | 1 vs 2 0.700 1 vs 3 0.561 2 vs 3 0.867 |
| Total Cholesterol (mg/dl) |
172.55 ± 41.744 |
178.42 ± 35.44 |
196.82 ± 33.00 |
0.909 | 0.407 | 1 vs 2 0.700 1 vs 3 0.200 2 vs 3 0.380 |
| LDL-C (md/dl) |
114.3 ± 41.95 |
108.76 ± 30.12 |
103.95 ± 29.31 |
0.644 | 0.528 | 1 vs 2 0.576 1 vs 3 0.262 2 vs 3 0.591 |
| HDL-C (mg/dl) |
36.5 ± 11.27 |
39.93 ± 12.64 |
36.23 ± 9.53 |
0.898 | 0.4.1 | 1 vs 2 0.294 1 vs 3 0.930 2 vs 3 0.212 |
| Serum triglycerides (mg/dl) |
158.72 ± 87.32 |
148.63 ± 69.75 |
148.21 ± 71.55 |
0.149 | 0.862 | 1 vs 2 0.652 1 vs 3 0.613 2 vs 3 0.983 |
| Fasting plasma glucose (mg/dl) |
127.05 ± 57.39 |
112.08 ± 50.06 |
134.85 ± 76.96 |
0.876 | 0.42 | 1 vs 2 0.436 1 vs 3 0.660 2 vs 3 0.191 |
| HbA1c (%) |
6.823 ± 1.69 |
6.808 ± 1.36 |
7.226 ± 1.69 |
0.586 | 0.559 | 1 vs 2 0.977 1 vs 3 0.383 2 vs 3 0.354 |
| Insulin (uIU/ml) |
15.38 ± 9.05 |
12.13 ± 8.21 |
12.64 ± 7.98 |
1.02 | 0.365 | 1 vs 2 0.191 1 vs 3 0.235 2 vs 3 0.818 |
| HOMA-IR | 2.12 ± 1.27 |
1.62 ± 1.07 |
1.88 ± 1.450 |
0.846 | 0.433 | 1 vs 2 0.198 1 vs 3 0.509 2 vs 3 0.452 |
| Duration of CAD (years) |
5.271 ± 5.138 |
5.042 ± 4.713 |
5.265 ± 4.568 |
0.19 | 0.981 | 1 vs 2 0.870 1 vs 3 0.995 2 vs 3 0.861 |
Table 8. Comparison of the various studied parameters in the three groups classified according to SYNTAX score (SS) among the CAD patients (diabetic and non-diabetic).
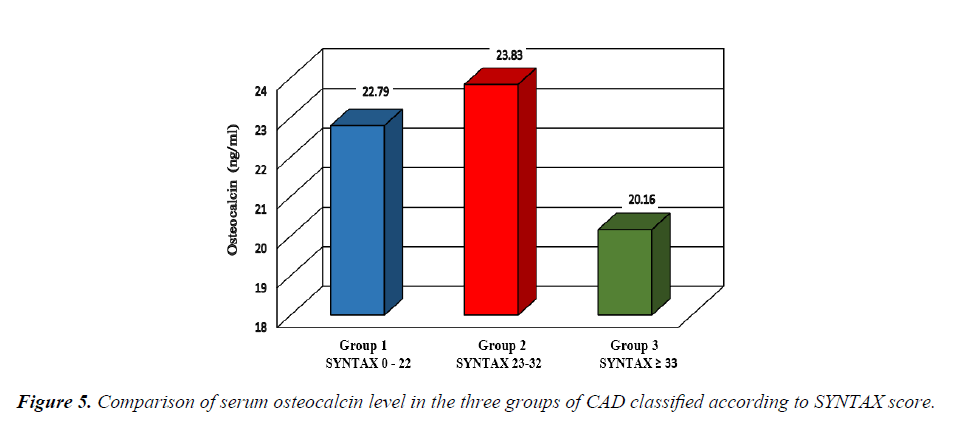
The comparison of serum osteocalcin level among the three groups of CAD subjects classified according to the SYNTAX score showed that there was no statistically significant difference in serum osteocalcin level between the three groups of SYNTAX score as shown in Figure 5.
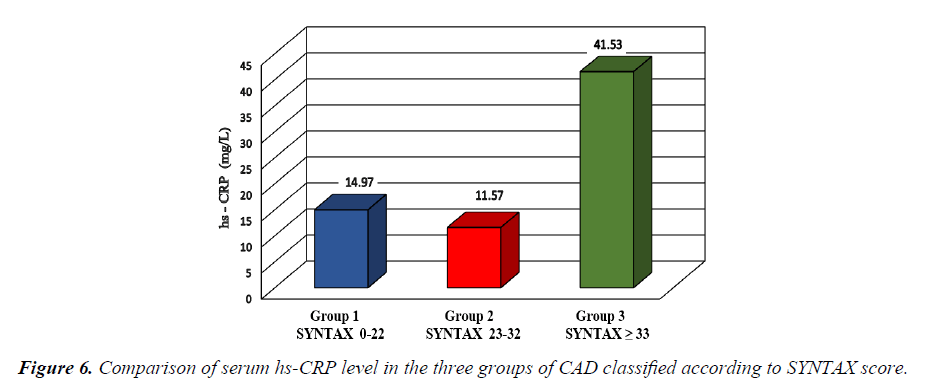
The comparison of serum hs-CRP level among the three groups of CAD subjects classified according to the SYNTAX score showed that the serum hs-CRP level was statistically significantly higher in group 3 compared to group 2 (p=0.043) as shown in Figure 6.
To eliminate effect of diabetes on coronary atherosclerosis, we compared serum osteocalcin level with the three group of CAD severity in subgroups of CAD patients diabetic (group A) and non-diabetic (group B) separately, there was no statistically significant difference in osteocalcin levels between the three groups of syntax score (group A Table 9) (group B Table 10), and also there was no statistically significant difference in hs- CRP levels between the three groups of syntax score (group A Table 11) (group B Table 12).
| Group 1 (n=8) | Group 2 (n=13) | Group 3 (n=19) | F | P | ||
|---|---|---|---|---|---|---|
| SYNTAX 0-22 | SYNTAX 23-32 | SYNTAX ≥ 33 | ||||
| Osteocalcin (ng/ml) | Mean | 20.11 | 24.76 | 16.07 | 1.288 | 0.288 |
| ± SD | ± 17.41 | ± 20.70 | ± 7.95 | |||
| LSD | 1 vs 2 | 1 vs 3 | 2 vs 3 | |||
| 0.469 | 0.529 | 0.118 | ||||
Table 9. The comparison of osteocalcin levels in CAD diabetic patients (group A) among the syntax score groups (groups 1, 2 and 3).
| Group 1 (n=14) | Group 2 (n=11) | Group 3 (n=15) | F | P | |
|---|---|---|---|---|---|
| SYNTAX 0-22 | SYNTAX 23-32 | SYNTAX ≥ 33 | |||
| Osteocalcin (ng/ml) | 24.32 | 22.72 | 25.34 | 0.063 | 0.939 |
| ± 14.92 | ± 16.52 | ± 22.52 | |||
| LSD | 1 vs 2 | 1 vs 3 | 2 vs 3 | ||
| 0.832 | 0.883 | 0.724 |
Table 10. The comparison of osteocalcin levels in CAD non-diabetic patients (group B) among the three syntax score groups (groups 1, 2 and 3).
| Group 1 (n=8) | Group 2 (n=13) | Group 3 (n=19) | F | P | ||
|---|---|---|---|---|---|---|
| SYNTAX 0-22 | SYNTAX 23-32 | SYNTAX ≥ 33 | ||||
| hs-CRP (mg/L) | Mean | 13.2 | 16.26 | 41.67 | 1.075 | 0.352 |
| ± SD | ± 13.00 | ± 32.06 | ± 77.64 | |||
| LSD | 1 vs 2 | 1 vs 3 | 2 vs 3 | |||
| 0.906 | 0.247 | 0.227 | ||||
Table 11. The comparison of hs-CRP levels in CAD diabetic patients (group A) among the syntax score groups (groups 1, 2 and 3).
| Group 1 (n=14) | Group 2 (n=11) | Group 3 (n=15) | F | P | ||
|---|---|---|---|---|---|---|
| SYNTAX 0-22 | SYNTAX 23-32 | SYNTAX ≥ 33 | ||||
| hs-CRP (mg/L) | Mean | 15.99 | 6.03 | 41.36 | 1.538 | 0.228 |
| ± SD | ± 50.12 | ± 7.25 | ± 72.68 | |||
| LSD | 1 vs 2 | 1 vs 3 | 2 vs 3 | |||
| 0.649 | 0.212 | 0.107 | ||||
Table 12. The comparison of hs-CRP levels in CAD non-diabetic patients (group B) among the three syntax score groups (groups 1, 2 and 3).
Discussion
Circulating osteocalcin concentrations vary according to age and sex [20-22] there may be other factors influencing serum osteocalcin concentrations such as the use of oral contraceptives [23,24] hormone replacement therapy [25] and BMI [26]. Furthermore, serum osteocalcin concentrations were reported to be increased for short term by calcium intake [27]. In order to avoid these discrepancies in serum osteocalcin levels, the present study was conducted only in men in the four groups of the study with mean age of 55 ± 7 years with exclusion of any hormonal or other endocrinal treatment that could affect the osteocalcin level.
In the present study the osteocalcin level was lower in diabetic patients and there were statistically significant negative correlations between serum osteocalcin and each of the fasting plasma glucose and the HbA1c. The historical relation of decreased osteocalcin in diabetic patients started in 1988 when P. Pietschmann et al. concluded their findings of low osteocalcin levels in T2DM patients and T1DM patients thus indicated that bone formation is decreased in these patients [28]. Many recent studies proved relation between osteocalcin and glycemic parameters as forexample Clifford J et al. [29], Ernesti M et al. [30] and Mi Zhou et al. [31]. These results indicate the existence of a bone-pancreas endocrine loop through which insulin signaling in the osteoblast ensures osteoblast differentiation and stimulates osteocalcin production, which in turn regulates insulin sensitivity and pancreatic insulin secretion [29].
The present study could not prove significant correlation between osteocalcin and fasting insulin and HOMA-IR, which correspond to the absence of significant correlation between osteocalcin and anthropometric measures as WC, WHR and BMI which are related to insulin resistance. Our results was in accordance with many Chinese studies as for example Qingming W et al., who studied the correlations between serum osteocalcin and glucose metabolism in patients with T2DM, they suggested that decreased serum osteocalcin was related with long-term hyperglycemia but had little impact on insulin resistance [32].
It has been proved that osteocalcin prevents calcification by inhibiting bone morphogenetic protein (BMP) signaling, which enhances calcification [33]. Idelevich et al. showed that osteocalcin is potentially a novel regulator of osteochondrogenic differentiation of pathologically mineralized vascular smooth muscle cells (VSMCs) [34]. The present study could not prove statistically significant difference in serum osteocalcin levels between CAD and non CAD patients, syntax scores groups of severity of CAD, smokers and non-smokers, and not correlated to hs- CRP. These results may be related to the potential influence of pharmacological treatment and lifestyle variables (i.e., nutritional status, and physical activity).
Despite that the entire CAD patients of the present study whether diabetic or non-diabetic were receiving low dose acetylsalicylic acid (aspirin), statin and/or fibrate, known to have anti-inflammatory pleotropic effects, there was still persistent significant increase in serum hs-CRP level in the CAD patients than non CAD patients. Many studies previously proposed to correlate CRP with the extent of atherosclerosis [35]. Other studies have shown that numerous small non stenotic atherosclerotic plaques are statistically more likely to lead to plaque rupture than the relatively few lesions of 70% stenosis [36]. In the present study, the serum hs-CRP level among the studied CAD patients (Group A&B) showed that there was a statistically significant positive correlation with the duration of CAD. Also, there was a statistically significant increase in serum hs-CRP level in CAD syntax group 3 (the highest severity of CAD) compared to syntax group 2(the moderate severity of CAD), these results confirms that an elevated CRP may represents a more diffuse process of coronary atherosclerosis with a higher total plaque burden.
In the present study, there was no statistically significant difference in serum hs-CRP level between the diabetic and the non-diabetic subjects. The lack of relationship between CRP concentration and glycemic control in the present study can be attributed to the level of metabolic control among diabetic patients, as one of the studies showed that the CRP concentration had a tendency to increase in parallel with HbA1c, but this relationship was only observed in patients with HbA1c above 9% and the mean HbA1c in the subjects of the present study did not reach this level.
Conclusion
Form the present study we can conclude that Serum osteocalcin level may be considered as an indicator to the severity of glycemic control and its implication in atherosclerotic cardiovascular disease needs to be reevaluated. While serum hs-CRP level is demonstrated to be an indicator to the degree of atherosclerosis and smoking as both represent a state of chronic inflammation.
References
- Kannel WB, McGee DL. Diabetes and cardiovascular disease: the Framingham study. JAMA 1999; 241:2035-8.
- Haffner SM, Lehto S, Ronnemaa T, et al. Mortality from coronary heart disease in subjects with type 2 diabetes and in nondiabetic subjects with and without prior myocardial infarction. N Engl J. 1998;339: 229-34.
- Buse JB, Ginsberg HN, Bakris GL, et al. Primary prevention of cardiovascular diseases in people with diabetes mellitus: a scientific statement from the American Heart Association and the American Diabetes Association. Diabetes Care. 2007;30: 162-72.
- Szmitko PE, Wang CH, Weisel RD, et al. New markers of inflammation and endothelial cell activation (part I). Circulation. 2003;108:1917-23.
- Ridker PM, Hennekens CH, Buring JE, et al. C-reactive protein and other markers of inflammation in the prediction of cardiovascular disease in women. N Engl J Med. 2000;342:836-43.
- Ridker PM, Glynn RJ, Hennekens CH. C-reactive protein adds to the predictive value of total and HDL cholesterol in determining risk of first myocardial infarction. Circulation. 1998;97:2007-11.
- Urena P, De Vernejoul MC. Circulating biochemical markers of bone remodeling in uremic patients. Kidney Int. 1999;55:2141-56.
- Kawai M, Devlin MJ, Rosen CJ. Fat targets for skeletal health. Nat Rev. 2009;5:365-372.
- Pittas AG, Harris SS, Eliades M, et al. Association between serum osteocalcin and markers of metabolic phenotype. J Clin Endocrinol Metab. 2009;94:827-32.
- Kindblom JM, Ohlsson C, Ljunggren O, et al. Plasma osteocalcin is inversely related to fat mass and plasma glucose in elderly Swedish men. J Bone Miner Res. 2009;24:785-91.
- Kanazawa I, Yamaguchi T, Yamamoto M, et al. Serum osteocalcin level is associated with glucose metabolism and atherosclerosis parameters in type 2 diabetes mellitus. J Clin Endocrinol Metab. 2009;94:45-9.
- Tanko L, Bagger Y, Christiansen C. Low bone mineral density in the hip as a marker of advanced atherosclerosis in elderly women Calcif Tissue Int. 2003;73:15-20.
- Pennisi P, Signorelli S, Riccobene S, et al. Low bone density and abnormal bone turnover in patients with atherosclerosis of peripheral vessels Osteoporos Int. 2004;15(2004):389-95.
- Lee AJ, Hodges S, Eastell R. Measurement of osteocalcin. Ann Clin Biochem. 2000;37:432- 46.
- Burtis CA, Ashwood ER, Bruns DE. Teitz text book of clinical chemistry and molecular diagnosis Ed. ST.Louis. Elsevier Saunders company. 2006;pp: (868-75, 797-801, 903-801, 604-7, 543-5, 648-708).
- .Sianos G, Morel MA, Kappetein AP, et al. The SYNTAX score: an ngiographic tool grading the complexity of CAD. EuroInterv. 2005;1:219-27.
- Valgimigli M, Serruys PW, Tsuchida K, et al. Cyphering the complexity of coronary artery disease using the syntax score to predict clinical outcome in patients with three-vessel lumen obstruction undergoing percutaneous coronary intervention. Am J Cardiol. 2007;99(8):1072-81.
- Chakrabarti AK, Gibson CM. The Syntax Score:Usefulness, Limitations and Future directions. The Journal of invasive cardiology. 2011;23:12.
- .Szulc P, Kaufman JM, Delmas PD. Biochemical assessment of bone turnover and bone fragility in men. Osteoporos Int. 2007;18:1451-61.
- Midtby M, Magnus JH, Joakimsen RM. The Tromso Study: a population-based study on the variation in bone formation markers with age, gender, anthropometry and season in both men and women. Osteoporos Int. 2001;12:835-43.
- Ardawi MS, Maimani AA, Bahksh TA, et al. Reference intervals of biochemical bone turnover markers for Saudi Arabian women: a cross-sectional study. Bone. 2010;47: 804-14.
- Wei S, Winzenberg T, Laslett LL, et al. Oral contraceptive use and bone. Curr Osteoporos Rep. 2011;9:6-11.
- Garnero P, Sornay-Rendu E, Delmas PD. Decreased bone turnover in oral contraceptive users. Bone. 1995;16:499-503.
- Hannon R, Blumsohn A, Naylor K, et al. Response of biochemical markers of bone turnover to hormone replacement therapy: impact of biological variability. J Bone Miner Res. 1998;13:1124-33.
- Adami S, Bianchi G, Brandi ML, et al. Determinants of bone turnover markers in healthy premenopausal women. Calcif Tissue Int. 2008;82:341-7.
- Ginty F, Flynn A, Cashman KD. The effect of short-term calcium supplementation on biochemical markers of bone metabolism in healthy young adults. Br J Nutr. 1998;80: 437-43.
- Pietschmann P, Woloszczuk W, Panzer S, et al. Decreased serum osteocalcin levels in phenprocoumon-treated patients. J Clin Endocrinol Metab. 1988;66:1071-4.
- Clifford J Rosen, Katherine J Motyl, No Bones About It: Insulin Modulates Skeletal Remodeling Cell. 2010;142(2):198-200.
- Ernesti M, D’Onofrio L, Lauria A, et al. Osteocalcin levels are inversely associated with Hba1c and BMI in adult subjects with long-standing type 1 diabetes J. Endocrinol Invest. 2014;37:661.
- Mi Zhou, Xiaojing Ma, Huating Li, et al. Serum osteocalcin concentrations in relation to glucose and lipid metabolism in Chinese individuals. Eur J Endocrinology. 2009;161:723-729.
- Qingqing Wang, Beibei Zhang, Yulan Xu, et al. The Relationship between Serum Osteocalcin Concentration and Glucose Metabolism in Patients with Type 2 Diabetes Mellitus. International Journal of Endocrinology Volume 2013, Article ID 842598.
- Leopold JA, Am Hear Assoc Inc.,2012;5:605-614.
- Idelevich A, Rais Y, Ornan EM. Bone Gla protein increases HIF-1α-dependent glucose metabolism and induces cartilage and vascular calcification. Arterioscler Thromb Vasc Biol. 2011;31:e55-e71.
- Tataru MC, Heinrich J, Junker R, et al. C-reactive protein and the severity of atherosclerosis in myocardial infarction patients with stable angina pectoris. Eur Heart J 2000;21:1000-8.
- O’Keefe JH, Conn RD, Lavie CJ, et al. The new paradigm for coronary artery disease: altering risk factors, atherosclerotic plaques, and clinical prognosis. Mayo Clin Proc. 1996;71:957-65.
- King DE, Mainous AG 3rd, Buchanan TA, et al. C-reactive protein and glycemic control in adults with diabetes. Diabetes Care 26(5):1535-8.
