Research Article - Biomedical Research (2017) Volume 28, Issue 6
Segmentation of heart tissues using gathering and colour analysis techniques
Yousif MY Abdallah*Department of Radiological Science and Medical Imaging, College of Applied Medical Science, Majmaah University, Majmaah, Saudi Arabia
- *Corresponding Author:
- Yousif MY Abdallah
Department of Radiological Science and Medical Imaging
College of Applied Medical Science
Majmaah University, Saudi Arabia
Accepted on November 5, 2016
Abstract
Image processing considers as powerful tool in recognition of heart tissues in nuclear medicine investigations that increase the percentage and amount of tissues detected. K-means gathering and colour analysis techniques were used in this study. The images treated using MatLab program. Firstly, the images were changed to colour rich space format. Then each pixel in the image was characterized using color analysis algorithms. Then the segment heart tissues were displayed in colour form in discrete new image. The quantitative analysis had done using both precision and recall computation. The results were 99.3+4.57. This method presented capacities cumulative of recognition of the heart tissue with high precision rate.
Keywords
Cardiac scintography, Myocardium, Image processing, Recognition, Matlab.
Introduction
Nuclear medicine imaging is accomplished to evaluate heart physiology and pathology. SPECT methods preponderate compared with other scanning procedures like cardiac computerized tomography. Recently, in developed countries, heart tissue scanning is commonest modality to evaluate certain hearts disorders [1,2]. The assessment is focused mainly on heart tissues using ERNA. The myocardial scanning is performed to hazard valuation in patients with heart insufficiency. Recognition of CAD is grounded on the heterogeneity in blood flow between a normal coronary vessel and one with an anatomic stenosis or abnormal physiological function [3]. Recognition of CAD depends on the dissimilarity in blood circulation [4,5]. In blood Vessels with a serious obstruction is known as one of the most dominant luminal sectional constricting many actions might happen [6]. The most severe obstructions, >85%, naturally have no blood movement replacement [7]. Many radioisotopes administrated into body in order to cardiac muscles scanning. The most severe obstructions, >85%, naturally have no blood movement replacement [7]. The available Tc-99m radiopharmaceuticals used for cardiac muscles imaging. Tc-99m and Tl-201 tracers were established. The available Tc-99m radiopharmaceuticals used for cardiac muscles imaging [8]. Tc-99m is better in imaging due to the quality and scattering [8]. In the last several decades, medical imaging systems have advanced in a dynamic progress. There are many advance technologies, which introduce to the medical imaging systems [9,10]. These technologies help in development of image features such as image quality and gaining [11,12]. The quality of attended images is tainted many factors, such as inherent and extrinsic three-dimensional resolution of the nuclear medicine machines.
These features result in indistinct and noisy pictures. The blurred images present artefacts that may principal to misdiagnosis. These images use to increase a diagnostic value for the physician, it is obligatory to monitor exact sequences of dispensation [13].
Research Method
This is study conducted to study colour ischemic heart image using colours segmentation filters of MatLab software package. The study included all adults patients referred for suspected CAO or heart disease in Nuclear medicine department.
The 2D cardiac scintographs data obtained from the SPECT. Those images were saved as JPEG image format with high dpi percentage to sanctuary the quality of the image. For recognition of heart tissues, I must segment the heart borders.
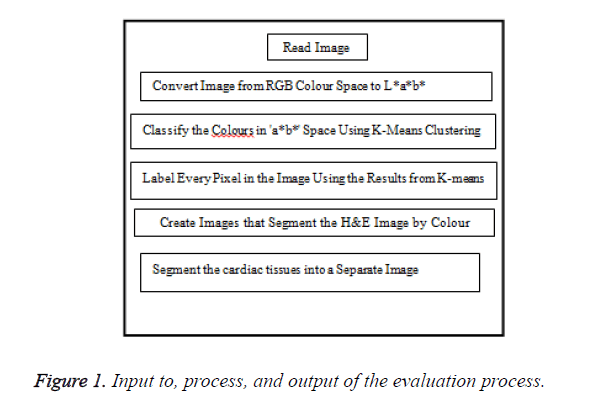
The coronary tissues must segment in such a proper way. The image is viewing the heart tissues along with the other parts of the chest as background uptakes. Since, I was interested in the heart tissues solitary, so additional areas inside the image are considered as noise for me and so must be filtered so that I can segment the heart tissues and apply processing to detect the borders. I applied K-means grouping and colour analysis techniques to enhance the cardiac images. The steps of segmentation were shown in the Figure 1.
K-means
It is a segregating technique. The role of k-means is divide data into k equally high-class clusters, and revenues the directory of the cluster to which it has allocated respectively remark. K-means works on definite comments and generates a solitary level of groups. The details of the minimization could be controlled using several elective input factors to k-means, counting ones for the preliminary values of the middle clusters, and for the extreme amount of repetitions. The k-means process showed in the following formula:
 (1)
(1)
Where,
 is the Euclidean distance between xi and vj.
‘ci’ is the number of data points in ith group.
‘c’ is the amount of group middles.
Results
This study conducted to study colour ischemic heart image using colours segmentation filters of MatLab software package. The sample of this study was 20 patients with different age distribution and body mass index.
In this study firstly, the cardiac images was treated using MatLab program. The coloured image used in nuclear cardiology because its capability to differentiate the different tissue types easily.
Numerous colours can notice in the cardiac image if one disregards differences in intensity. The CIE L*a*b* permits to count the graphic variances. The L*a*b* colour space is derivative from the CIE XYZ. Altogether colour statistics is in the 'a*' and 'b*' layers. The variance among 2 colours was calculated by the Euclidean metric.
In this study, the colour cardiac image were converted to L*a*b* colour scale using forward transformation algorithm. The RGB values need to be distorted to exact total colour, such as sRGB.
Forward algorism
L*=116 (Y/Yn)-16 → (1)
a*=500 [f (X/Xn)-f (Y/Yn)] → (2)
b*=200 [f (Y/Yn)-f (Z/Zn)] → (3)
Where,
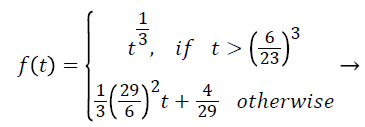 (4)
(4)
Where Xn, Yn, and Zn are the tristiulus values. The separation of the f function divide in 2 areas which completed to avoid an immeasurable gradient at t=0 was assumed to be straight underneath approximately t=t0, and was assumed to equal the t1/3 portion of the function at t0 in both value and slope.
Steps of the segmentation
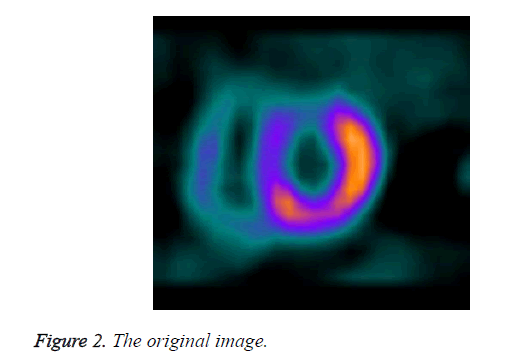
Step 1: Attaining picture:
The image read in MatLab program (Figure 2).
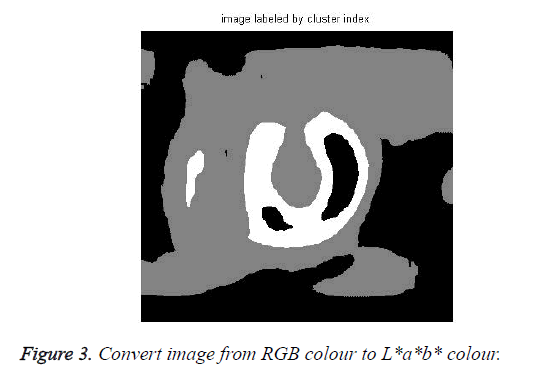
Step 2: Changing image format:
In this step, the image change using makes form and applies for algorithm (Figure 3).
Step 3: Categorize the colours in ‘a*b*’ space using k-means
Subsequently, the colour data occurs in the ‘a*b*’ space, the images are pixels with ‘a*’ and ‘b*’ values. K-means used to group the images into three groups using the Euclidean distance metric.
Step 4: Tag each pixel in the image
In this stage, each pixel in the image was labelled using their clusters directory.
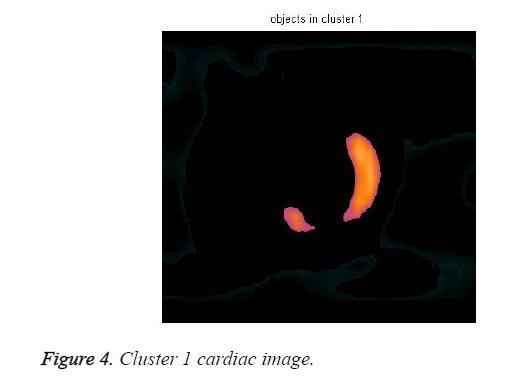
Step 5: Subdivision the image by Colour.
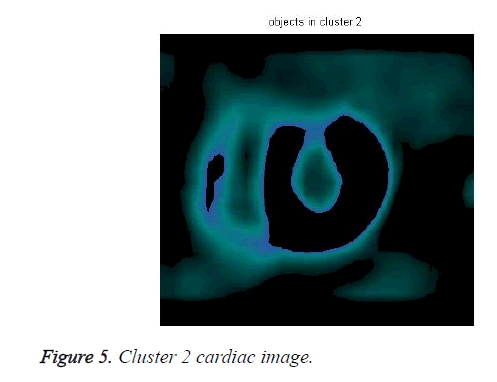
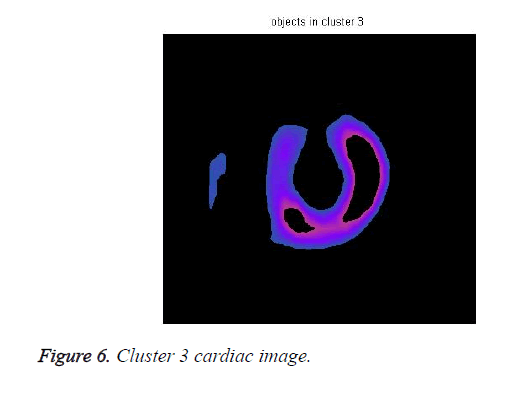
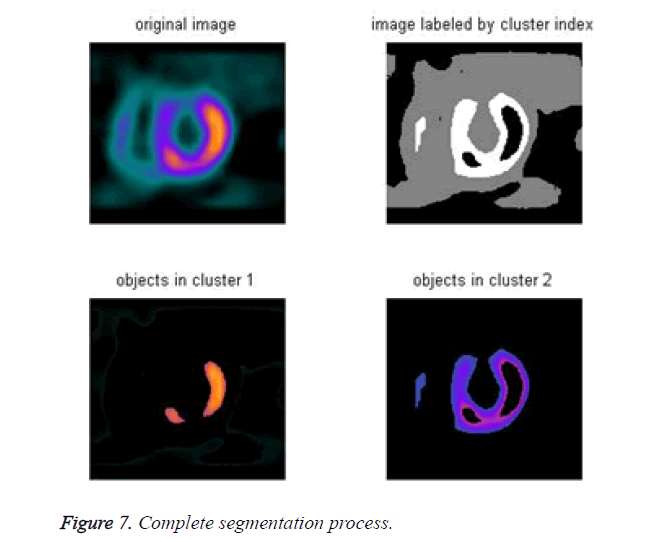
The cardiac tissue separate into three images using pixel label, which were shown in Figures 4-6.
Step 6: Segment the result into a distinct image.
Step 7: display all segmentation process (Figure 7).
Discussion
Segmentation used to identify the object of image that we are interested. The nuclear cardiology has become a common way to study myocardial disorders. Most images that created cardiac images were not completely clear and some contain Signal Noise Ratio (SNR), which affected myocardial borders detection. The result of tissue recognition matches the initial in-memory outcome comparing with others studies using different segmentation techniques comparing with other scientifical results [14-30].
Acknowledgement
The authors are thankful to the Deanship of Scientific Research, at Majmaah University for funding this research.
References
- Georgiev T, Zheng C, Nayar S, Curless B, Salesin D, Intwala C. Spatio-angular resolution trade-offs in integral photography. Proc EGSR 2006.
- Abdallah Y. Application of analysis approach in noise estimation, using image processing program. Lambert Publ Press GmbH 2011; 123-125.
- Abdallah Y, Yousef R. Augmentation of X-rays images using pixel intensity values adjustments. Int J Sci Res 2015; 4: 2425-2430.
- Abdallah Y. Increasing of edges recognition in cardiac scintography for ischemic patients. Lambert Publ Press GmbH 2011; 123-125.
- MATLAB Users Guide. MathWorks USA 2009.
- Perutka K. Tips and tricks for programming in Matlab, Matlab-modelling, programming and simulations. Emilson Pereira Leite (Ed.) InTech 2010.
- Toprak A, Guler I. Suppression of impulse noise in medical images with the use of Fuzzy Adaptive Median Filter. J Med Syst 2006; 30: 465-471.
- Sun L, Lu Y, Yang K, Li S. ECG analysis using multiple instance learning for myocardial infarction detection. IEEE Trans Biomed Eng 2012; 59: 3348-3356.
- Nicos M. An adaptive backpropogation neural network for real-time ischemia episodes detection. IEEE Trans Biomed Eng 2008; 45.
- Islam MK, Haque A, Tangim G, Ahammad T, Khondokar M. Study and analysis of ECG signal using Matlab and Labview as effective tools. Int J Comp Electr Eng 2012; 4.
- Pueyo E, Sornmo L, Laguna P. QRS slopes for detection and characterization of myocardial ischemia. IEEE Trans Biomed Eng 2008; 55: 468-477.
- Zhao H, Yan J. The wavelet decomposition and reconstruction based on the Matlab. Proc Int Sym Electr Comm Secur 2010; 10: 143-145.
- Vanovermeire OM, Duerinckx AJ. A practical approach to 64-slice coronary CT angiography. JBR-BTR 2006; 89: 1-7.
- Varshney S, Rajpal N, Purwar R. Comparative study of image segmentation techniques and object matching using segmentation. Proc Int Conf Meth Mod Comp Sci 2009: 1-6.
- Aurdal L. Image segmentation beyond Thresholding. Norsk Regnescentral Norwegian Computing Center 2006.
- Abdallah Y, Hassan A. Segmentation of brain in MRI images using watershed-based technique. Int J Sci Res 2015; 4: 683-688.
- Hamada K, Tomita Y, Ueda T, Enomoto K, Kakunaga S. Evaluation of delayed 18F-FDG PET in differential diagnosis for malignant soft-tissue tumors. Ann Nucl Med 2006; 20: 671-675.
- Sung YM, Lee KS, Kim BT, Choi JY, Shim YM. 18F-FDG PET/CT of thymic epithelial tumors: usefulness for distinguishing and staging tumor subgroups. J Nucl Med 2006; 47: 1628-1634.
- Pant GS, Rajabi H. Basic atomic and nuclear physics. Himalaya Publ House 2008; 122-133.
- Pichler BJ, Wehrl HF, Judenhofer MS. Latest advances in molecular imaging instrumentation. J Nucl Med 2008; 49: 5-23.
- Blodgett TM, Meltzer CC, Townsend DW. PET/CT: form and function. Radiology 2007; 242: 360-385.
- Zaidi H, Mawlawi O, Orton CG. Point/counterpoint. Simultaneous PET/MR will replace PET/CT as the molecular multimodality-imaging platform of choice. Med Phys 2007: 34:1525 1528
- Goris ML, Zhu HJ, Robinson TE. A critical discussion of computer analysis in medical imaging. Proc Am Thorac Soc 2007; 4: 347-349.
- Abidov A, Germano G, Hachamovitch R, Berman DS. Gated SPECT in assessment of regional and global left ventricular function: major tool of modern nuclear imaging. J Nucl Cardiol 2009: 13: 26-79
- Ficaro EP, Lee BC, Kritzman JN, Corbett JR. Corridor4DM: the Michigan method for quantitative nuclear cardiology. J Nucl Cardiol 2007; 14: 455-465.
- Gonzalez R, Woods R, Eddins S. Digital image processing using Matlab. Gatesmark Publ USA (2nd edn.) 2009: 142-162.
- Abdallah Y. Application of analysis approach in noise estimation: using image processing program. Lambert Acad Publ 2011; 145-169.
- Abdallah Y. Increasing of edges recognition in cardiac scintigraphy for ischemic patients. J Biomed Eng Med Imag 2016: 2.
- Nailon H. Texture analysis methods for medical image characterization. Biomed Imag Youxin Mao (Ed.) In Tech 2010; 202-233.
- Peroutka K. Tips and tricks for programming in matlab, matlab - modelling, programming and simulations. Emilson Pereira Leite (Ed.) In Tech 2010; 302-312.
