Research Article - Biomedical Research (2017) Volume 28, Issue 16
Segmentation and 3D visualization of liver, lesions and major blood vessels in abdomen CTA images
Selvalakshmi VM* and S Nirmala Devi
Department of Electronics and Communication Engineering, College of Engineering, Anna University, Chennai, India
- *Corresponding Author:
- Selvalakshmi VM
Department of Electronics and Communication Engineering
College of Engineering
Anna University, India
Accepted on July 26, 2017
Abstract
The three dimensional (3D) imaging plays a vital role in rapidly emerging field of computer assisted surgical planning which includes minimally invasive surgery, targeted drug delivery and tumor resection. In case of liver tumor patients, for considering all these applications the surgeon must know the patho-anatomical relationship of hepatic tumor with respect to the major blood vessels .This paper presents the implementation of algorithms for segmentation of liver, lesions and major blood vessels from tri-phase CT images. The proposed algorithm uses fuzzy clustering based active contours segmentation techniques which require minimal human intervention and it does not compromise the accuracy of the segmented results. Later the segmented structures are visualized in three dimensions (3D). The performance comparison of the proposed algorithm with other state of art algorithms demonstrates its robustness in segmenting low contrast and inhomogeneous lesions and blood vessels in CTA images.
Keywords
Active contours, Computed tomography angiogram (CTA), Spatial FCM clustering, Three dimensional (3D) visualization.
Introduction
According to American cancer society, in the year 2016 about 39,230 new cases of liver cancer and intrahepatic bile duct cancer will be diagnosed and about 27,170 people will die of these types of cancer in US. In the case of primary and metastatic liver tumors, surgery either with tumor resection or a liver transplant will be the only reasonable chance to survive [1]. In the case of patients with single tumor that have not grown into blood vessels, a surgery to remove part of liver called partial hepatectomy is considered. Liver transplantation is opted for a patient whose tumors cannot be removed with surgery either because of its location or it is too diseased to be removed from the normal liver structure. Liver resection is one of the major, serious surgeries that should be performed by only skilled and experienced surgeons. The liver cancer patients besides having cancer also have other liver complications; the surgeon should remove the tumor carefully leaving behind enough liver tissue to enable the liver function adequately. A lot of blood passes through liver and the liver makes substances that aids in blood clotting. So, a damage to the liver and connected major blood vessels during the surgery leads to major bleeding problems.
The commonly used modality for diagnosis and preoperative planning of abdominal organs is computed tomography (CT). Based on strategies such as entropy based segmentations, region growing techniques, level set techniques and multi-level thresholds, various automatic and semi-automatic techniques for tumor segmentation have been developed in recent years. Moltz et al. proposed a technique for delineating tumor boundaries [2]. He used adaptive thresholding with model-based morphological processing. Abdel-massieh et al. proposed a method which uses Gaussian smoothing followed by multilevel isodata thresholding and image binarization [3]. Jimenez-carretero et al. proposed a multi resolution level set approach with adaptation curvature technique [4]. Ben-Dan and Shenhav proposed an active contour-based algorithm using weighted function foe efficient tumor segmentation [5]. Wong et al. proposed a region growing technique which uses knowledge based constraints [6]. Various vessel segmentation approaches developed for liver vasculature are model based approaches, neural network based approaches, tracking based approaches and pattern recognition approaches. Multi scale pattern recognition approaches [7] are very fast and accurate in vessel segmentation of CT and MRI images. The region growing approaches are widely used in vasculature segmentation. They depend on intensity similarity and spatial proximity for vasculature segmentation [8,9]. Vessel tracking approaches are widely used in retinal and cardiac vasculature segmentation. The important markers for diagnosis and treatment evaluation of cancer in liver is the 3D analysis of the volume, shape and enhancement [10,11]. The surgeon is not limited by lesion detection but by accurately finding out the exact location and its extent in three dimension. Thus the outcome of surgery can be very well improved by developing advanced techniques for 3D display of lesions and vascular structures [12].
Workflow
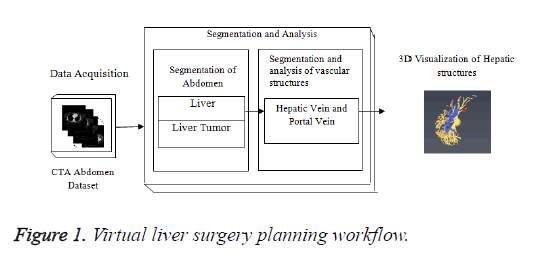
In Figure 1, the stack of CTA images represents the data acquisition; middle block represents the different steps in segmentation algorithm for liver, lesions and hepatic vessels such as hepatic and portal vein. The lower block represents the 3D output results generated by the Visualization technique. The liver tumor segmentation, segmentation and classification of hepatic vessels were tested on Portal venous enhancement phase (PVP) images of tumor patients which were captured at a fixed time interval. The hepatic vascular system becomes visible when the contrast agent perfuse through the hepatic vessels. Different hepatic vessels become visible at different time intervals depending upon the perfusion of contrast agent.
Materials and Methods
Liver segmentation and visualization
The geometric properties and intensity distributions of liver vary to a large extent in inter-patient and intra-patient groups. The presence of noise and ambiguous boundaries makes the segmentation of liver a challenging task [13]. The algorithms with high automation which can be applied for liver segmentation are categorized into 4 groups. (i) Intensity based methods: threshold based method to discard undesired area. The result of the algorithm greatly depends on selection of threshold which is not suitable for complex images such as abdomen CTA images [14]. (ii) Priori knowledge based methods: The prior knowledge of distance and orientation relation is used for establishing liver segmentation models [15]. (iii) Statistical based methods: the liver likelihood images are obtained from quantities of datasets, thereby discriminating the statistical model of the liver [16]. The model generation process takes longer time. (iv) Active contour models: They are the most commonly used method in liver segmentation [13].
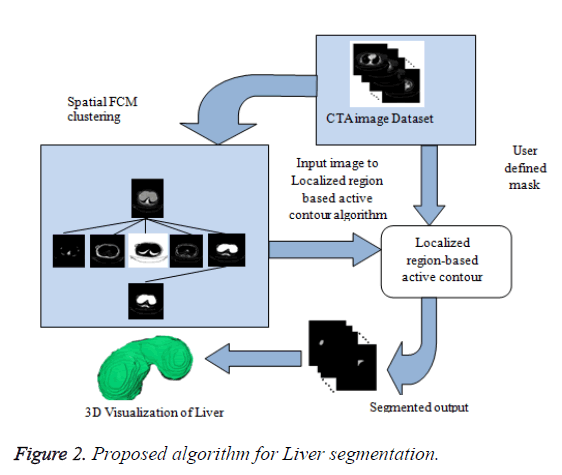
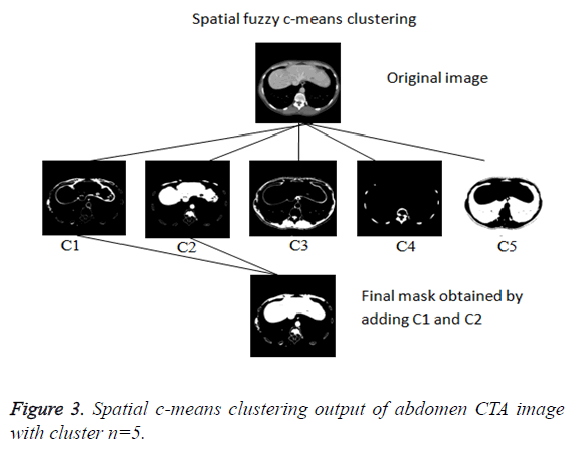
In this paper, a novel method for liver segmentation has been developed by integrating the spatial fuzzy c means clustering process and active contour segmentation algorithm. The algorithm implementation strategy is illustrated in Figure 2. As the initialization of the contour is the major issue in contour based segmentation, the localizing region based active contour algorithm accepts the used defined mask as input which evolves to fit into exact liver boundary (Figure 3).
Even though reduced manual interaction is desired in any segmentation algorithm, the availability of varied liver datasets of liver tumor patients justify the use of the proposed semi-automatic segmentation technique. Initially the spatial FCM clustering is applied to all the slices in the dataset with 5 clusters. Selection of the cluster for the spatial c-means algorithm is an important feature for the proposed algorithm. The random selection of cluster for contour initialization results in incorrect masks. The cluster which contains only the liver region is chosen as reference by the user for marking the approximate liver boundary. When the proposed algorithm is used to segment liver containing lesion, the clusters which contains only the lesions and the clusters which contains the liver region except the lesion region are added together to obtain the cluster which contains the total liver region. Then the localizing region-based active contour model is employed in the cluster which contains only liver region. The robust Localized region based active contours algorithms are not based on global energies for segmenting inhomogeneous objects like the liver [17]. It uses the user marked liver boundary as initial contour which evolves to fit into exact liver boundary.
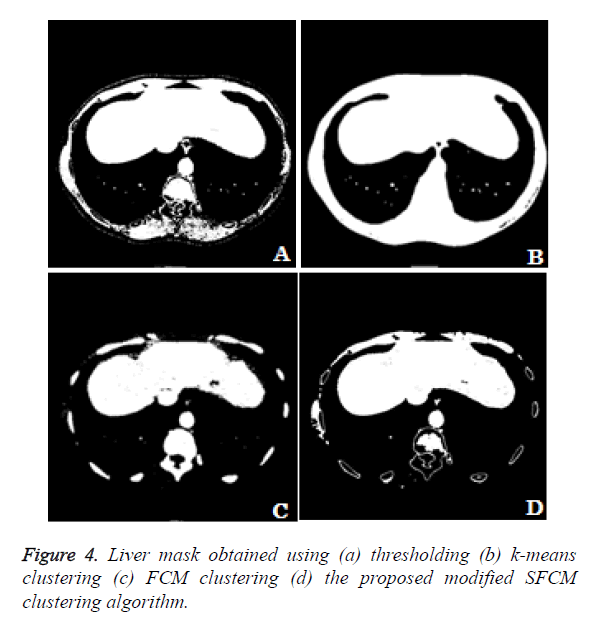
The different methods for obtaining liver mask has been compared. In the thresholding technique the user define the threshold for extracting the liver region alone. From the Figure 4a we can see that the liver region got extracted along with the surrounding thoracic bones. The k-means clustering technique clusters the input image in to 5 different clusters. The cluster which contains the liver region alone is considered. From the Figure 4b we can observe that the liver region got extracted along with the thoracic bones and the liver region is well merged with the thoracic bones which make the liver segmentation task a difficult one. Figure 4c shows the liver mask obtained using fuzzy c-means clustering using 5 clusters. From the clustered result we can notice that the lesion area and some region have been missing in the liver and the cluster includes thoracic bones. Figure 4d shows the liver mask obtained from the proposed modified spatial fuzzy c-means clustering algorithm. The presence of thoracic bone in the cluster has been reduced to greater extent and the liver region is well extracted and detached from the thoracic bone. Among the 4 methods to extract the liver mask, the proposed modified sfcm clustering performs well and hence it is considered for further liver segmentation.
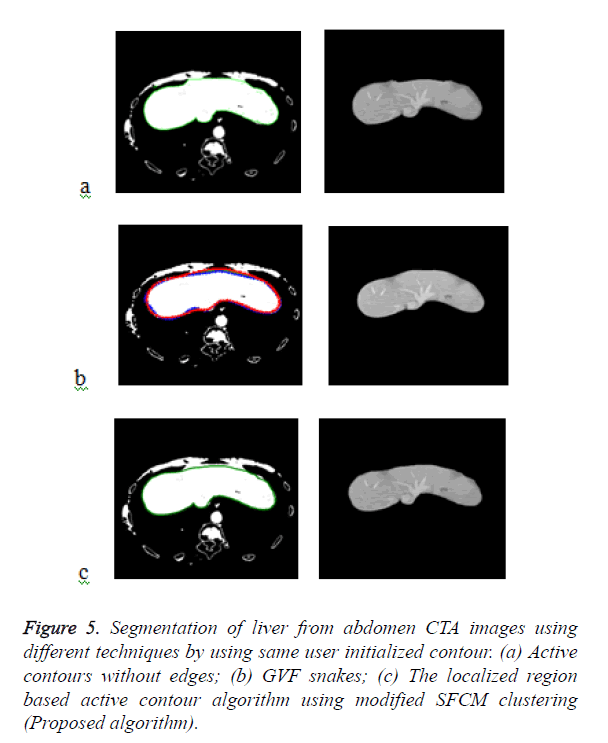
Figure 5a shows the segmented liver output using the Chan- Vese segmentation algorithm which is a type of geometric active contour model. The liver segmentation using Gradient Vector Flow (GVF) snakes in Figure 5b and it demonstrates that the concavities in the image have not been segmented properly and over segmentation occurs in some areas. The Figure 5c demonstrates the liver segmentation output of the proposed algorithm.
Performance evaluation metrics
Dice coefficient (DC): The Dice coefficient measures the similarity between the ground truth and segmented image. The ground truth is given by A and the segmented image is given by B. The Dice coefficient is given by,
 (1)
(1)
Jaccard index (JAC): The Jaccard Index also measures the similarity between ground truth image A and segmented image B. JAC varies between 0 and 1, the value of JAC closer to 1 indicates higher similarity.
 (2)
(2)
Precision: Given two segmentations, segmented result S and ground truth R. Precision is given by,
 (3)
(3)
Where |S| is the total number boundary pixel. significant over-segmentation and presence of greater localization errors in large number of boundary pixels makes the Precision value to be low.
Rand index (RI): The similarity between two data clusters are measured by Rand Index (RI). Consider given a set of n elements and two sets of S. The variable ‘a’ as number of pair of elements present in S that are present in the same set in X and in the same set in Y. The variable ‘b’ is defined as number of pair of elements present in S that are present in the different sets in X and in the different sets in Y. The variable ‘c’ is defined as number of pair of elements present in S that are present in the same sets in X and in the different sets in Y. The variable ‘d’ is defined as number of pair of elements present in S that are present in the different sets in X and in the same sets in Y. the Rand Index (RI) is given by
 (4)
(4)
Global consistency error (GCE): The extent to which one segmentation can be viewed as a refinement of other segmentation can be measured in terms of Global Consistency Error (GCE).
 (5)
(5)
Segmentation error measurement E(S1,S2,pi) and E(S2,S21,pi) for a given pixel pi takes two segmentations S1 and S2 as input, and the output is in the range 0 to1, where zero signifies no error. Lower value of GCE indicates better segmentation.
Variation of information (VoI): Variation of information measures the sum of information gain or loss between two given clusters. It also measures the extent to which one cluster can explain the other cluster [18-24]. VoI is a non-negative metric, with lower values indicting high similarity.
VoI= H(X)+H(Y)-2I(X, Y) → (6)
H(X) is entropy of X and I(X, Y) is mutual information between X and Y.
The proposed algorithm is run on Windows 10 Operating system with 4.00 GB RAM and Intel Celeron processor with speed of 2.16 GHz. The Table 1 indicates various evaluation metrics of different algorithms such as computation time, Dice Coefficient (DC), Jaccard Coefficient, Precision, Rand Index, Gross Consistency Error and Variation of Information. By comparing the computation time and various performation evaluation metrics obtained from the above techniques for the 5 slices of CTA image used in this paper, the proposed algorithm is found to be producing the best segmentation output.
| Liver segmenatation algorithm | Computation Time (seconds) | DC | JAC | Precision | RI | GCE | VoI |
|---|---|---|---|---|---|---|---|
| Chan-Vese | 10.0254 | 0.9340 | 0.8816 | 0.9601 | 0.9650 | 0.0299 | 0.2175 |
| GVF | 5.0788 | 0.9506 | 0.9101 | 0.9700 | 0.9704 | 0.0230 | 0.1726 |
| Proposed | 2.0898 | 0.9700 | 0.9405 | 0.9705 | 0.9800 | 0.0101 | 0.1205 |
Table 1. Comparision of performance evaluation metrics of liver segmentation algorithms.
The 3D dataset are rendered using third party software called Amira developed by FEI, based in the USA. Amira is a powerful software for visualizing, manupulating and analysing data from CT, MRI and many other imaging modalities. The 3D rendering of liver shown in Figure 2 have solid surface and a mesh finish. The rendering surface can be also generated with translucent surfaces and varying opacities. The translucent surface of the liver can be rendered when there is a need to display liver along with lesions and vasculature to get complete idea of the location of tumor and extent of the disease.
Tumor segmentation and visualization
The following two difficulties are considered for segmenting liver tumor efficiently [18].
1) The lesions are much more diverse in their appearance. The gray values of liver parenchyma and lesions depends on contrast agent injected, contrast timing, parameter set during scan, type of cancer and patient conditions [19]. Lesions appears to be inhomogeneous if they have contrast-enhanced rim or if they are partially calcified. The lesion can also be hypo dense or hyper dense than the surrounding liver parenchyma.
2) The dataset contains hundreds of image slices which makes the assisted segmentation impractical to be applied on every slice. The varying appearance and shape of tumor over the image sequence makes the segmentation task non trivial. Moreover the task is greatly dependent on the liver and experience of the radiologist which leads to errors in the result.
We address the above two issue in proposed method of our previous work in liver tumor segmentation [20,21]. It is a multi-stage segmentation approach comprised mainly of 3 stages.
• Image de-noising: median filter is applied to remove speckle noise and to improve contrast of tumor region in liver.
• Spatial FCM clustering: The input image is divided into n number of clusters. In spatial FCM algorithm the spatial information is incorporated into fuzzy membership functions. Therefore the misclassified pixels of the noisy images can be easily corrected.
• Fuzzy Bernstein level set: Coarse tumor segmentation obtained in sep 2 is improved using level set evolution which uses Bernstein basis function.
Image de-noising: The 3 × 3 median filter is applied to all slices in the dataset. Spurious and speckle noise effects present in the liver CT images are reduced and contrast of the tumor is increased by using medina filter [22]. The median filter is applied in a slice-by-slice fashion for each slice containing liver in the dataset.
Spatial FCM clustering: Presence of noise and artifacts affects the performance of traditional FCM algorithm. The above mentioned disadvantages of the standard FCM algorithm is overcome by the spatial FCM algorithm by incorporating the spatial information into the fuzzy membership function [23]. The spatial information is given by the spatial function,
 (7)
(7)
In spatial domain NB(xj) is a square window centered on pixel xj. hij represents the probability that pixel xj belongs to ith cluster.
 (8)
(8)
The original membership value and clustering result will not change in the case of homogenous regions. But in the images containing noise the spatial function in the equation (8) reduces the weight of noisy cluster. By this way spatial fuzzy c-means algorithm corrects the misclassified pixels in images containing noise.
Fuzzy Bernstein level-set: The Bernstein polynomial plays an important role in mathematical theory of function approximation. The Bernstein polynomials are used as basis functions in the Chan-Vese energy formulation. The spatial FCM clustering is utilized to initiate zero level set and curve evolution of the Bernstein level set. The smoothing parameter and regularizing parameters are obtained from the spatial FCM clustering output.
The proposed technique for liver lesion segmentation is compared with existing techniques such as fuzzy level sets [25] and fuzzy legendre level sets [21] for the 5 slices of CTA image used in this paper. The results in Table 2 shows that the proposed algorithm produces better results in less time when compared to the existing techniques.
| Liver lesion Segmentation algorithm |
Computation Time (seconds) | DC | JAC | Precision | RI | GCE | VoI |
|---|---|---|---|---|---|---|---|
| FLS | 22.35379 | 0.3865 | 0.2390 | 0.8959 | 0.9980 | 0.0005 | 0.0071 |
| FL2S | 1.509594 | 0.6311 | 0.4598 | 0.4600 | 0.9982 | 0.0006 | 0.0089 |
| Proposed | 1.206863 | 0.6850 | 0.5230 | 0.5208 | 0.9953 | 0.0002 | 0.0063 |
Table 2. Comparision of performance evaluation metrics if liver lesion segmentation algorithms.
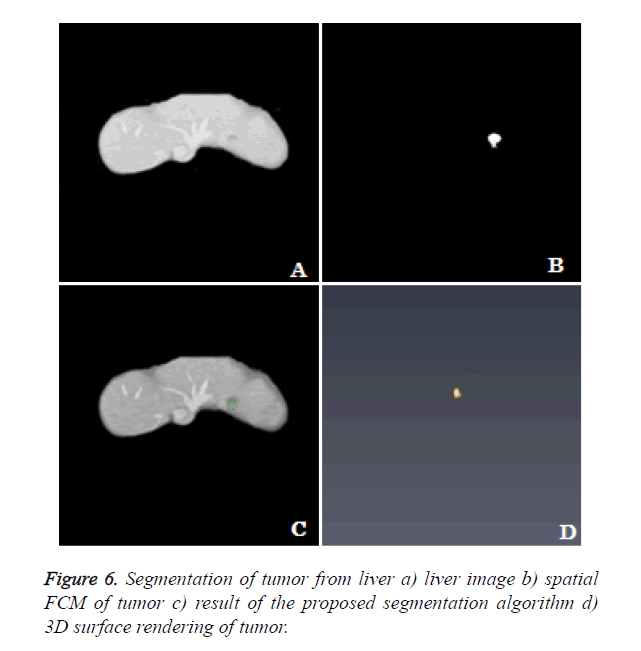
3D rendering: The segmentation algorithm is applied to all the slices of the dataset and rendered in 3D space. The location of tumor, size and extent of tumor within the liver can be seen clearly from the 3D rendering (Figure 6).
Hepatic vessels segmentation and visualization
Accurate vessel segmentation from liver CTA images becomes a challenging task due to the presence of significant noise and complex inhomogeneous background. Assessment of liver vasculature is essential in applications [26] such as,
• Living-donor related liver transplant: It is a surgery where a piece of liver is removed from healthy liver donor and transplanted into a diseased recipient whose diseased liver part has been removed already. Study of all hepatic branching system before the surgery is essential.
• Oncology applications: Studying and understanding of liver vasculature should be done before surgical intervention in oncology patients.
• Selective internal radiation therapy (SIRT): The blood vessels are displayed along with liver and tumor in 3D space. This offers a clear map of the extent of vasculatures feeding the tumor and enables the surgeon to find out the injection point of the radio-isotope, Yttrium 90 (Y-90).
The liver receives dual blood supply from hepatic portal vein and hepatic arteries. The deoxygenated blood collected from liver and blood which has been filtered by liver are transported by the hepatic vein to the inferior vena cava. The damage to the hepatic vessels during surgery leads to heavy blood loss which may be fatal. The algorithm used for segmenting hepatic vessels is the same algorithm used to segment hepatic tumor in section 2.2.
The classification of hepatic vessel is done based on the relative anatomical locations of the major vessels in the liver. The initial segmented result of the hepatic vasculature is morphologically opened to avoid partial volume effects between hepatic vein and portal vein. Next, the four largest connected components are identified using connected component analysis. The four identified components are the left hepatic, right hepatic, middle hepatic, and portal veins. Based on the liver anatomy the portal vein is found to be the inferior component among the four [27]. The hepatic vein branches are labeled according to their anatomical location in the liver. The morphological opening makes the smaller vessels appear eroded and the vasculature mask becomes incomplete. A region growing algorithm enables the vein branches grow back to the results of the proposed algorithm segmentation output.
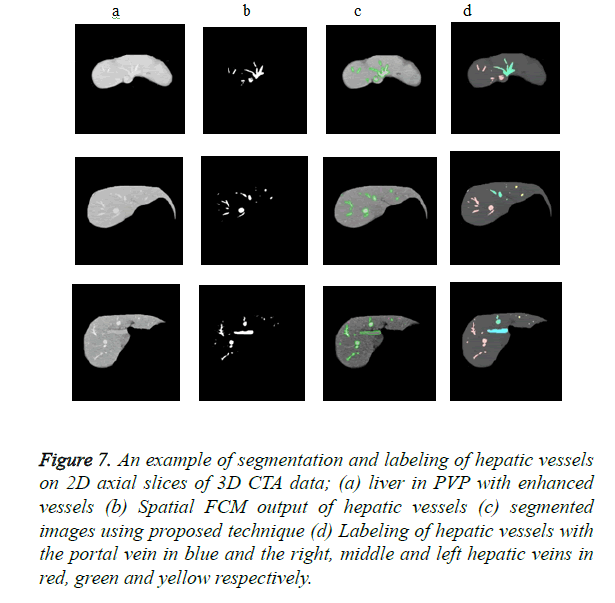
Figure 7 shows the efficient segmentation and labeling of hepatic vessels in 2D axial slices of 3D CTA images. The hepatic and portal vasculature was correctly identified and labeled into the major vessel trees in the liver: the portal and right, middle and left hepatic veins.
Figure 7. An example of segmentation and labeling of hepatic vessels on 2D axial slices of 3D CTA data; (a) liver in PVP with enhanced vessels (b) Spatial FCM output of hepatic vessels (c) segmented images using proposed technique (d) Labeling of hepatic vessels with the portal vein in blue and the right, middle and left hepatic veins in red, green and yellow respectively.
Results
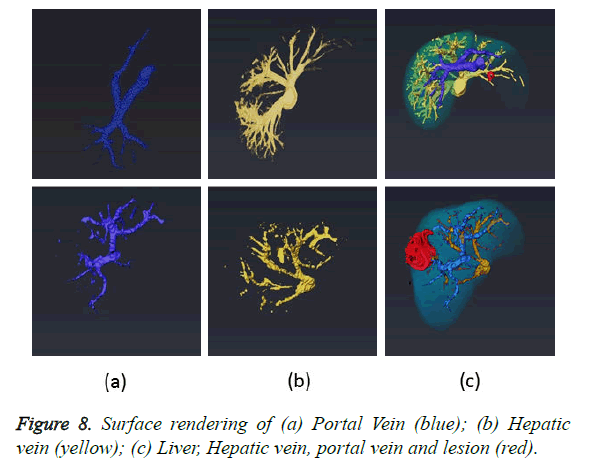
The final task after completion of all the segmentation modules is to combine the results obtained from liver, lesion and vessel segmentation algorithms to produce a complete 3D view. Four masks containing liver, lesion, portal and hepatic vein are fed to the software Amira for 3D rendering. The fusion of four masks and its 3D surface rendering is illustrated in Figure 8c. The first row in the Figure 8 demonstrates various masks obtained using dataset 1 and second row using dataset 2. 3D rendering are shown from different orientations to clearly show the relative location of lesion, blood vessels and blood vessels feeding the lesion. The in-depth analysis of the 3D rendering provides the surgeon with information regarding all sources of blood to tumor and blood vessels which are not shown up in 2D angiograms.
Conclusion
A novel framework for segmentation and visualization of liver, lesion and hepatic vasculatures such as portal and hepatic vein is presented. The algorithm developed for liver segmentation achieved the task by integrating modified spatial fuzzy c-means algorithm and localizing contouring algorithm with user initiated contour. The proposed algorithm for lesion and hepatic vessel segmentation is Bernstein level sets which utilizes the spatial fuzzy clustering to locate the boundary of the region of interest exactly. The level set evolution is made faster and accurate by using the extracted region of the interest boundary as initial level set contour. The Bernstein level sets use the Bernstein polynomials to model the regions of foreground and background in Chan-Vese energy functional. The proposed algorithm successfully segments the inhomogeneous lesions and also intra hepatic vessels with low contrast. The proposed method avoids the shortcomings of the traditional graph cuts or intensity-based vessel segmentation methods by including the spatial fuzzy clustering and level sets .The segmented vessels were correctly classified and then labeled into right, middle and left hepatic, and portal veins using a manual process that incorporates anatomical information. The processing time is an important factor to be considered for any computer aided diagnostic system. Performance evaluation of proposed methodology has been compared with other state-of-art techniques. The experimental results showed satisfied performances.
References
- https://www.cancer.org/cancer/liver-cancer/treating/surgery.html
- Moltz J, Borneman L, Dicken V, Peitgen H. Segmentation of lever metastases in CT scans by adaptive thresholding and morphological processing. MIDAS 2008.
- Abdel-Massieh NH, Hadhoud MM, Amin KM. Fully automatic liver tumor segmentation from abdominal CT scans. International Conference on Computer Engineering and Systems 2010.
- Jimenez-Carretero D, Fernandez-de-Manuel L, Pascau J, Tellado JM, Ramon E, Desco M, Santos A, Ledesma-Carbayo MJ. Optimal multi resolution 3D level set method for liver segmentation incorporating local curvature constraints. Conf Proc IEEE Eng Med Biol Soc 2011; 2011: 3419-3422.
- Ben-Dan I, Shenhav E. Liver tumor segmentation in CT images using probabilistic. MIDAS 2008.
- Wong D. A semi-automated method for liver tumor segmentation based on 2D region growing with knowledge-based constraints. MIDAS 2008.
- Sarwal A, Dhawan A. Three dimensional reconstruction of coronary arteries from two views. Eng Med Biol Soc 1997; 2: 565-568.
- Higgins WE, Spyra WJJ, Ritman EL. Automatic extraction of the arterial tree from 3D-angiograms. Proceed Annual Int Confer IEEE Eng 1989; 2: 563-564.
- Selle D, Preim B, Schenk A, Peitgen HO. Analysis of vasculature for liver surgical planning. IEEE Trans Med Imaging 2002; 21: 1344-1357.
- Ellert J, Kreel L. The role of computed tomography in the initial staging and subsequent management of the lymphomas. J Comput Assist Tomogr 1980; 4: 368-391.
- Soyer P. Hepatic metastases from colorectal cancer: influence of hepatic volumetric analysis on surgical decision making. Radiology 1992; 184: 695-697.
- Fishman EK. Surgical planning for liver resection. J Computer 1996; 29: 64-72.
- Chen Y, Wang Z, Zhao W. Liver segmentation in CT images using Chan-Vese model. The first International Conference on Information Science and Engineering-ICISE 2009.
- Lim SJ. Automatic liver segmentation for volume measurement in CT images. J Visual Commun 2006; 17: 860-875.
- Campadelli P. Automatic liver segmentation from abdominal C scans. 14th International Conference on Image Analysis and Processing-ICAP 2007.
- Zhou X. Construction of a probabilistic atlas for automated liver segmentation in non-contrast torso CT images. Int congress series 2005; 1281: 1169-1174.
- Lankton S, Tannenbaum A. Localizing region-based active contours. IEEE Trans Image Process 2008; 17: 2029-2039.
- Lin L. Inference with collaborative model for interactive tumor segmentation in medical image sequences. IEEE Transact Cybernetics 2016; 46: 2796-2809.
- Moltz JH. Advanced segmentation techniques for lung nodules, liver metastases and enlarged lymph nodes in CT scans. IEEE J Top Select Topic Signal Process 2009; 3: 122-144.
- Selvalakshmi VM, Devi SN. Improved fuzzy clustering and legendre level sets for segmentation of multiple tumors in low contrast liver cta images. Int J Biomed Eng Technol 2017.
- Selvalakshmi VM, Devi SN. A Novel region based segmentation of hepatic tumors and hepatic vein in low contrast CTA images using Bernstein polynomials. Biomed Res India 2017; 28: S324-S33.
- Arce G, McLoughlin M. Theoretical analysis of the max/median filter. IEEE Transact Acoustics, Speech Signal Process 1992; 35: 60-69.
- Chuang KS, Tzeng HL, Chen S, Wu J, Chen TJ. Fuzzy c-means clustering with spatial information for image segmentation. Comput Med Imaging Graph 2006; 30: 9-15.
- Mobahi H, Rao SR, Yang AY, Sastry SS, Ma Y. Segmentation of natural images by texture and boundary compression. Int J Comput Vision 2011; 95: 86-98.
- Li BN, Chui CK, Chang S, Ong SH. Integrating spatial fuzzy clustering with level set methods for automated medical image segmentation. Comput Biol Med 2011; 41: 1-10.
- Mohammed G. A novel 3D segmentation algorithm for anatomic liver and tumor volume calculations for liver cancer treatment planning. Florida International University 2012.
- Couinaud C. Liver anatomy: portal (and suprahepatic) or biliary segmentation. Commons below Dig Surg 1999; 16: 459-467.
