Research Paper - Journal of Clinical Ophthalmology (2018) Volume 2, Issue 1
Reproducibility of the OQUAL grid cataract grading system in an African setting.
Bhatt S1, Bekele F1,2 and Murdoch I1*
1Institute of Ophthalmology, 11-43 Bath Street, London, UK
2London School of Hygiene and Tropical Medicine, Keppel Street, London, UK
- *Corresponding Author:
- I Murdoch
Institute of Ophthalmology
11-43 Bath Street, London, EC1V 9EL
Tel: +44 2076086896
Fax: +44 2076084012
E-mail: i.murdoch@ucl.ac.uk
Accepted date: January 08, 2018
Citation: Bhatt S, Bekele F, Murdoch I. Reproducibility of the OQUAL™ grid cataract grading system in an African setting. J Clin Ophthalmol. 2018;2(1):27-31.
DOI: 10.35841/clinical-ophthalmology.2.1.27-31
Visit for more related articles at Journal of Clinical OphthalmologyAbstract
Aim: There is no universal grading system for age-related cataracts. ‘Lens Opacities Classification System III’ (LOCS III), the current gold standard, requires lengthy training, is not time or costeffective and can have poor patient cooperation. These challenges are compounded in resource poor settings. In this study, we explore the OQUAL™ grid as a potential lens grading system compared to the gold standard to overcome these constraints. Method: Pensioners aged over 49 years in Mekelle, Ethiopia were offered a free eye examination and involved in the study if a cataractous lens was present. The degree of crystalline lens opacity was graded using LOCS III and the OQUAL™ grid. Bland-Altman plots were constructed to investigate agreement between both methods of cataract assessment. Results: Bland-Altman plots demonstrated good agreement between both both methods for pure nuclear sclerotic (NS) cataracts. There was weak agreement between both methods for other lens opacity with no systematic bias. A significant association with visual acuity was demonstrated with both OQUAL™ (Chi2=79.0 p=0.019) and a composite LOCS score (Chi2=73.7 p=0.004). Conclusion: This study confirms the OQUAL™ method bears comparison with LOCS III in predicting visual acuity and good agreement exists between the methods when assessing pure NS cataracts which are regarded as difficult to diagnose and grade. The OQUAL™ system detects severe cataracts with worse visual acuities, it is portable, simple, objective, cheap and requires a shorter training period than LOCS III. This allows for large-scale screening, case-finding or research to be conducted in a time and cost effective manner as OQUAL™ can be utilized by a technician on a largescale.
Keywords
Cataract, Methods comparison, LOCS III, Grading
Introduction
Age related cataract is the leading cause of blindness and low vision globally [1-5]. There is no universal grading system. The several existing lens grading systems have been criticized for being subjective [6-10], or too technically complex and not easy for extensive field use [11-15]. The current gold standard lens grading method is ‘The Lens Opacities Classification System III’ (LOCS III) [16] which involves grading four cataractous changes. Case examination is compared to pre-set images to obtain a description of the cataract type and severity.
This system demonstrates some flaws. Firstly slit-lamp grading requires lengthy training and has not demonstrated strong intra-observer reliability [17]. Evaluation of photographic grading, however can be used as part of this process and involves a shorter training period, has increased reproducibility and high intraclass correlation at 97% [14,16,17] but is not time or cost effective when used to screen high volumes of patients. Used at the slit-lamp, LOCS III can be a drawn-out process for patients to cooperate and interpretation can be affected by slit-lamp settings including beam and illumination [18].
The subjective LOCS III grading system, does not have as strong agreement with visual acuity compared to other objective cataract grading systems [19,20] and does not demonstrate significant correlation with visual acuity in cortical cataract grading [21]. Despite the above challenges, LOCS III remains the most common option for large scale epidemiological studies but not in use outside of a clinical trial situation.
Professor Weale developed an alternative lens grading system named OQUAL™. The OQUAL™ grid is used to quantify the image forming function of the anterior segment of the human eye [22-24]; this paper explores the potential use of this as a lens grading system compared to the gold standard of LOCS III.
Method
This study was conducted in Mekelle, Tigray, Ethiopia. Details of pensioners residing in Mekelle were obtained through the social welfare office database and the pensioner’s association. All primary pensioners aged over 49 years were contacted when they collected their monthly pension and offered a free eye examination at an accessible well equipped private clinic in town.
Participants’ unaided visual acuity was measured with a logMAR acuity chart. If the acuity was 0.0 or better (6/6+ equivalent) in each eye no further action was taken. If the acuity was worse than 0.0 an ophthalmic examination was undertaken. Those eligible for inclusion were given an information sheet about the study in their native language and signed consent to participation.
The following inclusion criteria were used:
• Willingness to participate and give consent.
• Able to sit in front of the slit-lamp for the lens grading and photographic sessions.
• No gross corneal pathology.
• No occludable angle.
• Presence of any degree of lens opacity.
• No other evident cause of poor vision.
• Acuity worse than 0.0 and better than 1.0 logMAR.
Study subjects’ pupils were dilated with Tropicamide 1% and Phenylephrine 2.5% mixture. After pupillary dilatation, individuals were taken to a dark room and the degree of crystalline lens opacity were graded using LOCS III and the OQUAL™ grid with both scores recorded.
LOCS III
Lenses were visualised on the slit-lamp using the technique described by Chylack [16-25]. Images were compared with the LOCS III images and graded against photographic transparencies that were the best match. They were graded for nuclear colour (grade 0.1-6.9), nuclear opalescence (grade 0.1-6.9), cortical cataract (grade 0.1-5.9) and posterior subcapsular cataract (grade 0.1-5.9). For the purposes of this study nuclear colour and nuclear opalescence were combined into one ‘nuclear’ score as the two scores rarely differed.
OQUAL™
The ‘lens opacity grid’ (OQUAL™) attaches to the slit-lamp. It contains a structured image consisting of a piece of film strip with the grid printed on it. This is placed in a clip to attach it just above the reflecting mirror of the slit-lamp. The image of the grid is then reflected into the cataractous lens and either viewed or captured using a slit-lamp mounted camera for evaluation. If the finer gratings are clearly visible the lens has a good optical quality, whereas if the gratings are not visible the lens quality is poor.
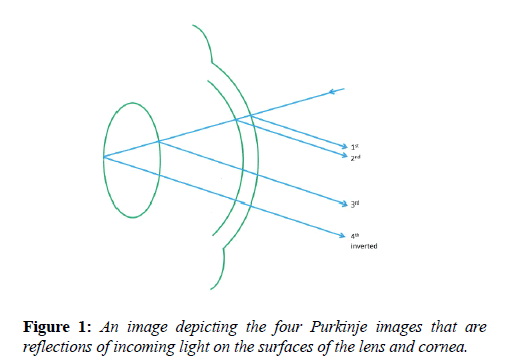
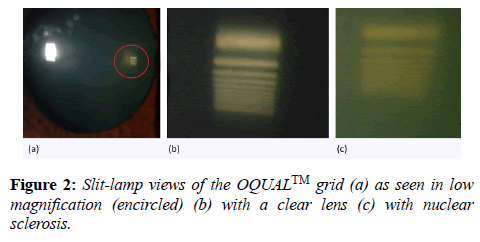
An ideal lens would perfectly transmit 100% of the light that passes through it. Any loss is measured in terms of contrast this is called the modulation of contrast. The modulation transfer function (MTF) is a quantitative measure of the optical quality of an imaging system or component- it is defined as the ratio of maximum to minimum contrast of a sine wave image as a function of periodicity. The MTF of the crystalline lens can be calculated using the OQUAL™ grid, using the OQUAL™ grid the 4th Purkinje image (figure 1) is captured by camera (figure 2a). Research using this grid has concluded that the area under the ‘Modulation Transfer Function’ (MTF) curve as measured using the OQUAL™ device gives a measure of lens optical quality that correlates with the visual acuity [26].
After fitting the OQUAL™ grid, the slit-lamp beam was set at 20 degrees from the midline. Using a magnification of x16, the number of black lines easily visible in the fourth Purkinje image were counted and recorded. In addition a photograph was taken of the image with a Nikon D80 digital camera (figure 2a, 2c)
Ethical approval was given by the London School of Hygiene and Tropical Medicine Ethical committee and the Tigray Regional Health Bureau.
Analysis
Data was entered using Microsoft Excel spreadsheets and analysed using Intercooled Stata™ 7.0 (College Station, TX). Contingency tables were constructed with chi squared and chi squared trend analysis using Epi Info™ 7 (available on www.cdc.gov). Bland-Altman plots were constructed on Microsoft Excel to investigate agreement between methods of cataract assessment.
Results
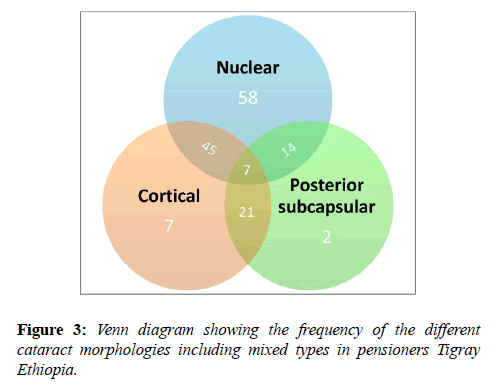
1040 patients attended for an eye examination. Cataract in the absence of any other pathology was detected in 173 individuals of whom 154 had acuities of logMAR 1.0 or better and were included in the study. Participants’ age ranged from 50 to 87 years with an average age of 65. 81% of the participants were male and with the most common visual acuity was logMAR 0.3. Figure 3 shows the distribution of cataract morphology.
The most common morphology was nuclear sclerosis approximately half of whom had mixed morphology.
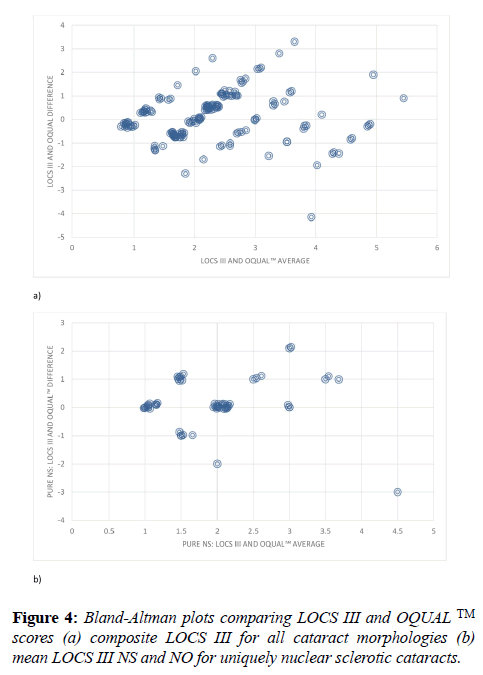
For the purposes of methods comparison a pooled LOCS III score was created by summing the total decimal score. OQUAL™ scores were interpreted depending on the number of visually identified black lines where ‘1’ equals ‘four or more lines visualized’, ‘2’ equals ‘three lines visualized’, ‘3’ equals ‘two lines visualized’, ‘4’ equals ‘one line visualized’, ‘5’ equals ‘Purkinje image obtained, no lines visualized’ and ‘6’ equals ‘no Purkinje image or lines visualized’. The LOCS III decimal maximum score was 11.8 and thus scores were halved so the range matched that of OQUAL™. Bland Altman plots were then constructed to enable comparison of the two methodologies which demonstrated was weak agreement between both methods and no systematic bias (Figure 4a). Bland Altman plots comparing OQUAL™ to the discrete LOCS III scores for uniquely nuclear sclerosis cataracts (Figure 4b) showed good agreement between both LOCS III and OQUAL™ with no systematic bias. Bland Altman plots were constructed comparing OQUAL™ to the discrete LOCS III scores for cortical and posterior subcapsular cataract. There was weak agreement between the two methods with no systematic bias. Our sample sizes for each of these cataract morphologies remain low (Figure 3) and thus convincing interpretations cannot be made.
Contingency tables of acuity compared to the composite LOCS III score showed significant association (Chi2=73.7 p=0.004). This was the same for acuity compared to OQUAL™ (Chi2=79.0 p=0.019). Both were more pronounced using a Chi2 trend analysis (p<0.001).
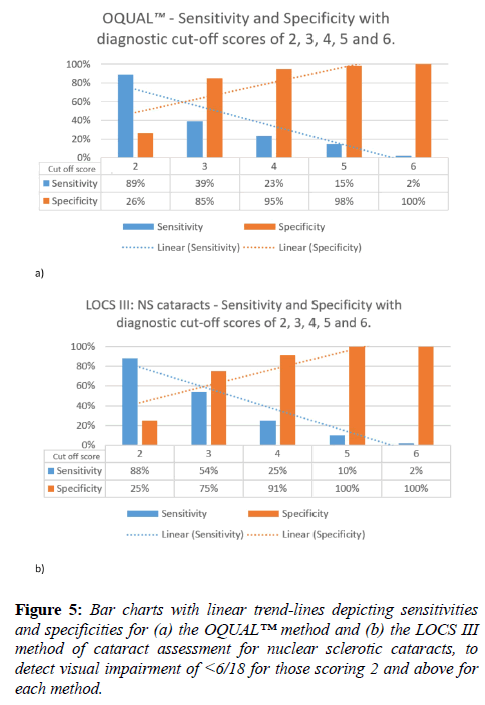
The sensitivity and specificity of OQUAL™ (all cataracts) and LOCS III (pure and mixed nuclear sclerosis cataracts) to detect visual impairment by the WHO criterion of <6/18 was then calculated using each grade as a cut-off. This is illustrated in figure 5.
Discussion
This study confirms use of the OQUAL™ grid may have a place in the detection of visually significant cataract. It is simple to use and produces assessments that bear comparison with LOCS III in terms of predicting effect on visual acuity in particular. The difference in scoring methods between the two grading systems may mean the two results are not directly comparable. LOCS III has subjective matching against images and OQUAL™ counts lines seen. The scales may differ and not be linear hence our results need appropriate caution in interpretation. None-the-less there was quite good agreement for NS and a composite cataract score.
Nuclear sclerotic cataracts are regarded as difficult to diagnose and grade [27] yet are the cataract morphology with the highest incidence prevalence [28]. Our numbers of patients with other forms of cataract were small hence a definitive conclusion cannot be made for the value of OQUAL™ in assessing posterior subcapsular and cortical opacities.
The OQUAL™ system detects more severe cataracts with worse visual acuities and has a range of assessment that extends beyond the less severe pathology for which LOCS III is most suited. It is cheap and portable, simple and objective, easy to use and has a much shorter training period than that required of LOCS III. This allows for future research to be conducted in a time and cost effective manner as the OQUAL™ system can be utilized by a technician on a large-scale.
In consideration of the OQUAL™ system as a screening method our analysis suggests an OQUAL™ cut-off score of 3, i.e. 2 or less visible gratings, might be optimal giving a sensitivity of 39% and specificity of 85% for visually significant cataracts. Whilst this is not ideal such a rapid and easy assessment may well have a place as an adjunctive test in a case-finding/screening strategy.
The summative nature of the OQUAL™ grade means it does not report cataract types and is less suited for early lens opacity. Thus its place would be much more in a resource poor setting in which there is severe disease with a need to detect those suitable for surgery rapidly and easily. In contrast the LOCS III grading system supplies detail of early cataract type and severity which is well suited to research questions investigating cataract progression.
Other assessment mechanisms have been proposed in such settings such as the use of digital camera images [29] and a red-light diode emitting device [30] in addition to clinical examination. All of these systems rely on the red reflex or direct view of the lens. OQUAL™ uses an alternative optical assessment since it measures the degradation of image formation by the lens. This relates most nearly to the primary symptom of cataract formation, namely image degradation by lens opacity. In addition it provides a scale of image degradation for analysis.
The OQUAL™ grid is a cataract grading system which addresses problems faced by the existing detailed grading systems which are too expensive or technically difficult to operate. It agrees with LOCS III readings particularly in the case of uniquely nuclear sclerotic cataracts which are regarded as the most challenging to grade. It reflects visual acuity data particularly for more severely affected acuities and may have particular use in a rural setting in which it could be easily implemented by a technician for case finding and large-scale projects.
Conflict of Interest
The authors declare no conflict of interest.
Acknowledgements
It is with deep regret we report the death of Professor Weale, the original inventor of the OQUAL™. We gratefully acknowledge the support for this study by BandAid via a Fight for Sight grant number 512827, those who helped Dr. Bekele with data collection and all the patients who participated in this study. Mr Pak Sang Lee assisted in our graphical illustrations.
References
- Thylefors B, Negrel A, Pararajasegaram R, et al. Global data on blindness. Bull World Health Organ. 1995;73:115-21.
- Minassian D, Mehra V. 3.8 million blinded by cataract each year: projections from the first epidemiological study of incidence of cataract blindness in India. Br J Ophthalmol. 1990;74:341-3.
- Saw S, Husain R, Gazzard G, Koh D, Widjaja D, Tan D. Causes of low vision and blindness in rural Indonesia. Br J Ophthalmol. 2003;87:1075-8.
- Foster A, Johnson GJ. Magnitude and causes of blindness in the developing world. Int Ophthalmol. 1990;14:135-40.
- Foster A. Cataract-a global perspective: Output outcome and outlay. Eye. 1999;13:449-53.
- Leske MC, Chylack LT, Sperduto R, et al. Evaluation of a lens opacities classification system. Arch Ophthalmol. 1988;106:327-9.
- Sparrow J, Bron A, Brown N, et al. The Oxford clinical cataract classification and grading system. Int Ophthalmol. 1986;9:207-25.
- Taylor HR, West SK. The clinical grading of lens opacities. Aust N Z J Ophthalmol. 1989;17:81-6.
- Mehra V, Minassian D. A rapid method of grading cataract in epidemiological studies and eye surveys. Br J Ophthalmol. 1988;72:801-3.
- West SK, Taylor HR. The detection and grading of cataract: an epidemiologic perspective. Surv Ophthalmol. 1986;31:175-84.
- West SK, Rosenthal F, Newland H, et al. Use of photographic techniques to grade nuclear cataracts. Invest Ophthalmol Vis Sci. 1988;29:73-7.
- Datiles M, Magno BV, Freidlin V. Study of nuclear cataract progression using the National Eye Institute Scheimpflug system. Br J Ophthalmol. 1995;79:527-34.
- Dragomirescu V, Hockwin O, editors. Method and equipment for computerized microdensitometric measurement of Scheimpflug anterior eye segment photographs. Proc Int Soc Eye Res; 1980.
- Hall NF, Lempert P, Shier RP, et al. Grading nuclear cataract: reproducibility and validity of a new method. Br J Ophthalmol. 1999;83:1159-63.
- Maclean H, Taylor CJ. An objective staging for cortical cataract in vivo aided by pattern-analysis computer. Exp. Eye Res. 1981;33:597-602.
- Chylack LT, Wolfe JK, Singer DM, et al. The lens opacities classification system III. Arch Ophthalmol. 1993;111:831-6.
- Karbassi M, Khu PM, Singer DM, Chylack Jr L. Evaluation of Lens Opacities Classification System III applied at the slitlamp. Optom Vis Sci. 1993;70:923-8.
- Kirwan JF, Venter L, Stulting AA, Murdoch IE. LOCS III examination at the slit lamp, do settings matter? Ophthalmic Epidemiol. 2003;10:259-66.
- Pei X, Bao Y, Chen Y, et al. Correlation of lens density measured using the Pentacam Scheimpflug system with the Lens Opacities Classification System III grading score and visual acuity in age-related nuclear cataract. Br J Ophthalmol. 2008;92:1471-5.
- Lim SA, Hwang J, Hwang K-Y, et al. Objective assessment of nuclear cataract: Comparison of double-pass and Scheimpflug systems. J Cataract Refract Surg. 2014;40:716-21.
- Pan A-P, Wang Q-M, Huang F, et al. Correlation among lens opacities classification system III grading, visual function index-14, pentacam nucleus staging, and objective scatter index for cataract assessment. Am J Ophthalmol. 2015;159:241-7.
- Weale R. The Oqual: a new device for measuring the optical quality of the anterior segment of the human eye. Exp Eye Res. 1992;55:507-10.
- Lobo R, Weale R. The objective clinical assessment of the quality of the anterior segment by means of the Oqual. Doc Ophthalmol. 1993;83:71-8.
- Weale R. Contact lenses and the cornea: age and length of wear. Br J Ophthalmol. 1995;79:163-5.
- Chylack LT, Leske MC, McCarthy D, et al. Lens opacities classification system II (LOCS II). Arch Ophthalmol. 1989;107:991-7.
- Shams PN, Davies NP, Weale RA. Quantitative assessment of lens optical quality: the area under the modulation transfer function (MTF) curve correlates with visual acuity. Poster presentation at: American Academy of Ophthalmology annual meeting. 2006. Las Vegas, USA.
- Sasaki K, Fujisawa K, Sakamoto Y. Quantitative evaluation of nuclear cataract using image analysis. Ophthalmic Res 1992;24:26–31
- Klein BE, Klein R, Lee KE. Incidence of age-related cataract: the Beaver Dam Eye Study. Arch Ophthalmol. 1998;116:219-25.
- Shashwat Pathak, Shubham Gupta, Basant Kumar. A novel cataract detection algorithm using clinical data mapping. Humanitarian Technology Conference (R10-HTC). 2016 IEEE Region 10, pp. 1-5, 2016.
- Rahman MQ, Rotchford AP, Ramaesh K. Catatrac: a novel red light-emitting diode device for screening cataracts in the developing world. Eye (Lond). 2013;27:37-41.
