- Biomedical Research (2015) Volume 26, Issue 3
Regression analysis for testing association between fasting blood sugar and glycated hemoglobin in diabetic patients.
Haseeb A. Khan1*, Samia H. Sobki2, Abdullah S. Alhomida11Department of Biochemistry, College of Science, King Saud University, Riyadh 11451, Saudi Arabia
2Division of Clinical Biochemistrsy, Department of Pathology, Prince Sultan Military Medical City, Riyadh 11159, Saudi Arabia
- *Corresponding Author:
- Haseeb A. Khan
Department of Biochemistry
College of Science
King Saud University
P.O. Box 2455, Riyadh 11451
Saudi Arabia
Accepted April 05 2015
Abstract
The cut-off criterion of serum levels of glycated hemoglobin (HbA1c) >6.5% as an alternative to fasting blood sugar (FBS) >7.0 mmol/L for diagnosis of diabetes mellitus still requires rigorous studies on diverse populations before its safe implementation. We conducted a regression analysis on 75 diabetic patients (40 males and 35 females) for testing the association between FBS and HbA1c and postulation of regression equations for inter-conversion of their levels. The average ± standard deviation values of FBS and HbA1c were 8.101 ± 3.917 mmol/l and 7.989 ± 2.112 %, respectively. Patients with HbA1c >6.5% had significantly higher levels of FBS. We observed a significant correlation between FBS and HbA1c (R= 0.717, P<0.001). The regression equations, HbA1c = 0.387 (FBS) + 4.855 and FBS = 1.33 (HbA1c) – 2.528, could be utilized for inter-conversions between the levels of FBS and HbA1c for predicting their expected values in diabetic patients. Further studies are warranted to examine the deviations from the regression equations in diabetic patients from different ethnicity and demography.
Keywords
Barriers to cessation; Reasons for quitting; Cigarette; Drinking; Concurrent
Introduction
Fasting plasma sugar (FBS) and glycosylated hemoglobin (HbA1c) are important diagnostic markers for diabetes mellitus. The former biomarker indicates the current status of glycaemia whereas the latter is used for measuring the long-term glycemic control. The American Diabetes Association has recommended HbA1c ≥ 6.5% as a possible substitute to FBS ≥ 7.0 mmol/L for diagnosis of diabetes [1]. HbA1c not only provides a reliable measure of chronic hyperglycemia it also correlates well with the risk of long-term diabetes complications. The measurement of HbA1c levels was found to be advantageous over blood glucose levels in predicting the risk of developing diabetes or cardiovascular disease [2]. However, FBS alone was not sufficient for diagnosing approximately half of the patients with dysglycemia whereas the combined use of FBS and HbA1c was found to be useful for preoperative identification of coronary patients with unknown diabetes [3]. A moderate to severe dyslipidaemia has been reported in diabetic patients with HbA1c >6%–9% and >9%, respectively [4]. The dual biomarker ability of HbA1c for predicting glycemic control as well as lipid profile indicator may be utilized for screening of high-risk diabetic patients for timely intervention with lipid lowering drugs [5]. Recently, Khan et al [6] examined the validity of HbA1c cut-point of 6.5% for diagnosis of diabetes using a series of 12785 male diabetic patients with an observation of 3.78% false negative predictions using the set diagnostic threshold of HbA1c.They suggested that Saudi individuals with HbA1c between 6.0-6.5% may be considered as probable diabetics and their status should be verified by combined FBS and HbA1c criteria [6]. In this study, we conducted a regression analysis to determine the relationship between the FBS and HbA1c levels in diabetic patients with the aim to find the regression equations for inter-conversions between their values.
Patients and Methods
We recruited 75 diabetic patients (45 males, 30 females) who visited the clinics of Prince Sultan Military Medical City, Riyadh, Saudi Arabia. The protocol of this study was approved by our Institutional Ethics Committee. All the subjects signed informed consent forms before samples collection.
The mean ages of male and female patients were 50.31 y (24-87 y) and 49.80 y (16-83 y), respectively. Venous blood samples were collected in vacutainer tubes from all the subjects after at least 8 h fasting. The plasma and serum samples were analyzed for FBS and HbA1c respectively using an autoanalyser (Roche Modular P- 800, Germany).
The data were analyzed by SPSS statistical package (version 10). We conducted regression analysis and Pearson’s correlation test to examine correlation between FBS and HbA1c. Independent samples Student’s t-test (2- tailed) was used to compare means between the two groups. P values <0.05 were considered as statistically significant.
Results and Discussion
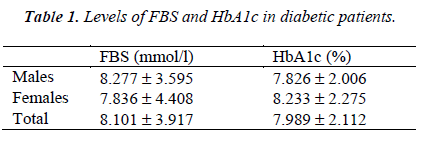
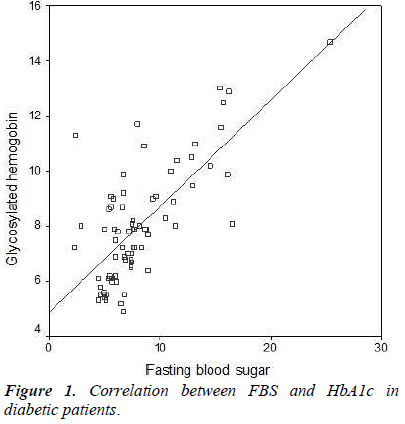
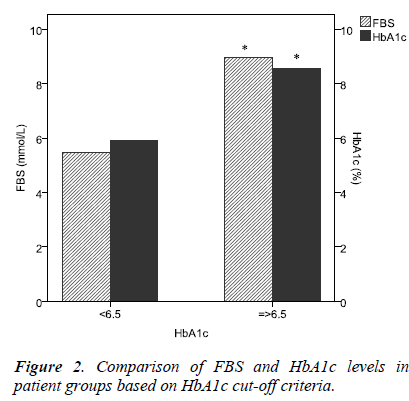
The average FBS and HbA1c levels in all the 75 patients were 8.101 ± 3.917 mmol/L (mean, SD) and 7.989 ± 2.122 %, respectively. Male patients had slightly higher, FBS whereas female patients had slightly higher HbA1c levels; these differences were statistically non-significant (Table 1). There was a significant correlation between FBS and HbA1c (Pearson correlation, R= 0.717, P<0.001, Figure 1). The regression equations were as follows: HbA1c = 0.387 (FBS) + 4.855 and FBS = 1.33 (HbA1c) – 2.528. The R square for the regression analysis was statistically significant (R2 = 0.515, P<0.001). The cutpoint criteria of HbA1c ≥ 6.5 filtered the patients with significantly higher levels of both FBS and HbA1c (Figure 2).
The results of this study showed that the levels of FBS and HbA1c are not affected by patients’ gender as these parameters did not show any significant difference between male and female diabetic patients (Table1). There was a significant correlation between FBS and HbA1c levels which is in agreement with earlier reports on diabetic patients from the same region [4,5].
On the other hand, in Japanese diabetic patients, FBS was not correlated with the HbA1c in patients with HbA1c < 8.0% but FBS was strongly correlated in the group of patients with HbA1c > 8.0% [7].
In this study, patients with HbA1c ≥ 6.5% had significantly high levels of FBS (Figure 2). Previous study on Saudi patients has revealed that HbA1c cut-point of 6.5% resulted in 3.78% false negative predictions [6]. However, studies in Chinese [8], Asian Indians [9] and Asian Americans [10] have shown the optimal cut point of HbA1c for the diagnosis of diabetes as 6.3%, 6.1% and 5.8%, respectively. Applying the regression equation from this study, the HbA1c values of 6.3%, 6.1% and 5.8% would correspond to FBS as 5.8 mmol/l, 5.6 mmol/l and 5.2 mmol/l, respectively, which are comparatively less than the diagnostic threshold of FBS (7.0 mmol/l).
Furthermore, using the regression equation generated in this study, the cut-point of HbA1c (6.5%) corresponds to FBS being 6.1 mmol/l, which is less than the diagnostic cut-point of FBS (7.0 mmol/l). Colagiuri et al [11] have demonstrated narrow glycemic threshold ranges for the presence of diabetes-specific retinopathy and suggested that the current diabetes diagnostic level for FBS should be lowered to 6.5 mmol/l while HbA1c of 6.5% is a suitable alternative diagnostic criterion. However, a cutpoint of HbA1c ≥6.5% has been reported to miss several patients with diabetes, including patients with fasting hyperglycemia as well as with impaired glucose tolerance [12]. Whereas the combined use of HbA1c and FBS for the diagnosis of diabetes offers the benefits of each test and reduces the risk of systematic bias inherent in the individual biomarker testing [12].
In conclusion, the diagnostic potential of FBS and HbA1c is enhanced when these markers are used in combination because their respective cut-points somehow compromise with diagnostic sensitivity and selectivity. The regression equations resulted from our data can be used for interconversions between these two markers. Further studies on large sample sizes and different ethnic groups are warranted to test the possible deviations in the regression equations reported in this study.
Acknowledgments
The authors extend their appreciation to the Deanship of Scientific Research at King Saud University, Riyadh, Saudi Arabia for funding the work through the Research Group Project No. RGP-009.
References
- Gillett MJ. International Expert Committee report onthe role of the A1C assay in the diagnosis of diabetes.Diabetes Care 2009; 32:1327–1334.
- Wareham NJ, Pfister R. Diabetes: glycated hemoglobin is a marker of diabetes and CVD risk. Nat Rev Cardiol. 2010; 7: 367-368.
- Tekumit H, Cenal AR, Polat A, Uzun K, Tataroglu C, Akinci E. Diagnostic value of hemoglobin A1c and fasting plasma glucose levels in coronary artery bypass grafting patients with undiagnosed diabetes mellitus. Ann Thorac Surg. 2010; 89: 1482-1487.
- Khan HA, Sobki SH, Khan SA. Association between glycaemic control and serum lipids profile in type 2 diabetic patients: HbA1c predicts dyslipidaemia. ClinExp Med. 2007; 7: 24-29.
- Khan HA. Clinical significance of HbA1c as a marker of circulating lipids in male and female type 2 diabetic patients.ActaDiabetol.2007; 44: 193-200.
- Khan HA, Ola MS, Alhomida AS, Sobki SH, Khan SA. Evaluation of HbA1c criteria for diagnosis of diabetes mellitus: a retrospective study of 12 785 type 2 Saudi male patients. Endocr Res. 2014; 39: 61-65.
- Kikuchi K, Nezu U, Shirakawa J, Sato K, Togashi Y, Kikuchi T, Aoki K, Ito Y, Kimura M, Terauchi Y. Correlations of fasting and postprandial blood glucose increments to the overall diurnal hyperglycemic status in type 2 diabetic patients: variations with levels of HbA1c. Endocr J. 2010; 57: 259-266.
- Bao Y, Ma x, Li H, Zhou M, Hu C, Wu H, Tang J, HouX, Xiang K, Jia W. Glycatedhaemoglobin A1c for diagnosing diabetes in Chinese population: cross sectional epidemiological survey. BMJ 2010; 340:2249–2257.
- Mohan V, Vijayachandrika V, Gokulakrishnan K, Anjana RM, Ganesan A, Weber MB, Narayan KM.A1C cut points to define various glucose intolerance groups in Asian Indians. Diabetes Care 2010; 33: 515–519.
- Araneta MR, Grandinetti A, Chang HK. A1C and diabetes diagnosis among Filipino Americans, Japanese Americans, and Native Hawaiians.Diabetes Care.2010; 33: 2626-2628.
- Colagiuri S, Lee CM, Wong TY, Balkau B, Shaw JE, Borch-Johnsen K; DETECT-2 Collaboration Writing Group. Glycemic thresholds for diabetes-specific retinopathy: implications for diagnostic criteria for diabetes. Diabetes Care.2011; 34: 145-150.
- Herman WH, Fajans SS. Hemoglobin A1c for the diagnosis of diabetes: practical considerations. Pol Arch Med Wewn. 2010; 120: 37-40.


