Research Article - Biomedical Research (2018) Volume 29, Issue 19
Quantum-assisted CR directed encrypted biomedical signal transmission using knight's tour
Revathy K* and Thenmozhi K
School of Electrical and Electronics Engineering, SASTRA University, Thanjavur, India
- *Corresponding Author:
- Revathy K
School of Electrical and Electronics Engineering
SASTRA University, India
Accepted on December 21, 2017
DOI: 10.4066/biomedicalresearch.29-17-2086
Visit for more related articles at Biomedical ResearchAbstract
Exchange of biomedical data through the internet has achieved tremendous success in the recent past, with the necessity of security in every transmission. It has become indispensable to replenish secrecy in biomedical data by avoiding the access of illegitimate users. To evade such disclosure of medical data, a proposal of encryption system along with Cognitive Radio (CR) has been employed. In this paper, CR has been programmed to choose the non-availability of the primary user and by automatically detecting the presence of available spectrum in the channel using Universal Software Radio Peripheral (USRP). Then using the identified free spectrum, encrypted medical data has been transmitted and exchanged between the authenticated users in rural healthcare units. The proposed encryption technique initiates Latin Square Image Cipher (LSIC) which offers double encryption by making use of two different random keys. Then the output has been subjected to a quantum computation encryption method in which Quantum Walks (QW) serves as a key generator which is meant for its natural nonlinear chaotic behaviour. QW is followed up by the disintegration of Knight’s tour permutation process which helps in tamper proofing and authentication. Finally, shear based affine transform has been employed to avoid imperfections in the medical data. The proposed scheme curtails the insecure medical image communication in biomedical research by creating an authenticated communication link among peers. Metrics such as Number of Pixel Changing Rate (NPCR), Unified Average Changing Intensity (UACI), correlation coefficients, chi-square tests, global and local entropies were estimated and compared with the available literature results.
Keywords
Image encryption, CR, LSIC, Knights tour, Quantum walk.
Introduction
The importance of image encryption has grown widely during the past decades. The primary reason is to prevent the issue of the critical information being disclosed to the unauthorized users [1-3]. Due to these reasons, many encryption techniques have been introduced. Many of those techniques are easy to implement when the data that are being transmitted through internet which is not only in text but also images, audio data and video file are easily hacked [4,5]. To overcome such drawback technique should be designed in such a way that information is highly secured and algorithm must be efficient. Anyhow image data requires more security as to how much extensively they are used. For example, in the military it is essential to protect image data, video conferencing, etc. illegal access has extensively increased with the improvement of computer processor processing power and storage [6-10]. Nowadays internet has become the fastest mode of transmission of more critical and high volume data. Since the internet has become the dominant source for transmission of information, it is highly prone to many attacks. To protect data from unauthorised sources, many techniques have been used such as watermarking, masking data, and encryption. Mostly encryption assures security for data that has been passed through public channels.
Medical image encryption has increased drastically during the past decades. The motivation of medical image encryption is to increase the robustness of patient data which contributed to the development of digital Imaging in Communication and Medicine (DICOM) in 1993. The primary reason for medical image encryption is to provide confidentiality and authentication to patient information [11-13].
LSIC technique is the one where no pixels will be present in more than a rows or column. It helps in providing confusion and diffusion of the pixels to the more significant extent [14-16]. It employs two different random keys to encrypt the image. The concept of LSIC resembles Sudoku principle.
Knight’s tour is an algorithm which has the base of chess model [17,18]. This algorithm provides diffusion to the image pixels, since no pixel can revisit a position more than once. There are several possibilities for the sequences. Hence it is not so easy to be detected or prone to attacks.
With the advancement of quantum computation, quantum image processing has increased drastically in the recent period [19-23]. This is because of the quantum key distribution which provides secured way of information transmission. They have also promoted a new way approach for both image encryption and processing. The affine transform is a technique used for avoiding the imperfections of the image while performing some processes over them. When the image is subjected to an affine transform, they are sheared from their original position.
Cognitive radio is the one, which automatically programs itself to adapt its parameters according to the network range and users demand. It promotes a licensed channel for accessing the spectrum. The CR user will be observing the absence of a primary user and will make use of the band [24-26].
Now-a-days wireless communication has been used in electronic health (e-health) care for transferring the medical information. The medical information can be transmitted by using the wireless technologies such as WiFi, Bluetooth, Zigbee. A wireless network can be created for transferring the data using standard such as 802.11 and 802.22 in communication medium [27-30]. The Electronic health care unit utilizes both the licensed and unlicensed band for accessing the wireless network. This leads to EMI effects on the operating equipment and insufficient medical band [31-36]. The medical devices can be protected from the harmful interference. This can be achieved by modifying the transmit power of the wireless device. The biomedical devices can also be protected by implementing a wireless healthcare service which uses priority scheme for medical and non-medical devices.
This paper proposes a CR based procedure for identifying the unused spectrum using USRP, then using the available spectrum, the encrypted quantum key generated biomedical data were transmitted between legitimate users in rural health care units. Section 2 proposes the methodology used, section 3 provides the results and discussion part, and finally, conclusions are drawn in section 4.
Methodology
Cognitive radio technology
One of the efficient energy detectors has been used to detect the presence of the primary user. Here the resultant signal of the bandpass filter has been converted to digital form to calculate the threshold value. The transformed bits are used to detect the presence of the primary user. The outcome of transformed bits is known as chi-square distribution. Chisquare distribution is given through Gaussian distribution form

Where n is the number of the samples, σn 2, σs 2 are the variances of the noise and received signal s (t) respectively; threshold λ can be calculated as

where ts is the observation time, and K is the bandwidth of the spectrum, the minimum sampling rate should be 2K from the Nyquist sampling theorem, so n can be represented as 2tsK. By analysing the signal spectrum using the RX1 antenna in the NI USRP with the bandwidth limit of 88 MHz to 100 MHz and gain of 20 dB, the presence of the primary user is detected at 98 MHz. Other than the primary user signal at 98 MHz, the remaining spectrum is considered as spectrum holes. To remove interference of primary user signals, a suitable frequency is chosen, say 92 MHz.
Encryption techniques
Latin square image cipher: Latin square image cipher is a permutation network. It is an encryption technique where two different random keys are used. A DICOM image of size 256 × 256 has been used. LSIC provides substitution and permutation. The objective of LSIC is to provide excellent resistance to attacks, more keyspace, highly sensitive, confusion and diffusion properties. Usage of two different keys provides good key sensitivity. The size of two different keys used here is 256 × 256.
Quantum computation: Quantum walks based robust encryption algorithm has been used to generate secret key using quantum walks [19,20]. Quantum based image encryption has paved its way for merging image encryption and quantum computation which provides more advantages such more protection to the data from being accessed by the unauthorised users. Quantum based encryption is performed using the following formula from [19,20].


Here Ci refers to cipher image where i=1, 2, 3….M × N, Ki refers to key, Vi refers to pixels.
Permutation: Image scrambling process is done using knight’s tour mapping. It has originated from chess game in which knight’s tour has been traced. A knight can travel throughout the board only in L shape. This technique provides more security. Since the pixels cannot get back to the location, if it has visited once. It provides beautiful scrambling to the image. So that pixel gets dislocated very far from their initial positions. There are so many possibilities for the knight’s sequence. For a 4 × 4 blocks, there are nearly 78 possible sequences. Similarly, for 8 × 8 blocks, there are more than 1000 possible sequences can be performed for scrambling. Knight’s sequence for 4 × 4 images can be calculated as
 Here, d refers to the size of a block.
Affine transformation: The shear based affine transformation has been used in the proposed scheme. The image is sheared from (a, b) to (a’, b’). There are various types of affine transformations such as geometric, scaling, reflection and rotation. Affine transform performs the displacement of the pixel position from one index to another index.
System design
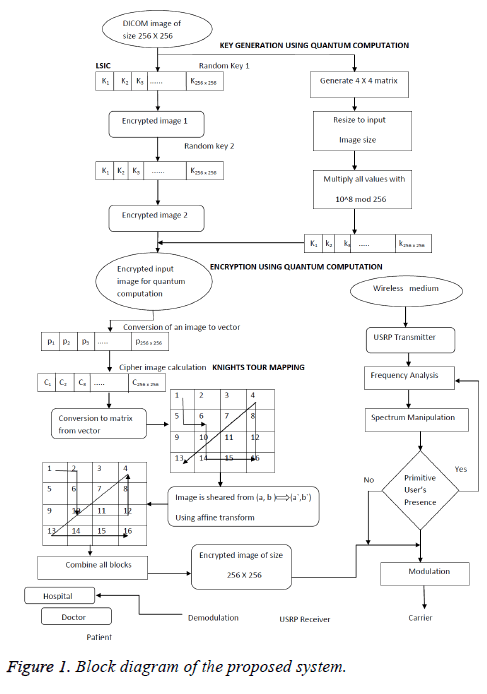
The encryption segment and the spectral sensing unit have been illustrated through the block diagram in Figure 1.
Spectrum sensing procedure
1. To make use of the spectrum, CR users have to observe the presence of the primary user in the channel.
2. If primary user is not accessing the channel, then the information is transmitted as bits through USRP transmitter at a frequency of F=92 M.
3. The bits are then manipulated using fast Fourier transform, integration and compared with the threshold to find the presence of the primary user.
where H0 refers to the presence of a user
H1 refers to the absence  of user
u (t) denotes signal waveform
n (t) denotes zero-mean AWGN
4. The probability of detection pd and the probability of false alarm pfa can be expressed as

b. Here λ stands for threshold, pf should be kept as low as possible, and pd should be kept as high as possible to prevent underutilization of transmission opportunities.
Encryption algorithm
5. Read the DICOM images of size 256 × 256.
6. Get the input key 1 and key 2.
7. The LSIC of the input image is obtained using keys 1 and 2.
8. The image is XORed with key 1, and the resultant image is XORed with key 2.
9. Quantum computation encrypts the image, and the key for the quantum computation is calculated using the below equation

10. Multiply all the values in the resized matrix by 108 modulo 256 to obtain the key; then the sequence can be denoted as k={k1, k2...km × n} where m × n is the size of the original image.
11. Convert the original image into one dimensional vector as P={p1, p2...pm × m}.
12. Then calculate the sum of the pixels as 
13. Calculate ci using the equation from [2].


14. The encrypted image is subjected to permutation by disintegrating the image to 4 × 4 blocks using knight’s tour mapping.

15. Then finally affine transformation is taken for the resultant image.
16. The spatial affine transformation is applied using the matrix
17. Using the above matrix, the image is sheared from (a, b) to (a’, b’).
18. Combine the blocks to get the encrypted biomedical image.
Then using the sensed spectrum, the encrypted biomedical data was transmitted between the authenticated and legitimate users.
Results and Discussions
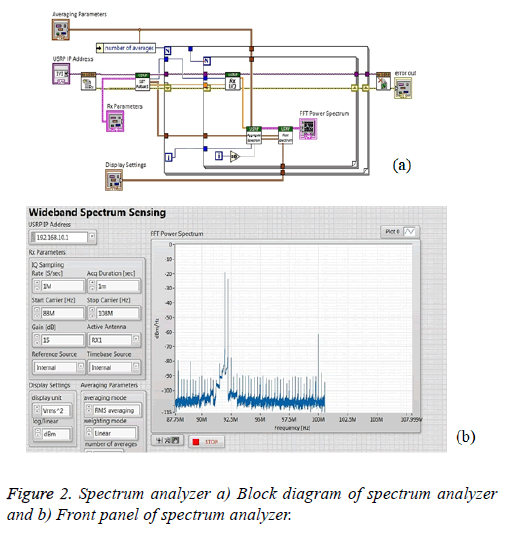
In a wireless network the CR users check the availability of primary user, if the user is not present at the search, then the encrypted bits are transmitted through USRP transmitter. Through analysing the spectrum by making use of RX1 antenna in USRP with the gain of 15 dB and the frequency bandwidth of 88 MHz to 100 MHz is utilised as shown in Figure 2a. The primary user presence is detected at 92 MHz, and other ranges of frequencies are considered to be spectrum holes. The suitable range of frequency spectrum is selected to be 98 MHz to remove interference from the primary user. Figures 2a and 2b depicts the spectrum sensing block diagram and the front panel respectively.
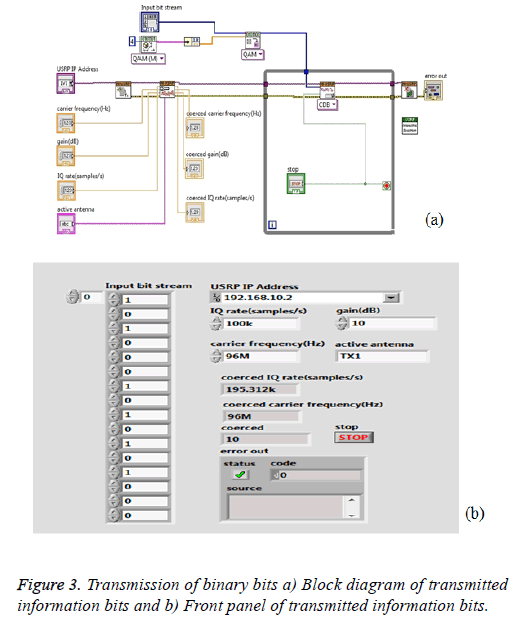
The Figure 3 illustrates that the cipher image pixel elements are converted to 16-bit binary information. This information is modulated by QAM modulation and transmitted by TX1 antenna of NI USRP with the carrier frequency of 98 MHz. Figure 3 also presents the block diagram and the front panel of the transmitted data.
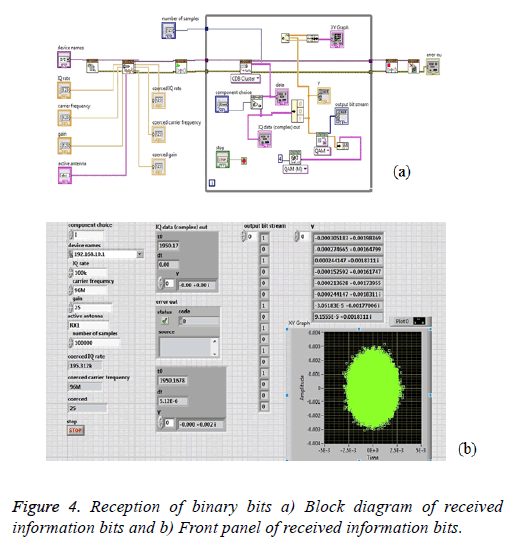
At the receiver antenna, RX1 of NI USRP is maintained at 98 MHz, the frequency at which the data was to be transmitted. QAM then demodulates it and the 16-bit binary data is retrieved back when the signal is received which is shown in the Figure 4. Figures 4a and 4b shows the block diagram of reception of encrypted data.
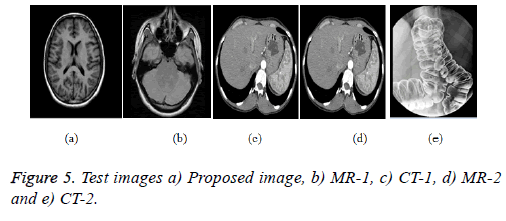
In this section, CT and MRI images of size 256 × 256 and 512 × 512 were considered to evaluate the proposed encryption scheme as shown in Figures 5a-5e.
Statistical analysis of the proposed scheme
Statistical analysis can be estimated for the proposed scheme to validate the robustness and the sternness towards various statistical attacks. Histogram analysis, correlation coefficient and chi-square tests are the various analysis involved in it.
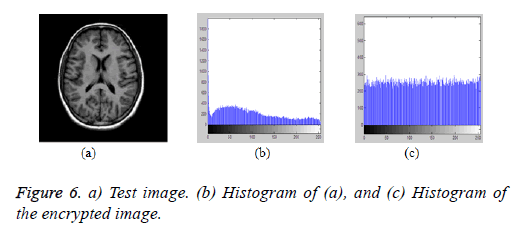
Histogram analysis of the proposed scheme: The pictorial representation of the pixel values of the original and the encrypted image over the grey levels represents the histogram analysis. Figure 6a represents the original test image and Figures 6b and 6c represents the histogram of the original and the encrypted images respectively. From the figures, it is evident that, the pixel distribution is concentrated over the grayscale region and it is flat and uniformly distributed over the entire region for the encrypted image histogram.
Chi-square test: It is one of the statistical analyses to check the strength of a proposed encryption algorithm in which a set of expected and observed values are calculated. When the chisquare value is below the theoretical table value, then the pixels are uniformly encrypted. The chi-square parameter can be measured as

Where ui and vi are the expected and observed values, i is the number of a number of grey values. Table 1, provides the chisquare estimation for various test images. From the table, it is clear that the estimated chi-square values are below the theoretical table value for the degrees of freedom of 255. Hence the encrypted image pixels are uniformly distributed over the entire grayscale region.
| Test images | χ2 |
|---|---|
| Proposed image | 264.3569 |
| MR-1 | 263.4587 |
| CT-1 | 264.2542 |
| MR-2 | 266.7245 |
| CT-2 | 265.1254 |
Table 1. Histogram analysis based on Chi-Square test.
Histogram deviation: Histogram deviation can evaluate the measure of deviation between the original and encrypted image and the equation provides it
 Where ci is absolute difference
of ith pixel, M × N is the size of the proposed image.
Irregular deviation: It is used to measure, how much deviation is provided by the encryption algorithm and it can be analysed as

Where histogram deviation 
Deviation from ideality: The measure of strength of encryption algorithm in which how the algorithm decreases the deviation of encrypted image and it can be calculated using the equation

where A (C) is the histogram of the encrypted image.
In Table 2, the above-said metrics were estimated and tabulated. From Table 2, irregular deviation and deviation from ideality values are minimal, and the histogram deviation values are very higher for the proposed scheme. This proves the robustness of the proposed encryption algorithm.
| Test images | Histogram deviation | Irregular deviation | Deviation from ideality |
|---|---|---|---|
| Proposed image | 2.2542e+003 | 2.2536 | 1.5224 |
| MR- 1 | 2.5369e+003 | 2.4525 | 0.3566 |
| CT- 1 | 3.7548e+003 | 2.7854 | 1.8547 |
| MR-2 | 5.1253e+004 | 4.2542 | 4.2265 |
| CT- 1 | 5.0552 e+004 | 4.4215 | 3.9954 |
Table 2. Evaluation metrics using histogram.
Correlation analysis: Correlation coefficient calculates the quality of least square fitting of the data. Correlation values should be very low for the encrypted image to resist various statistical attacks. The correlation analysis values are tabulated in Table 3 which shows the correlation between the adjacent pixels in horizontal, vertical and diagonal directions respectively for all the test images.
| Test image | Vertical correlation | Diagonal correlation | Horizontal correlation |
|---|---|---|---|
| Proposed image | -0.024 | 0.0038 | 0.0121 |
| MR-1 | -0.652 | 0.0542 | 0.0452 |
| CT-1 | 0.0659 | 0.0980 | 0.2512 |
| CT-2 | 0.020 | 0.5641 | 0.0125 |
| MR-2 | 0.007 | 0.2368 | 0.00354 |
Table 3. Correlation analysis of sample images.
Correlation coefficients can be estimated using the equation

where E (i)=Expected value of i, σ (i)=Standard deviation of i
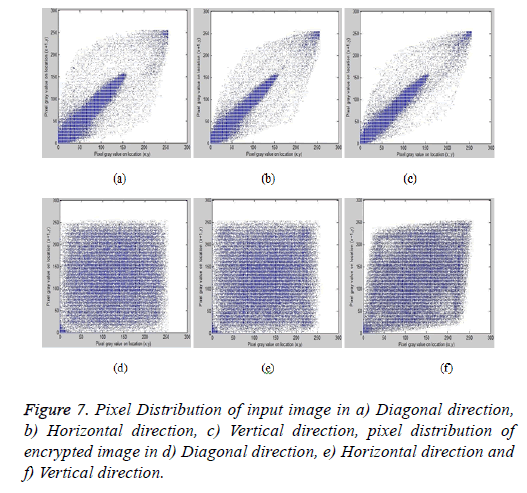
Figures 7a-7c represents the pixel distribution of the original test image, and Figures 7d-7f represents the pixel distribution of the encrypted image in all three directions respectively.
From the figures for the original image, the pixels are more concentrated over a region, and it is uniformly distributed for the encrypted images which prove the robustness of the proposed scheme.
Entropy analysis
Entropy analysis or called as global Shannon entropy is used to evaluate the randomness of the proposed scheme and it is given by

where p (ni) is the probability of appearance of the symbol ni. Global entropy sometimes fails to prove the randomness for the image that has been encrypted partially. Local Shannon entropy was introduced which overcomes the shortcomings in Global Shannon entropy. It can be estimated by initially the dividing the encrypted image into non-overlapping blocks and measuring global entropy. Table 4 provides the estimated the local and global Shannon entropies. From the table, the entropy values are closer to the theoretical value of 8, which confirms the randomness of the proposed scheme.
| Sample images | Entropy of the sample images | Encrypted image Global Shannon entropy | Encrypted image Local Shannon entropy |
|---|---|---|---|
| Proposed image | 3.3346 | 7.9955 | 7.7891 |
| MR-1 | 2.7218 | 7.9904 | 7.5972 |
| CT-1 | 3.1481 | 7.9518 | 7.7262 |
| MR-2 | 2.6336 | 7.9943 | 7.5464 |
| CT-2 | 2.9875 | 7.9998 | 7.6138 |
Table 4. Entropy analysis.
Differential analysis
To strengthen the proposed algorithm, differential analysis like NPCR and UACI were estimated. It can be measured between two encrypted images, one from the original image and the other can be estimated by changing the one-pixel value in the input image. The NPCR and UACI can be calculated as


Where a (u, v)=array of the same size as images D1 and D2

The NPCR and UACI for various test images are listed in Tables 5 and 6 respectively which proves the stability of the proposed system.
| Test images | Reported value(s) |
|---|---|
| Proposed image | 99.595 |
| MR-1 | 99.843 |
| CT-1 | 99.451 |
| MR-2 | 97.781 |
Table 5. NPCR analysis.
| Test images | Theoretically UACI Critical value | |||
|---|---|---|---|---|
| U*-0.05=33.2824% U*-0.01=33.2255% U*-0.001=33.1594% U*+0.05=33.6447% U*-0.01=33.7016% U*-0.001=33.7677% | ||||
| Image encryption methods | Reported value(s) | UACI test results | ||
| 0.05-level | 0.01-level | 0.001-level | ||
| Proposed image | 33.62 | Pass | Pass | Pass |
| MR-1 | 33.26 | Pass | Pass | Pass |
| CT-1 | 33.69 | Fail | Pass | Pass |
| MR-2 | 33.45 | Pass | Pass | Pass |
Table 6. UACI analysis of various test images.
From Table 6, the estimated UACI values for all the test images except CT1 pass the theoretical, critical tests values which evident the sternness of the proposed scheme.
Key sensitivity
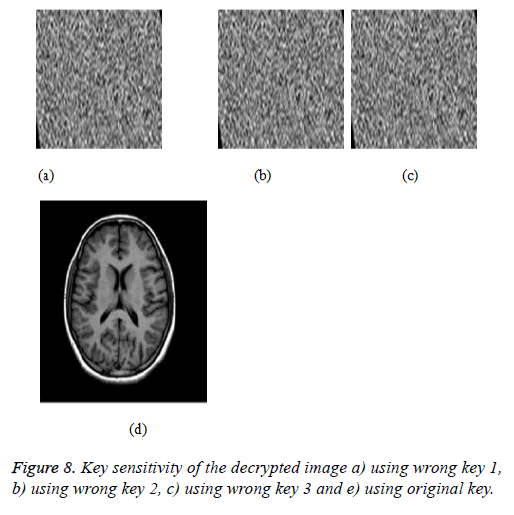
A strong encryption algorithm requires an important property of good key generation algorithm. As an overall efficiency of the encryption algorithm key will be subjected to various test performances. Key sensitivity shows the concept of creating a slight change in the key, which in turn should not decrypt the original image. Figures 8a-8c represents the decrypted image encrypted using wrong keys k1-k3 respectively; Figure 8d illustrates the decrypted image using correct key.
Cropping attack
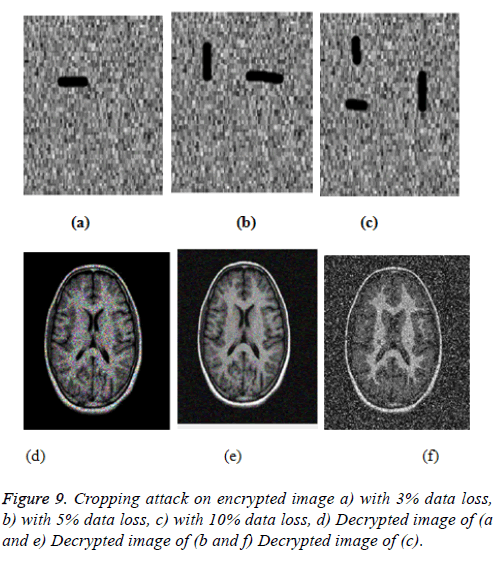
Cropping attack analysis can be estimated by intentionally crop the encrypted image and passing on the decryption algorithm to retrieve the original image. Figures 9a-9c shows the cropped image by 3%, 5% and 10% respectively. Figures 9d-9f represent the decrypted images of (9a-9c) respectively. From the analysis even after cropping some important images could be retrieved this shows the robustness of the encryption algorithm.
Noise attack
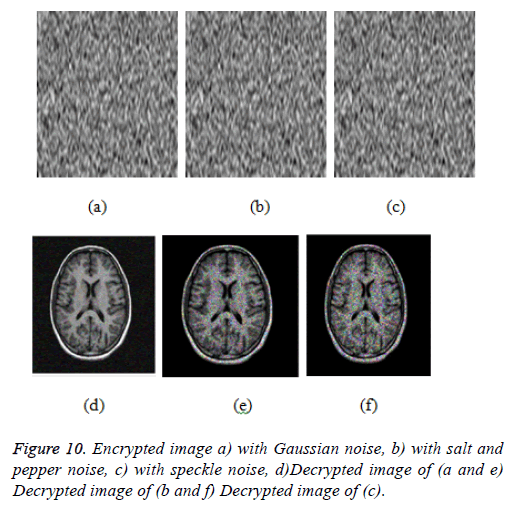
Addition of noises to the encrypted image will also be added to check the robustness of the proposed scheme. Figures 10a-10c represents the Gaussian noise with the range of 0.04, salt and pepper noise with the range of 0.02, speckle noise with the range of 0.04 have been added to the encrypted image respectively. Figures 10d-10f shows the decrypted images of 10a-10c. From the figures, it is clear that the encryption algorithm is resistant to all kinds’ attacks and provides security to the encrypted medical data.
Complexity analysis
The complexity analysis depends on Quantum Computation and LSIC techniques. The size of the key used in LSIC is 256 × 256, and it performs substitution-permutation operations for 8 iterations. This encrypted output is subjected to Knight’s Tour mapping. The next process involved is the quantum computation method of the key generation which provides less computation time and provides high security to the data. It has a key with the size of 256 × 256. Then finally affine transform has been applied to produce the final encrypted output. Thus the total complexity of the system is given as 2 × 256 × 2 × 256 × 8 × 32 × 8 × 8 × 22 × 256 × 2 × 2 × 10-4.
Performance analysis
This section illustrates the performance comparison of the proposed scheme with existing papers in the literature [8-13], and it is tabulated in Table 7. The correlation analysis in vertical, diagonal and horizontal coefficients, NPCR and UACI, were compared and estimated. From the estimated metrics, it is evident that the proposed scheme resist against statistical and differential attacks.
| Metrics | Proposed work | Ref. [8] | Ref. [9] | Ref. [10] | Ref. [11] | Ref. [12] | Ref. [13] |
|---|---|---|---|---|---|---|---|
| VC | -0.024 | -0.0385 | -0.0033 | 0.0018 | -0.0003 | 0.0056 | 0.0051 |
| HC | 0.0121 | -0.0519 | 0.0037 | 0.0037 | 0.0012 | 0.0132 | -0.0125 |
| DC | 0.0038 | 0.00046 | 0.0117 | -0.0017 | -0.0087 | -0.0006 | 0.00583 |
| NPCR | 99.595 | 99.996 | 99.62 | 99.61 | 99.602 | 99.6077 | 99.54 |
| UACI | 33.62 | 33.37 | 33.45 | 32.45 | 33.4682 | 33.4501 | 33.467 |
Table 7. Performance comparison of the proposed scheme.
From Table 7, it is clear that the correlation coefficients have better results than the existing methods [8,9,11,12]. NPCR values are comparable with [8-11] and have better results than [13]. UACI value shows good analysis than [8-11]. The computational complexity is estimated and found to be better than the existing systems.
Conclusion
The importance of protecting the biomedical data when it is transmitted through a public channel has become the limelight in the rural health care units. In this paper, CR networks were used to identify the unused spectrum; then quantum assisted encrypted biomedical images were transmitted and exchanged between authenticated users in healthcare units. Metrics like NPCR, UACI, correlation, entropies were estimated to prove the randomness of the proposed scheme.
Acknowledgements
Authors would like to express their sincere thanks to SASTRA University, for the financial support under R&M fund (R&M/ 0027/SEEE-010/2012-13) to carry out this research work. Also, we are grateful to Dr S. Vanoli, Medical Superintendent, Government Hospital, Ariyalur, for his valuable suggestions in carrying out this work.
References
- Wang X, Zhao Y, Zhang H, Guo K. A novel color image encryption scheme using alternate chaotic mapping structure. Opt Lasers Eng 2006; 82: 79-86.
- Subhasri P, Padmapriya A. Enhancing the security of dicom content using modified vigenere cipher. Int J Appl Eng Res 2015; 1951-1956.
- Panduranga HT, Naveen Kumar SK, Kiran. Image encryption based on permutation-substitution using chaotic map and Latin Square Image Cipher. Eur Phys J Spec Top 2014; 1663-1677.
- Panduranga HT, Naveen Kumar SK, Sharath Kumar HS. Hardware software co-simulation of the multiple image encryption technique using the xilinx system generator. J Info Proc Sys 2013; 499.
- Bhatnagar G, Wu QMJ. Enhancing the transmission security of biometric images using chaotic encryption. Multimed Sys 2014; 203-214.
- Padmapriya P, Nisha R, Thenmozhi K, John BBR, Rengarajan A. Image merger encryptor: a chaotic and Chebyshev key approach. Res J Info Technol 2016; 10-16.
- Zhenxing Q. Reversible data hiding in encrypted images with distributed source encoding, reversible data hiding in encrypted images with distributed source encoding. IEEE Trans Circ Sys Video Technol 2016.
- Dhivya R, Padmapriya P, John BBR, Rengarajan A. Chaos based crossover and mutation for securing DICOM image. Comp Biol Med 2016; 170-184.
- Praveenkumar P, Amirtharajan R, Thenmozhi K, Balaguru Rayappan JB. Medical data sheet in safe havens-a tri-layer cryptic solution. Comp Biol Med 2015; 264-276.
- Chen J, Zhu Z, Fu C, Zhang L, Zhang Y. An image encryption scheme using nonlinear inter-pixel computing and swapping based permutation approach. Commun Nonline Sci Numer Simul 2015; 294-310.
- Lima JB, Madeiro F, Sales FJR. Encryption of medical images based on the cosine number transform. Sig Proc Image Commun 2015; 1-8.
- Guoyan L, Abdurahman K, Hongjun L. Color pathological image encryption scheme with S-boxes generated by complex chaotic system and environmental noise. Neur Comp Appl 2015.
- Kanso A, Ghebleh M. An efficient and robust image encryption scheme for medical applications. Commun Nonline Sci Numer Simul 2015; 98-116.
- Kumar SKN, Kumar HSS, Panduranga HT. Hardware software co-simulation of dual image encryption using Latin square image. 4th International Conference on Computing, Communications and Networking Technologies 2013; 6726681.
- Musheer A, Faiyaz A. Cryptanalysis of image encryption based on permutation-substitution using chaotic map and Latin square image cipher. Proceedings of the 3rd International Conference on Frontiers of Intelligent Computing: Theory and Applications 2014; 481-488.
- Panduranga HT, Naveen Kumar SK, Kiran. Image encryption based on permutation-substitution using chaotic map and Latin square image cipher. Eur Phys J Spec Top 2014; 1663-1677.
- Chakravarthy S, Sharon V, Balasubramanian K, Vaithiyanathan V. Art of misdirection using AES, bi-layer steganography and novel King-Knights tour algorithm. Adv Intell Sys Comp 2016; 97-108.
- Delei J, Sen B, Wenming D. An image encryption algorithm based on knights tour and slip encryption-filter. Proc Int Conf Comp Sci Softw Eng 2008; 251-255.
- Yang YG, Pan QX, Sun SJ, Xu P. Novel image encryption based on quantum walks. Sci Rep 2015; 7784.
- Yang YG, Tian J, Lei H, Zhou YH, Shi WM. Novel quantum image encryption using one-dimensional quantum cellular automata. Info Sci 2016; 345: 257-270.
- Liang HR, Tao XY, Zhou NR. Quantum image encryption based on generalized affine transform and logistic map. Quant Info Proc 2016; 1-24.
- Gong LH, He XT, Cheng S, Hua TX, Zhou NR. Quantum image encryption algorithm based on quantum image XOR operations. Int J Theor Phys 2016; 1-17.
- Liang HR, Tao XY, Zhou NR. Quantum image encryption based on generalized affine transform and logistic map. Quant Info Proc 2016; 1-24.
- Zhang L, Yu J, Wu Z. Secured chaotic cognitive radio system using advanced encryption standard. IEEE IntSymp Personal Indoor Mob Radio Commun 2015; 7-11.
- Andreas G, Liza B, Benjamin TC, Le TD, Priscila H, Subha M, Tassew W, Aryeh DS, Jere RB. Growth trajectories from conception through middle childhood and cognitive achievement at age 8 years: Evidence from four low- and middle-income country. SSM Population Health 2016; 43-54.
- Mohandass S, Umamaheswari G. Biomedical signal transmission using of DM-based cognitive radio for wireless healthcare applications. Smart Comp Rev 2014.
- Qiaolin S, Nan W, Hua W, Weijie Y. Joint channel estimation and decoding in the presence of phase noise over time-selective flat-fading channels. IET Commun 2016; 577-585.
- Jin C, Choi JW, Kang WS, Yun S. Wi-Fi direct data transmission for wireless medical devices. The 18th IEEE International Symposium on Consumer Electronics (ISCE 2014) 2014; 1-2.
- Omre AH. Bluetooth low energy: wireless connectivity for medical monitoring. J Diab Sci Technol 2010; 457-463.
- Mulyadi IH, Supriyanto E, Safri NM, Satria MH. Wireless medical interface using Zigbee and bluetooth technology. Third Asia International Conference on Modelling and Simulation 2009; 276-281.
- Parsian A, Mehdi R, Noradin G. A hybrid neural network-gray wolf optimization algorithm for melanoma detection. Biomed Res 2017; 28.
- Ebrahimian H. Distributed diode single-balanced mixer using defected and protruded structures for Doppler radar applications. Appl Comp Electromagn Soc J 2015; 30.
- Gollou AR, Noradin G. A new feature selection and hybrid forecast engine for day-ahead price forecasting of electricity markets. J Intel Fuzzy Sys 2017; 1-15.
- Razmjooy N, Mehdi R, Noradin G. Imperialist competitive algorithm-based optimization of neuro-fuzzy system parameters for automatic red- eye removal. Int J Fuzzy Sys 2017; 1-13.
- Ghadimi N, Mohammad O. A novel design of low power rectenna for wireless sensor and RFID applications. Wireless Personal Commun 2014; 78.
- Jalili A, Noradin G. Hybrid harmony search algorithm and fuzzy mechanism for solving congestion management problem in an electricity market. Complexity 2016; 90-98.
