- Biomedical Research (2008) Volume 19, Issue 2
Quantification of Zonula Occludens-1 mRNA expression in cultu-red bovine retinal endothelial cells, using SYBR green real-time PCR
Sekaran Muniandya,*, Koon Chu Yaiwb, Jack Bee Chookb, Arokiasamy Vinscent Rayappanc, Kum Thong Wongb, Ikram Shah Ismailc, and Rajes Qvistc
aDepartment of Molecular Medicine Kuala Lumpur, Malaysia
bDepartment of Pathology Kuala Lumpur, Malaysia
cDepartment of Medicine Faculty of Medicine , University of Malaya, 50603, Kuala Lumpur, Malaysia
- *Corresponding Author:
- Sekaran Muniandy
Department of Molecular Medicine
Faculty of Medicine
University of Malaya
50603 Kuala Lumpur
Malaysia
Tel: 603-37967 4953
Fax: 603-37967 4957
E-mail: sekaran@um.edu.my
Accepted date : Aprl 17 2008
Abstract
A simple and rapid real-time reverse transcription-PCR (RT-PCR) technique using SYBR green fluorescence was developed to quantify Zonula Occludens-1 (ZO-1) mRNA expression in histamine-treated cultured bovine retinal microvessel endothelial cells. There was no dif-ference between the quantity of ZO-1 mRNA expression in histamine-treated (10-7M to 10-9 M) and untreated bovine retinal endothelial cells at high magnesium levels. Immunohisto-chemistry staining and western blot assay unequivocally demonstrated the approximately similar levels of ZO-1 protein in both histamine-treated and non-treated endothelial cells at high magnesium concentrations.
Keywords
Diabetes; Bovine retinal endothelial cells; Zonula Occludens-1; Real time reverse transcription polymerase chain reaction
Introduction
Zonula Occludens-1, a serine phosphorylated protein with approximately 225 kDa, is the main peripheral membrane protein associated with tight junctions [1]. There are two isoforms of ZO-1, namely, ZO-1 a+ and ZO-1 a- that differ by the presence or absence of an 80 amino acid region [2]. ZO-1 has been suggested to play a crucial role in the regulation of microvascular permeability and development of retinopathy in diabetic patients partly due to histamine and other conditions prevalent in diabetes [3, 4]. Since evidence suggests that high magnesium concentrations may be beneficial for endothelial function, we were particularly interested in ZO-1 expression by endothelial cells at high magnesium concentrations.
It this study we developed a simple and precise method to quantify ZO-1. Gardner et al used the western blot to quantify ZO-1 in histamine-treated bovine retinal capillary endothelial cells [3]. Takeuchi et al. used the conventional reverse transcriptase PCR to study the ZO-1 mRNA expression in histamine-treated cultured human nasal epithelial cells [5]. In the present study, we developed the real-time PCR method which is fast, accurate and sensitive to study the expression of ZO-1 at high concentrations of magnesium ions. To the best of our knowledge, this study is the first attempt to quantify the ZO-1 mRNA expression using realtime PCR.
Materials and Methods
Bovine Retinal Microvessel Endothelial Cells (BREC)
The BREC line was obtained from VEC Technologies (New York) and was cultured according to the protocol suggested by the manufacturers. Briefly, the cells were cultured in fibronectin (50 μg/ml)-coated flasks and was supplemented with MCDB-131 complete medium [6]. BREC from the 4th passage were used throughout our study. Confluent BREC were treated with different concentrations of histamine after tenfold dilutions of a stock solution of 0.1M (Sigma Chemical Company, St. Louis).
The above cells were incubated at 37°C for 5 hours with 5% CO2. The treated and untreated cells were then washed with PBS (0.15M) and scraped prior to the isolation of total RNA and immunohistochemical staining.
Total RNA and mRNA Isolation
Total RNA was isolated from the cells pellet using the High Pure RNA Isolation Kit (Roche Diagnostics, Mannheim) according to the instruction in the manual. In brief, washed cells were spun, resuspended in PBS and lysed with lysisbinding buffer. Cells were subsequently treated with DNase to remove contaminated genomic DNA and the RNA was eluted with the elution buffer. Quality and quantity of the extracted RNA were assessed by measuring A260/A280 ratio and the value at A260 nm, respectively. We did not use the RiboGreen assay to determine the concentration of the RNA since the extracted RNA was more than 100 ng/μl [7]. The ZO-1 mRNA isolation was performed using the Transcriptor First Strand cDNA Synthesis kit (Roche Diagnostics, Mannheim) according to the instruction manual. DNase treatment was performed to avoid the co-amplification of genomic
DNA. Random hexamers were used to isolate the mRNA since it primes throughout the whole length of all the RNAs and at the same time allows the reverse transcription of the RNAs that do not carry a poly (A) tail. A total of two microliter of cDNA were used for real-time RT-PCR throughout the study.
Real-Time Quantitative RT-PCR
We performed real-time quantitative RT-PCR in a LightCycler® 2.0 (Roche Diagnostics, Mannheim), using Failsafe Real-time PCR Capillary Premix Selection kit according to the instructions in the manual (EPICENTRE, Madison). Primers used for the PCR are listed in Table 1b. The primers were designed using the Primer 3 software [8] and FastPCR [9]. For the Primer 3 software, the default parameters of the program were applied, except for the following changes: Product size for ZO-1=200-250 bp; beta-actin and 18S rRNA =100-150 bp. Primer Tm=58-62°C with a max Tm difference of 2.0°C, max self and 3’ self complementary= 6.0 and max poly-X=3. For the FastPCR software, the highest efficiency ranking of the primers, particularly reverse primers were manually chosen for the same amplicon size as designed using Primer3 software. The amplicon lengths were kept be-tween 100-300 bp to ensure highest PCR efficiency [10] and reproducibility [11].
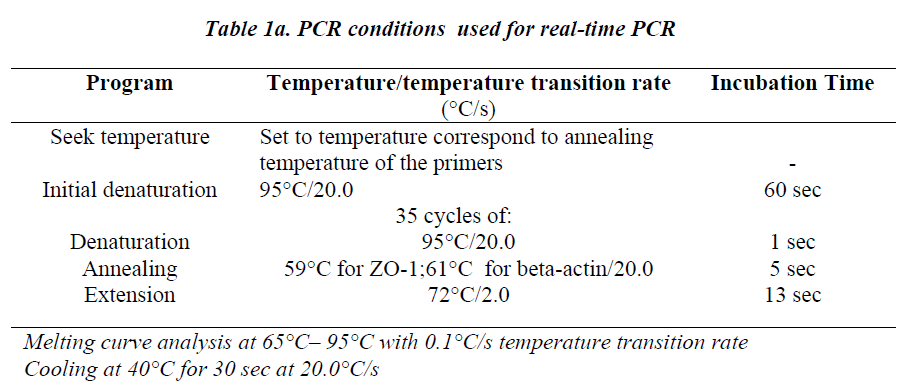
A preliminary run was performed to determine the optimal premix. The PCR reaction was carried out in a 20.0 μl final volume. The real-time PCR conditions were as follows;
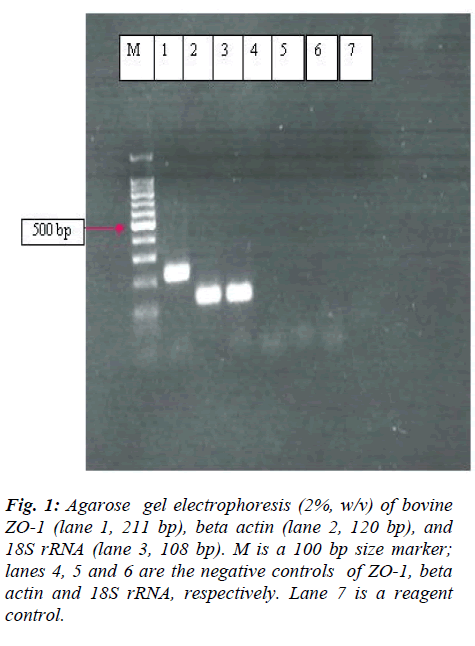
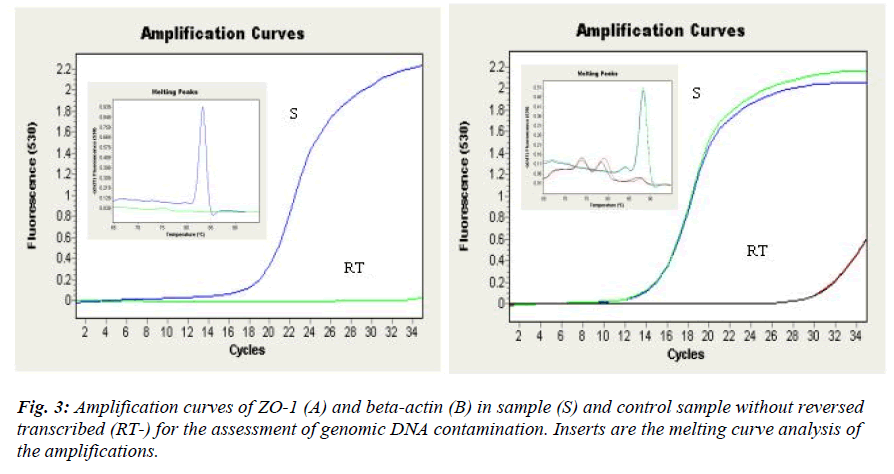
The size of the PCR product was confirmed by agarose gel electrophoresis (2% w/v). Melting curve analysis was performed at the end of each run to confirm the specificity of amplification [12]. The final concentrations of the primers used were 0.625 μM for ZO-1 and 0.3125 μM for beta-actin and 18SrRNA for both RT-PCR. RT- (samples containing RNA which was not reverse transcribed) was included to assess the amplification of contaminating genomic DNA [10].
The acquisition mode was single at the end of each extension and the measurement of the fluorescence was done at 530 nm.
Standard Curve Construction and Calculation
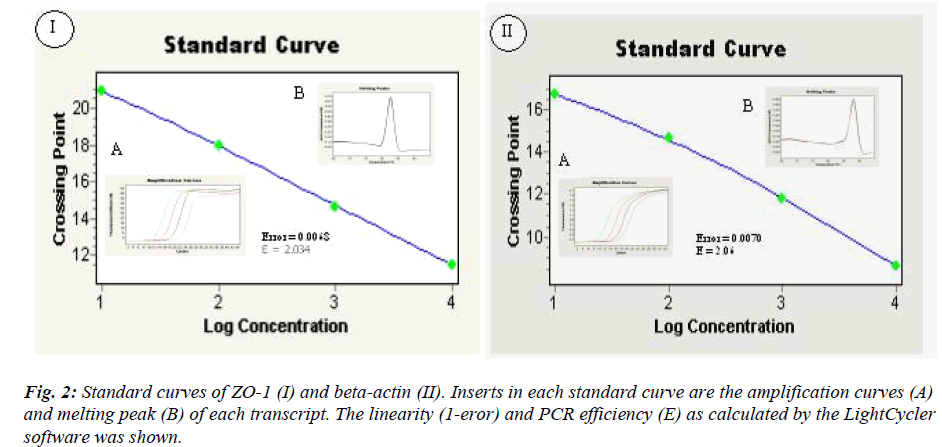
The amplified PCR products were purified using GENEALL PCR Purification Kit (General-Biosystem, Seoul) sequenced and confirmed its identity against the available sequences. A ten-fold serial dilutions of a purified DNA were used to construct a standard curve as previously described [13, 14]. The dilutions were made to cover the range of Cp (Cross-Point or Ct, threshold cycle at which the fluorescence rises appreciably above the background noise) that included the Cp of target mRNA in the experiment to maximize the accuracy [11]. The mRNA levels were expressed in relative copy numbers normalized against betaactin mRNA. The ΔΔCt was determined us-ing the method originally described by Stordeur [14]. The normalized ratio of ZO-1 in comparison to beta-actin was determined by the LightCycler software (Version 3.5).
ZO-1 Immunohistochemistry (IHC)
Scraped BREC cells were spun, washed with PBS and fixed in 10% buffered formalin for 3 days. The fixed cells were subsequently dehydrated with graded ethanols, cleared with xylene and embedded in paraffin. Five μm paraffin sections were cut and stained for ZO-1 protein by a standard Avidin-Biotin-peroxidase method. Prior to staining, the sections were treated with different concentrations of proteinase K at varying incubation times to determine the optimal conditions. The above method was compared with the heat-induced epitope retrieval method (microwave). The primary antibody was a rabbit poly-clonal anti-ZO-1 (Zymed, San Franscisco), which was used at a dilution of 1:100-1:200 (v/v) and incubated at 37°C for 2 hours or 4°C, 18 hours. This antibody is known to react with both isoforms of ZO-1. Biotinylated, swine anti-rabbit was used as secondary antibody. The immunohistochemistry reaction was developed with 3,3'-diaminobenzidine tetrahydrochloride (Sigma, St Louis) as chromogen. The sections were counterstained in Harris’s hematoxylin, dehydrated through graded ethanols and mounted in DPX (BDH, London). Negative controls were performed by replacing the primary antibody with PBS and by omitting the secondary antibody.
Results
Preparation of total RNA
Total RNA was prepared from the histamine-treated and untreated BREC. All the extracted RNA samples were quantified using a spectrophotometer. The mean concen-tration was 686.6 ± 140.0 μg/ml and the mean A260/A280 ratio was 1.84± 0.04 (mean ± SD).
Primer design and specificity
Primer for ZO-1, beta-actin and 18S rRNA was designed using Primer3 and FastPCR software, and analyzed with free primer analysis software, NetPrimer (www. premierbiosoft.com/ netprimer/netprlaunch/ netprlaunch). The ZO-1 primers designed by Primer3 gave better results than that by FastPCR. However, the primers for beta-actin designed by FastPCR produced less primer-dimers than that designed by Primer3. Primers for 18S rRNA were equally good using both software (unpublished observations).
The designed primers were blasted with nucleotide BLAST (blastn, NCBI) [15] which resulted in highest score (bits) and lowest E value, indicating specificity of the primers. The available bovine mRNA partial sequence of ZO-1 share 93% similarity with that of human and located upstream of the 240 bp spilicing region (motif-α) of the ZO-1 mRNA transcript (unpublished data). Hence, the designed ZO-1 primers were unable to differentiate both isoforms.
Ideally, the primers for the transcript should anneal with different exons or on an intron-exon junction to avoid the co-amplification of genomic DNA. Since the complete genome of the investigated transcripts was not available it was not possible to design such primers. DNase treatment was then performed, as recommended in the manual to prevent the genomic DNA contamination. The specificity of the PCR products was determined using gel electrophoresis, which resulted in a single product with the expected lengths (ZO-1, 211 bp; beta-actin, 120 bp and 18S rRNA, 108 bp) (figure 1). Melting curve analysis of the samples also resulted in a mean melting temperature, Tm = 82.73 ± 0.10 for ZO-1 and Tm = 88.31 ± 0.06 for betaactin (mean ± SD). In our study, 18S rRNA was highly expressed (Cp= ~ 4-5) and could not be determined by the LightCycler software. Since the histamine had no effect on the beta actin (see later), it was used for normalization while quantifying ZO-1 for the subsequent analysis.
Real-time PCR amplification efficiencies and linearity.
The PCR efficiency (E) of ZO-1 and beta-actin were 2.03 and 2.06, respectively with high Pearson correlation coefficient, R2 (1-error) = 0.993 for both transcripts as calculated by the LightCycler software Version 3.5( figure 2).
Real-time quantitative RT-PCR
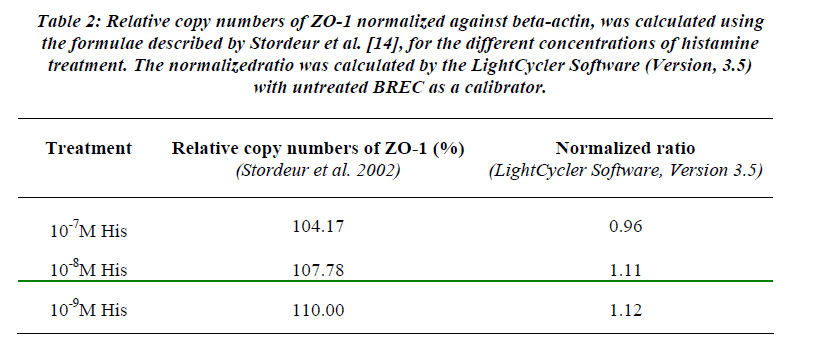
Table 2 showed the results obtained by real-time PCR. No change in ZO-1 mRNA expression was apparent since the fold of change (normalized ratio) was less than 2-folds. In order for the differences to be significant, at least two-fold changes in normalized ratio in mRNA expression (up-regulation) or 0.5 (down-regulation) must be taken into consideration [16].
Table 2: Relative copy numbers of ZO-1 normalized against beta-actin, was calculated using the formulae described by Stordeur et al. [14], for the different concentrations of histamine treatment. The normalizedratio was calculated by the LightCycler Software (Version, 3.5) with untreated BREC as a calibrator.
Validation with Housekeeping Gene
Housekeeping gene allows normalization by standardizing the differing amounts of RNA, variation in nucleic acid recovery, pipetting errors, RNA degradation, and variation in cDNA synthesis. Ideally, housekeeping gene should remain invariant throughout the biological treatment and should have the similar expression level as the investigated RNA. Increasing number of reports have shown the effect of various treatments on the housekeeping genes [11,18-20]. Therefore, the validation of house-keeping gene is crucial to the accuracy of data. In our study, beta-actin and 18SrRNA were chosen as the housekeeping genes and the effect of histamine on them were examined. There was no difference between the histamine-treated and in the untreated BREC since the cross point values between them were similar (Cp beta-actin = 13.64 ± 0.13, mean ± SD, n=5). It was not possible to calculate the Cp values of 18S rRNA by the software because of the high expression values (Cp~4-5). The Cp values were similar across the histamine treatment and in normal BREC, indicating no effect of histamine to the 18S rRNA expression (unpublished observations). For the subsequent studies, we used only beta-actin as housekeeping gene to normalize the ZO-1 since it is invariant throughout the histamine treatment and its Cp value was closer to ZO-1.
Immunohistochemistry of ZO-1 Protein
In order to determine the correlation between the ZO-1 mRNA expression and ZO-1 protein levels, we performed the immunohistochemical staining of ZO-1 protein in the paraffin sections. ZO-1 immunoperoxidase staining was treated with different concentrations of Proteinase K at varying incubation times to obtain maximum staining. We also microwaved the slides at a high temperature at different times and compared the staining with that of Proteinase K. A combination of microwave and Proteinase k were used in another set of slides. The optimal staining was obtained by Proteinase K treatment at 3 μg/ml (final concentration) for 15 minute at 37°C. Incubation step of ZO-1 primary antibody (dilution 1:100-1:200 v/v) either at 4°C for 18 hours or at 37°C for 2 hours gave the same results. Combination of Microwave followed by Proteinase K had no advantages (unpublished data). The ZO-1 immunoreactivity was mainly seen in apical and apicolateral of the membrane of fibroblast-like BREC cells, in the cytoplasm and occasionally in the nucleus (arrows in figure 3). The latter was seen exclusively at the freeedge of an island of cells and in the proximity of apoptotic-like bodies. The same nuclear accumulation of ZO-1 has been described by Gottardi et al. [21]. Interestingly, the fragmented nuclei of the apoptotic-like bodies also showed the immunoreactivity of ZO-1 (insert, figure 4 C). The significant of this finding is unknown. It is crucial that the cell density is high to obtain optimal staining and also to be aware that the staining could be different because of the different levels of exposure to the antigen. It was difficult to quantitate the staining since staining was not confined to one cell, and because the pattern of staining could be in diffused-type due to different planar sectioning. Although there could be some differences in BREC treated with different concentrations of histamine, nevertheless, no apparent difference was noted between normal and histamine-treated BREC in term of staining intensity and area of positivity at the concentra-tion of magnesium used (Figure 4).
Figure 1: Immunohistochemistry staining of ZO-1 in (A)normal, (B)histamine-treated at 10-7M, in (C)histamine-treated bovine retinal microvessel endothelial cells. (C)Occasionally nuclear localiza- tion of ZO-1 could be seen, especially at the free edge of cells (arrows) and in the proximity of apoptotic-like cells (arrowhead). Insert showed the higher magnification. No immunoreactivity of ZO-1 was seen in control negative (D).
Discussion
In the present study, we developed a real-time RT-PCR method to study the ZO-1 mRNA expression in hista-mine-treated bovine retinal microvascular endothelial cells. Quantification of ZO-1 mRNA expression by conventional reverse transcriptase PCR has been described by Takeuchi et al. [5]. However, the real-time approach offers several advantages to study the gene expression comp-ared to the conventional reverse transcriptase PCR. The method is simple, fast and does not require post-PCR manipulation.
To validate the results from real-time quantitative RT-PCR, we did an immunohistochemical staining on the cultured cells. The ZO-1 protein levels were the same for the different concentrations of histamine, indicating neither up-regulation nor down-regulation of ZO-1 mRNA expression. Some reports suggested that the protein levels correlated with the mRNA expression, while others were unable to prove the correlation [22-24]. In our study the results obtained from the immunohistochemical staining were in good agreement with that of mRNA expression. Gardner et al. developed an in vitro system with retinal microvascular endothelial cells that mimicked the human environment of the eye [3]. They used standard Modified Eagle’s medium that contained 0.07mM of magnesium. Takeuchi et al. used 0.7 mM Mg2+ in their study [5]. In our study, however, we used the complete medium MCDB-131 which contains 10mM magnesium [6]. The concentration of magnesium in our medium was more than that used by Gardner et al. and Takeuchi et al [5]. Magnesium has been reported to attenuate histamine-induced bronchoconstriction in asthmatic patients [25]. Magnesium is also known to be a natural suppressor of histamine action. We have demonstrated that at high magnesium concentrations histamine has little effect on the expression of ZO-1.
In conclusion, we have developed a simple and fast quan-titative realtime RT-PCR for ZO-1 mRNA quantification. This technique should be of particular interest for those quantifying the ZO-1 mRNA and could provide an insight into the role of ZO-1 in the regulation of microvascular permeability.
References
- Stevenson B, Siliciano JD, Mooseker JD, Goodenough DA. Identification of ZO-1: A High Molecular Weight Polypeptide Associated with the Tight Junction (Zonula Occludens) in a Variety of Epithelia. Journal of Cell Biology 1986; 103: 755-766.
- Willott E, Balda MS, Heintzelman M, Jameson B, Anderson, JM. Localization and Differential Expression of Two Isoforms of the Tight Junction Protein ZO-1. Am J Physiol Cell Physiol 1992; 262: C1119-C1124.
- Gardner T, Lesher T, Khin S, Vu C, Barber AJ, Brennan WA. Histamine Reduces ZO-1 Tight Junction Protein Expression in Cultured Retinal Microvascular Endothelial Cells. Biochem J 1996; 320: 717-721.
- Schneeberger E, Lynch RD. The Tight Junction: A Multifunctional Complex. Am J Physiol Cell Physiol 2004; 286: C1213-C1228.
- Takeuchi K, Kishioka C, Ishinaga H, Sakakura Y, Majima Y., Histamine Alters Gene Expression in Cultured Human Nasal Epithelial Cells. J Allergy Clin Immunol 2001; 107: 310-314.
- Knedler A, Ham RG. Optimized Medium for Clonal Growth of Human Microvascular Endothelial Cells with Minimal Serum. In Vitro Cell Dev Biol 1987; 23: 481-491.
- Bustin S. Quantification of mRNA using RealTime Reverse Transcription PCR (RT-PCR): Trends and Problems. Journal of Molecular Endocrinology 2002; 29: 23-39.
- Rozen S Skaletsky HJ., Primer3 on the WWW for General Users and for Biologist Programmers. Bioinformatics Methods and Protocols: Methods in Molecular Biology, ed. S. Krawetz and M. S. 2000, Totowa, NJ: Humana Press. 365-386.
- Kalendar R. FastPCR, PCR Primer Design, DNA and Protein Tools, Repeats and Own Database Searches Program. www.biocenter.helsinki.fi/bi/bare-1_html/-fastpcr.htm, 2004.
- Overbergh L, Valckx D, Waer M, Mathieu C. Quantification of Murine Cytokine mRNA using RealTime Quantitative Reverse Transcriptase PCR. Cytokine 1999; 11: 305-312.
- Bustin S. Absolute Quantification of mRNA using RealTime Reverse Transcription Polymerase Chain Reaction Assays. Journal of Molecular Endocrinology 2000; 25: 169-193.
- Ririe K, Rasmussen RP, Wittwer, CT. Product Differentiation by Analysis of DNA Melting Curves During the Polymerase Chain Reaction. Anal. Biochem 1997; 245: 154-160.
- Gentle A, Anastasopoulos F McBrien NA. High-Resolution Semi-Quantitative Real-Time PCR without the use of a Standard Curve. BioTechniques 2001; 31: 502-508.
- Stordeur P, Poulin LF, Cracium L, Zhou L, Schandene L, Lavareille AD, Goriely, S Goldman, M. Cytokine mRNA Quantification by Real-Time PCR. Journal of Immunological Methods 2002; 259: 55-64.
- Altschul S, Gish W, Miller W, Myers EW, Lipman DJ. Basic Local Alignment Search Tool. J Mol Biol 1990; 215: 403-410.
- Ball, C. An Introduction to Microarray Bioinformatics. DNA Microarray, ed. D. Bowtell. 2003, Cold Spring Harbor, New York: Cold Spring Harbor Laboratory Press.
- Winer J, Jung CKS, Shackel I, Williams PM. Development and Validation of Real-Time Quantitative Reverse Transcriptase-Polymerase Chain Reaction for Monitoring Gene Expression in Cardiac Myocytes in vitro. Analytical Biochemistry 1999; 270: 41-49.
- Spanakis E. Problems Related to the Interpretation of Autoradiographic Data on Gene Expression Using Common Constitutive Transcripts as Controls. Nucleic Acids Research 1993: 21: 3809-3819.
- Krussel J. Huang HY, Simon C, Behr B, Pape AR, Wen Y, Bielfeld P Polan, ML. Single Blastomeres within Human Preimplantation Embryos Express different Amounts of Messenger Ribonucleic Acid for Beta-Actin and Interleukin-1 Receptor Type I. Journal of Clinical Endocrinology and Metabolism 1998; 83: 953-959.
- Schmittgen T Zakrajsek BA. Effect of Experimental Treatment on Housekeeping Gene Expression: Validation by Real-Time, Quantitative RT-PCR. J Biochem Biophys Methods 2000; 46: 69-81.
- Gottardi C, Arpin M, Fanning AS Louvard D. The Junction-Associated Protein, Zonula Occludens-1, Localizes to the Nucleus before the Maturation and during the Remodeling of Cell-Cell Contacts. Proc Natl Acad Sci USA 1996; 93: 10779-10784.
- Anderson L Seilhamer J. A Comparison of Selected mRNA and Protein Abundances in Human Liver. Electrophoresis 1997; 18: 533-537.
- Orntoft T, Thykjaer T, Waldman FM, Wolf H Celis JE. Genome Widestudy of Gene Copy Numbers, Transcripts, and Protein Levels in Pairs of Non-Invasive and Invasive Human Transitional Cell Carcinomas. Mol Cell Proteomics 2002; 1: 37-45.
- Lichtinghagen R, Musholt PB, Lein M, Romer A, Rudolph B, Kristiansen G, Hauptmann S, Schnorr D, Loening SA Jung, K. Different mRNA and protein expression of matrix metalloproteinases 2 and 9 and tissue inhibitor of metalloproteinases 1 inbenign and malignant prostate tissue. Eur Urol 2002; 42: 398-406.
- Rolla G, Buccs C, Bugiuni M, Arrossa W Spinacis S. Reduction of Histamine-Induced Bronchoconstriction by Magnesium in Asthmatic Subjects. Allergy 1987; 42: 186-188.
