The measurement of image quality plays an important role in all acquisition systems. In many medical applications, such as in the presented Near Infrared (NIR) imaging of the finger vascular system, there is no possibility of comparing the system outcomes with a reference data set. As a solution for this problem, a range of available methods have been presented, which try to reflect or imitate subjective human operator assessment. In this paper, we present a review of such quality metrics and introduce a novel approach based on distance transformations. The proposed method was compared with the state-of-the-art metrics on NIR vascular system images obtained by our constructed acquisition device. By changing the intensity of the finger backlight and by examining intentionally blurred images, we proved that our approach was capable of providing most sensible quality outcomes, while the others turned out to be much less reliable. The proposed evaluation technique may also be employed in any other medical application, where the assessment of the image quality has a direct impact on the final diagnosis.
Keywords |
| Biomedical image processing, Finger vascular system, Image quality, Image enhancement. |
Introduction |
| Finger vascular recognition has been met with growing interest
in the last few years. The available devices for biometric
sample acquisition (research prototypes as well as commercial
solutions) are based on lighting the finger by light-emitting
near-infrared diodes (NIR-LED) and capturing images
depicting the vein and artery structures. These structures are
subcutaneous, thus they cannot be observed by the naked eye. |
| Recently, several research centers worldwide have proposed
diverse investigations to use finger vascular patterns for
biometric recognition [1-9]. The first suggestion to use the
blood vessel network as a biometric characteristic was made
more than a decade ago [10] since then, a large number of
different techniques for finger vein image acquisition and its
preprocessing for the purpose of quality enhancement have
been developed. In contrast to the other human identification
methods, which involve face characteristics or fingerprints, the
NIR vascular system recognition is more robust against
spoofing because it requires the subject to both be alive and
give permission. |
| Finger vascular imaging is also used in an increasing number
of new medical applications and is an alternative method to
widespread imagery techniques, such as thermography,
Doppler laser [11], plethysmography [12] or capillaroscopy
[13]. NIR imaging methods do not require ionizing radiation
and have great potential for, e.g., diagnosis of articular
cartilage pathology [14] or breast cancer diagnosis [15]. In
contrast to X-ray techniques, it is not harmful to living tissues,
thus it may be employed with no danger to the patients. |
| The main requirement for the correctness of recognition or the
accuracy of the medical diagnosis is the highest possible
quality of the images. To make the imaging system efficient
and reliable, several hardware parameters, such as the
backlight intensity or the exposure time, have to be optimized
in the initial stage of the acquisition process. The image quality
metrics are the main coefficients that control these
optimization procedures. |
| In this paper, we compare several image quality evaluation
methods, and we also present a novel approach based on
distance transformations. Our algorithm allows for the selection of optimal exposure parameters, thus the amount of
information included in a given image is maximized. We also
present the usability of NIR imaging for a biometric
acquisition system. For such an application, the image
enhancement leads to improvement in the identification.
However, it should not be forgotten that the presented
technique is also usable for all NIR-based imaging techniques,
where there is no possibility of obtain the reference frame for
the quality assessment. |
| The paper is organized as follows. In Section 2, we present and
describe the biometric authentication system with the image
assessment employed. Next, in Sections 3 through 5, we
enumerate and provide the basics of the state-of-the-art image
quality metrics. In Section 6, our novel approach is introduced.
Finally, we present the details of our experiments in Section 7,
and we discuss the results in Section 8. |
Biometric authentication with image quality
evaluation |
| In the human body, veins and arteries have different
thicknesses and sizes. It is well-known that various tissues of a
finger are characterized by different absorption coefficients
[16]. This phenomenon can lead to the loss of information
regarding the vascular structure due to over- or under-exposure
in some parts of an acquired NIR finger image. In most
practical applications, the range of possible image grayscale
values are stored in an 8-bit dynamic range (0~255). Therefore,
the values outside this range cause a loss of quality, which can
be recovered by reducing the intensity level of the LED-matrix
brightness or decreasing the exposure time. Therefore, the
acquisition system should assess the camera “snapshots” and
register only those images that are not saturated. |
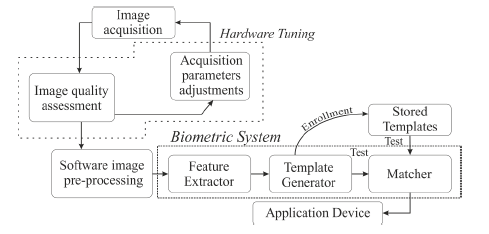
| A block diagram of the biometric authentication system is
presented in Figure 1. The acquisition process focuses on the
hardware issues, wherein the system optimizes the exposure
parameters to reach the highest image quality. Adjustment of
the acquisition system parameters (Hardware Tuning) can be
performed by modifying the backlight intensity, zooming,
autofocusing, filtering by employing different optical pass
filters, stabilizing the camera, etc. The mentioned techniques
aim for the improvement of the image quality before storing
the frames. Depending on the system design, the parameters
may be tuned automatically or manually. The process is
performed iteratively in a feedback loop, wherein the quality of the obtained images is estimated in real-time therefore, the
selection of a proper quality metric is crucial for the overall
efficiency of the biometric authentication system. |
| The second part of the presented system, the software image
pre-processing, includes the algorithms that highlight all the
desirable image content to be further investigated during the
feature extraction. In this stage, the image adjustment is based
on reshaping the histograms, scaling, sharpening, removing the
noise, applying morphological operations, etc. |
Double-indicator image quality evaluation method |
| The quality estimation system, presented in [17], combines
information provided by two statistical descriptors, mean and
variance, which allows for the calculation of the evaluation
score, called the double-indicator. The first descriptor, the
mean intensity, reflects the overall image brightness, while the
second one, the variance of the intensity, corresponds to the
distribution of pixel values and may also be utilized as an
indirect measure of image contrast. The descriptors are given
by the following formulas: |
 |
| where I(x, y) is the intensity of the pixel at position (x, y) and
X and Y stand, respectively for the image width and height. |
| The quality evaluation score of an image, the double-indicator
(D), is defined as follows: |
 |
| where μmin and μmax are the minimum and maximum gray
mean of each image line and σ2 and σ2max are the minimum
and maximum gray variance of each image line. In this paper,
it is assumed that the weights q1 and q2 have the same value,
0.5. |
| The variance itself also provides information about the image
contrast. Therefore, in some applications, the double-indicator
is reduced only to the square root of its second component. In
such a case, the standard deviation (σ) of the pixel intensities is
maximized to obtain the optimal image quality. |
 |
Maximization of image entropy |
| Another method of quality evaluation calculates entropy to
investigate the average amount of information included in each
image pixel [18]. It considers the image as an experiment,
where the pixels intensities are the states with given
probabilities. Assuming that pixels values are variables that
may receive values from k=1,2,…,K, the image entropy is
given by: |
 |
| where p(k) is the probability of the appearance of intensity k. |
| The presented method was utilized for the assessment of NIR
images in [19]. By modifying the intensity of the LED matrix
emission, the authors optimized the acquisition parameters to
reach the highest entropy of the obtained NIR vascular images.
The experiments proved the usability of the employed
evaluation approach, and their closed-loop system showed
good stability and fine convergence. |
Co-occurrence matrix and image descriptors |
| The co-occurrence-based method takes into account the
information of pixels’ spatial distribution. The co-occurrence
matrix is a square K × K matrix, where K is the maximal value
of pixel intensity (e.g., for an 8-bit image, K=256). Each (m, n)
element of the co-occurrence matrix defines how many times a
pixel with intensity level m appears with a neighboring pixel of
intensity n. |
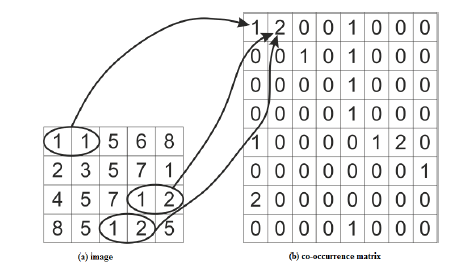
| Figure 2 depicts the basics of filling the co-occurrence matrix.
For example, the element of the co-occurrence matrix at (1,1)
is set as 1 because there exists only one occurrence of
neighboring 1-1 values in the image matrix. Similarly, the
element at (1,2) is 2 due to the presence of two 1-2 pairs in the
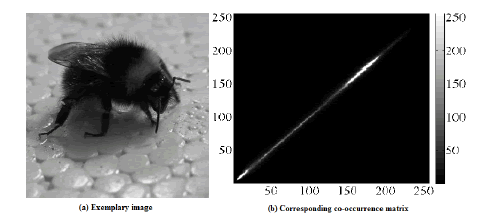
image. An exemplary co-occurrence matrix calculated for a
complex grayscale image is given in figure 3. It should be
noted that the values on the diagonal of the co-occurrence
matrix correspond to smooth parts of the image, while the further from the diagonal, the higher the intensity gradients
become. |
| After normalization, the elements of the co-occurrence matrix
wmn can be interpreted as the probabilities of transitions
between the intensity levels in the image. For an image of X ×
Y size, the normalized elements of the co-occurrence matrix
are calculated as follows: |
 |
| where w’mn is the element at (m, n) in the co-occurrence
matrix, and wmn is the corresponding element after
normalization. |
| The co-occurrence matrix contains a large amount of
information regarding the image characteristics. The quality
measurement of vascular patterns, which uses global and local
features computed based on a Gray Level Co-Occurrence
Matrix, can be found in [20]. In our comparison study, we
utilized the following coefficients specified in [21]: the
uniformity of energy (also called the energy) (7), the contrast
(8), the correlation (9) and the homogeneity (10). |
| Image characteristics designated based on the normalized cooccurrence
matrix: |
| Uniformity of energy |
 |
| Contrast |
 |
| Correlation |
 |
| where: |
 and Homogeneity (10)Distance
transformation-based image quality and Homogeneity (10)Distance
transformation-based image quality |
| Distance transformations were originally introduced by
Rosenfeld and Pfaltz [22], for the quick estimation of metric
distance between the indicated image object and the other
pixels. The distances are calculated with a use of the so-called
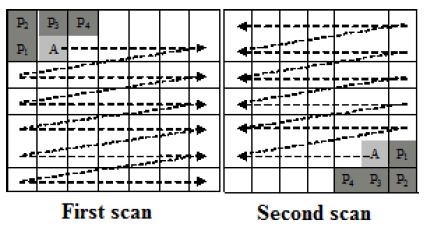
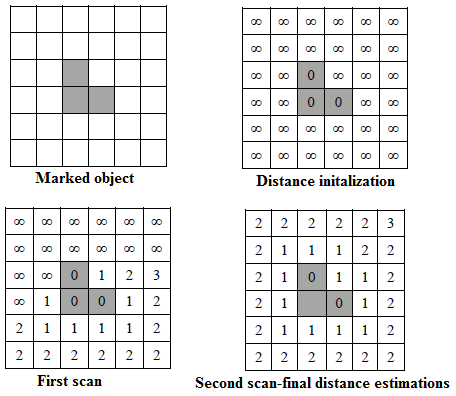
double-scan algorithm and stored in a distance matrix. Initially,
all the pixels except for the object pixels are assigned an
infinite distance (Figure 5b). Then, a local mask slides over the
distance map twice: from left to right, top to bottom, and then
again from right to left, bottom to top. This double-scan
process is visualized in figure 4. At each step during the
sliding, very simple replacement operations are performed
within the mask (Figure 4, gray): |
| dA=min {dpi+1, dA} (11) |
| where dA and dPi are the distance values at the mask pixels A
and Pi, respectively, and min{} denotes the minimum value.
An example of applying the distance transformations to
estimate the distances from a simple 3-pixel object is presented
in figure 5 note that, after the first scan, only a subset of pixels
receive their distances (Figure 5c). Eventually, after the second
scan, the entire distance matrix is populated with the distance
estimations (Figure 5d). |
| To obtain the quality of a given image, we utilized the idea of
distance transformations with a simple extension. Such an
approach was also introduced for colorization purposes in
[23-25]. Instead of analyzing the metric distances between
neighboring pixels, we focus on the intensity differences.
Hence, Equation-(11) in our method is modified in the
following way: |
| dA=min{|IA-IPi|, dA} (12) |
| where IA and IPi are the intensities of the pixels A and Pi,
respectively, and | · | denotes the absolute value. Therefore, the
resulting distance matrix reflects the magnitude of intensity
gradients encountered between pixels, so it also measures the
number of structure fluctuations visible in the image. Hence, we assumed that this method may be successfully employed as
the image quality measure. |
| The most valuable information retrieved from the NIR images
of the finger vascular system is located in the darker parts
associated with the presence of veins and arteries. Therefore, to
make the algorithm better suited for our NIR exposures and to
make it sensitive to visibly darker objects in the image, we
decided to extend Equation-(12), so that we include only the
intensity growth in the distance measure: |
| dA=min{α. |IA-IPi|, dA} (13) |
| where α is our distance trigger, defined as follows: |
| α=1 if IA-IPi <0, otherwise α=0 (14) |
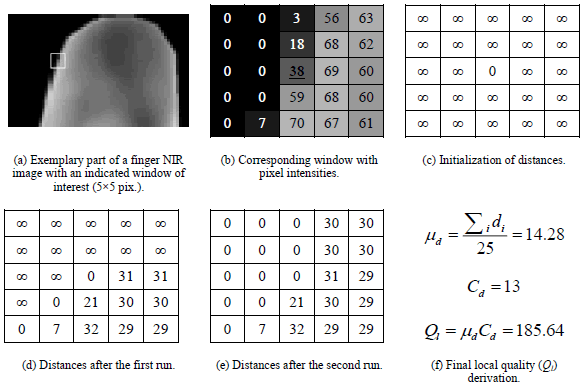
| To obtain the quality of an image, we first calculate the socalled
local quality in each image pixel. To do so, we analyze
the pixel’s N × N neighborhood window employing our
extended distance transformation. The pixels intensity
distances (di) determined from the window’s central pixel
allow for the calculation of the mean distance (μd), and the
number of pixels with positive distance (Cd). These two
coefficients represent, respectively, the qualitative and the
quantitative estimations of pixel degree of the membership to
the vascular system (i.e., the larger the Cd or μd, the more
probable it is that the pixel depicts a part of the vein). The
multiplication of the coefficients yields the local quality
measure (Ql). The process of retrieval of local quality at an
exemplary pixel is presented in figure 6. In figure 6f, we show
the formulas and the results of the calculation of the mean
distance (μd), the number of pixels with positive distance (Cd)
and the final local quality measure (Ql). |
| That process is performed for each image pixel, such that we
obtain a local quality map that highlights the most informative
parts of the image. Then, the mean of the Ql values over the
entire image matrix is selected as our overall quality measure
(Q). |
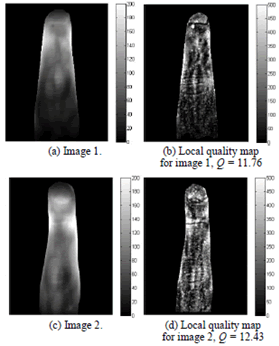
| Examples of local quality maps for two NIR images are
depicted in figures 7b and 7d. The overall quality results Q are
also provided. |
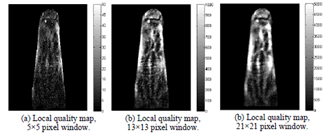
| The size of the window utilized in the local quality estimation
should be chosen properly with respect to a given object of
interest. While small windows focus on fine details, larger ones
are better suited to extended structures. As a rule of thumb, one
should choose a window at least as large as the smallest size of
observed objects (e.g., for veins, it should be their width).
Several examples of local quality maps obtained with different
mask sizes are depicted in Figure 8. |
Experiments |
| To perform all required experiments, we have constructed a
dedicated laboratory device that utilizes the infrared light
transmission through the finger. We employed a CCD camera,
which stored the results in a secured database. The utilized
light source consisted of a self-constructed LED matrix to
provide uniform and adjustable illumination [26]. |
| In the first experiment, a set of NIR finger images for 20 levels
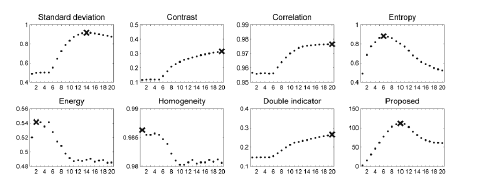
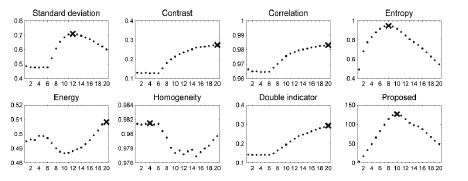
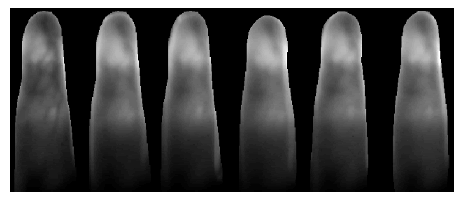
of backlight intensities were collected from two volunteers. In figure 9 and figure 11, every second image from the entire series (20 measurements) is depicted. In figure 10 and figure 12, we present the results of the quality measurement using the
seven described estimators and provide the outcomes of our
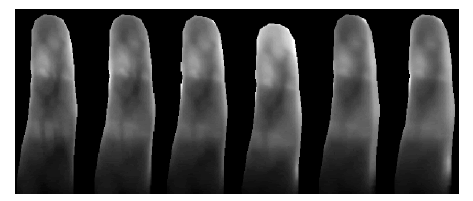
proposed method. The second experiment exposed the results
of quality coefficients for frames with an added blurring effect
obtained by intentional finger motion during the exposure
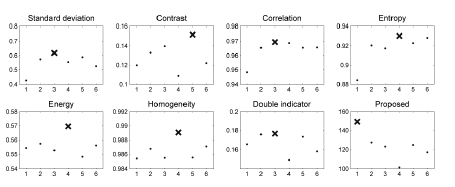
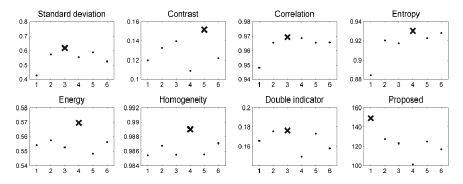
(Figure 13 and Figure 15). Only one of the 6 included images
was not affected by the blurring, and it was positioned as the
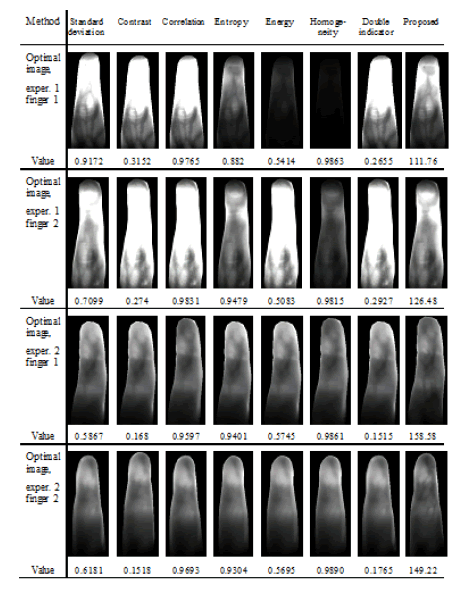
first from the left. In figure 18, we present a summary of our
experiments, wherein, for each metric, we present the image
indicated as that with the highest quality. |
| The optimal exposures, as selected using different estimators,
showed an unexpected variety. In the first experiment, most of
the methods indicated strongly saturated images as the sharpest
frames. On the opposite side, the homogeneity maximal value
was achieved for nearly black frames, wherein no finger details
could be spotted. Only the entropy seemed to make reasonable
image selection decisions. However, the results of our method
showed definitely the best compromise between saturation and
underexposure. |
| It is also worthwhile to compare the sensitivity of the quality
measures by the assessment of the dynamic range of the
optimization curves. For the proposed technique such a curve
starts from Q=0 and peaks at approximately Q=120 (Figure 10 and Figure 12), while, e.g., for the entropy, the curve is within
the 0.48~0.54 range. The dynamic range is a significant factor in the hardware tuning loop (Figure 1) because it improves the
convergence process of the exposure parameter optimization. |
| In the experiment with 6 images, within which only one was
not blurred, all the methods except for the proposed one
indicated the wrong frames (Figure 14 and Figure 16). Even
the entropy, which provided sensible outcomes in the previous
experiment, was not able to recognize the optimal, sharp
exposure. Such results disqualify the well-known methods as
indicators of image selection in a practical implementation of a
finger NIR acquisition system. Again, only our method made
the correct selection. |
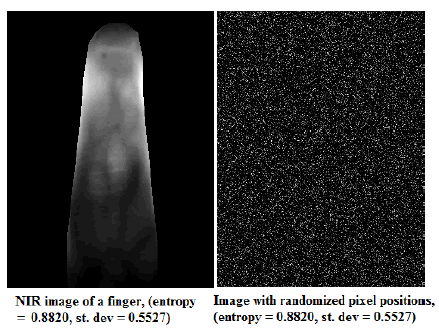
| The entropy and standard deviation, which provided reasonable
quality estimations in the experiment 1, need however some
more comments. They both are not dependent upon the spatial
distribution of pixels within the image. |
| As an example, in figure 15 and figure 17, we show the
randomization of pixel positions (the pixels were reshuffled),
which entirely converts the imaging scene, while the calculated
metrics remain unchanged. |
| It is a significant drawback of these methods, as they may not
be employed simultaneously for a wide variety of observed
objects and are usually useless for the assessment of images
affected by any type of noise. |
| Summarizing, the presented algorithm appeared to be the most
reliable when compare with many, widely spread, image
quality measures. |
| It proved its superiority in the NIR finger vein image
processing pipeline, where used as the indicator of the optimal
exposure time and the estimator of image sharpness. |
Conclusion |
| The quality of captured images is an important premise for a
variety of applications. In this paper, we emphasized the
importance of the quality estimation of NIR finger images in
the hardware tuning process, wherein the image assessment
plays a crucial role during the adjustment of exposure
parameters. We presented a review of known methods and
introduced a novel technique of image quality evaluation. The
statistical-based (entropy, standard deviation, double indicator)
and the co-occurrence-based (contrast, correlation,
homogeneity, energy) methods were compared with the
proposed distance transformation approach. The results of the
experiments with blurred and with over- or underexposed
frames indicated that all of the state-of-the-art methods are
inefficient when employed on NIR finger vascular system
images. Only the proposed method proved to be capable of
providing reasonable results and was able to recognize the
images that were not blurred by the intentional finger motion.
Additionally, a wide dynamic range of the proposed quality
coefficient is an important aspect, which should improve the
convergence of the hardware tuning loop. The proposed
method may be utilized in the assessment of any type of premedical
diagnostic images, such as in thermography,
plethysmography or capillaroscopy. Additionally, due to its ability to indicate the regions of interest, the method may be
successfully applied in various image segmentation tasks. This
will be the main aim of our studies in the immediate future. |
Acknowledgment |
| Michał Waluś is a DoktoRIS holder for the scholarship
program for innovative Silesia. This project was co-financed
by the European Union under the European Social Fund. Adam
Popowicz was supported by the Polish National Science
Center, grant no. 2013/11/N/ST6/03051: Novel Methods of
Impulsive Noise Reduction in Astronomical Images. The
calculations were carried out using IT infrastructure funded by
the GeCONiI project (POIG.02.03.01-24-099/13). This work
was supported by the Ministry of Science and Higher
Education funding for statutory activities (BK/227/
RAU-1/2015/10). |
Tables at a glance |
 |
 |
 |
 |
 |
| Figure 1 |
Figure 2 |
Figure 3 |
Figure 4 |
Figure 5 |
|
 |
 |
 |
 |
 |
| Figure 6 |
Figure 7 |
Figure 8 |
Figure 9 |
Figure 10 |
|
 |
 |
 |
 |
 |
| Figure 11 |
Figure 12 |
Figure 13 |
Figure 14 |
Figure 15 |
|
 |
 |
 |
| Figure 16 |
Figure 17 |
Figure 18 |
|
References |
- Miura N, Yoichi S. Computer Vision–ACCV 2012: In: Deblurring vein images and removing skin wrinkle patterns by using tri-band illumination. Springer, Berlin Heidelberg 2013; 336-349.
- Yang J, Jia Y. A method of multispectral finger-vein image fusion. Signal Processing (ICSP), 2012 IEEE 11th International Conference on, Beijing, 2012, pp. 753-756.
- Ton BT, Veldhuis RN. A high quality finger vascular pattern dataset collected using a custom designed capturing device. 2013 International Conference on Biometrics (ICB), Madrid, 1-5.
- Kato T, Kondo M, Hattori K, Taguchi R, Hoguro M, Umezaki T. Development of penetrate and reflection type finger vein certification. 2012 International Symposium on Micro-Nano Mechatronics and Human Science (MHS), Nagoya , 501-506.
- Yang J, Jia Y. A method of multispectral finger-vein image fusion. IEEE Conference on International Conference on Signal Processing (ICSP), Beijing, 753-756.
- Wang L, Leedham G, Siu-Yeung DC. Minutiae feature analysis for infrared hand vein pattern Biometrics. Pattern Recog 2008; 41: 920-929.
- Pascual JE, Uriarte-Antonio J, Sanchez-Reillo R, Lorenz MG. Capturing hand or wrist vein images for biometric authentication using low-cost devices. 2010 Sixth International onference on Intelligent Information Hiding and Multimedia Signal Processing (IIH-MSP), Darmstadt, 318-322.
- Hartung D, Busch C. BiometrischeFingererkennung-FusionvonFingerabdruck,FingervenenundFingergelenkbild. German IT Security Congress of BSI: Safe in the digital world of tomorrow, German, pp. 1-21.
- Kumar A, Zhou Y. Human identification using finger images. IEEE Trans Image Process 2012; 21: 228-2244.
- Miura N, Nagasaka A, Miyatake T. Automatic feature extraction from non-uniform finger vein image and its applications on personal identification. 2002 Workshop on Machine Vision Applications (MVA), Japan, 253-256.
- Leutenegger M, Martin-Williams E, Harbi P, Thacher T, Raffoul W. Real-time full field laser Doppler imaging. Biomed Optics Exp 2011; 2: 1470-1477.
- Aliverti A, Pedotii A. Optoelectronic Plethysmography: Principles of Measurements and Recent Use in Respiratory Medicine. Springer Milan 2014; 149-168.
- Gurfinkel Y, Ovsyannickov KV, Ametov AS, Strokov IA. Early diagnostics of diabetes mellitus using noninvasive imaging by computer capillaroscopy. Biomedical Topical Meeting, Florida.
- Afara IO, Moody H, Singh S, Prasadam I, Oloyede A. Spatial mapping of proteoglycan content in articular cartilage using near-infrared (NIR) spectroscopy. Biomed Optics Exp 2015; 6: 144-154.
- Li X, Heldermon C, Marshall J, Yao L, Jiang H. Functional photoacoustic tomography of breast cancer: Pilot clinical results. Biomed Optics Exp, 2014.
- http://omlc.org/spectra/hemoglobin/
- Zhao Y, Ming-Yu S. Application and analysis on quantitative evaluation of hand vein image quality. 2011 International Conference on Multimedia Technology (ICMT), Hangzhou, 5749-5751.
- Sayood K, Introduction to data compression, 4th Ed Morgan Kaufmann Massachusetts 2012.
- Xu J, Jianjiang C, Dingyu X, Feng P, "Near infrared vein image acquisition system based on image quality assessment," 2011 IEEE Conference on Electronics, Communications and Control (ICECC), Ningbo, 922-925.
- Hartung D, Martin S, Busch C. Quality Estimation for Vascular Pattern Recognition. 2011 IEEE Conference on Hand-Based Biometrics (ICHB), Hong Kong.1-6.
- Harlick RM , Shapiro LG. Computer and Robot Vision. 1st Ed Addison-Wesley Boston, 1992.
- Rosenfeld A, Pfaltz J. Distance Functions in Digital Pictures. Pattern Rec 1968; 1: 33-61.
- Lagodzinski P, Smolka B. Application of the Extended Distance Transformation in digital image colorization. J Multimed Tools Appl 2014; 69: 111-137.
- Zhang Z, Cui H, Lu H, Chen R, Yan Y. A colorization method based on fuzzy clustering and distance transformation. 2nd International Congress on Image and Signal Processing, China, 1-5.
- Popowicz A, Smołka B. Isoline Based Image Colorization. 16th International Conference on Computer Modelling and Simulation, Cambridge, 280-285.
- Waluś M, Bernacki K, Nycz M, Konopacki J. NIR finger vascular system imaging in angiology applications, 2015 22nd International Conference on Mixed Design of Integrated Circuits and Systems (MIXDES), Torun, 69-73.
|


 and Homogeneity (10)Distance
transformation-based image quality


