Review Article - Journal of Chemical Technology and Applications (2017) Volume 1, Issue 1
Physical and chemical characterization and evaluation of organic matter from tar-mat samples: Case study of Kuwaiti carbonate reservoir.
- *Corresponding Author:
- Abdullah O. Almansour
Kuwait Institute for Scientific Research (KISR) King Abdulaziz City for Science and Technology National Center for Oil and Gas Technology Riyadh Saudi Arabia
Tel: +966114814452, +966540492049
E-mail: aalmansour@kacst.edu.sa
Accepted date: September 20, 2017
Citation: Almansour AO, Al-Bazzaz WH. Physical and chemical characterization and evaluation of organic matter from tar-mat samples: Case study of Kuwaiti carbonate reservoir. J Chem Tech App. 2017;1(1):14-25.
DOI: 10.35841/chemical-technology.1.1.14-25
Visit for more related articles at Journal of Chemical Technology and ApplicationsAbstract
Tar-mat columns exist in many carbonate reservoirs in the Middle East. The presence of tar mats has become one of the most serious problems in the oil industry, as it impacts the extraction of primary oil and the application of improved oil recovery (IOR) technologies On the other hand, tar mats can be considered potential oil reserves in and of themselves. Tar mats, which are generally dark brown to black semi-solids, can isolate the aquifer from an oil reservoir. Understanding tar mats and being able to characterize and identify them is critical for minimizing production costs and strategically producing crude oil. The objective of the study presented here was to characterize the physical and chemical properties of extremely viscous tar-mat oil and to evaluate the properties of the organic matter before and after the extraction. Five tar-mat cores were collected from a Kuwaiti carbonate reservoir, and 13 samples were prepared from each tar-mat core. One sample from each core was used for the evaluation before the extraction, while the other 12 were used for the evaluation after the extraction by toluene, hot water, and surfactant under different temperatures (25°C, 135°C, 225°C, and 315°C). The chemical genesis of tar-mat oil samples has been analyzed using novel techniques such as Vario Macro Elemental Analysis 106, Rock-Eval 6 pyrolysis, the Soxhlet apparatus, and thin-layer chromatography (TLC). The results of the geochemical analysis using Rock-Eval 6 pyrolysis showed that the Kuwaiti carbonate reservoir was oil-prone and capable of oil/gas production (type ll and ll-lll kerogen). Most of the samples were thermally mature and good in terms of hydrocarbon generation. However, oil could not have been produced from these samples naturally. Also, the ratio of H/C increased as the API decreased. Moreover, the results showed that toluene had more of an impact on most of the parameter values, while hot water and surfactant only slightly affected them.
Keywords
Tar-mat columns, Oil recovery.
Introduction
Tar mats are very common in Kuwait and generally are located at the bottom of the oil column [1]. In petroleum reservoirs, the column thickness of tar mats can vary even within the same reservoir and may reach a few hundred feet [2] Tar mats contain extra heavy oil or bitumen and typically have a gravity of under 10° API and/or in-situ viscosity of above 10,000 cp [2]. Due to their high asphaltene content, typically around 20% to 60% of their weight, tar mats have low gravity and high viscosity by Wilhelms and Larter [3]. Asphaltenes are the hydrocarbon components in petroleum with the highest molecular weight. The chemical structure of these compounds usually is composed of various amounts of carbon (which contains 100 to 300 atoms per molecule), oxygen, sulfur, hydrogen and nitrogen components, and fractions of vanadium and nickel by Pineda- Flores and Mesta-Howard [4].
Tar mats occur near the base of oil accumulation or near the surface as oil seeps. Geochemical studies have revealed several causes of tar-mat formation by Moore [5], Hirschberg [6]. Most researchers believe that tar mats form due to the segregation of asphaltenes or compositional variances in the oil column, which result in differences in oil viscosity.
Publications on the recovery of heavy oil from tar mats are limited; evaluations of organic carbon and chemical and physical characterization studies on the categorization and displacement of tar mats in a consolidated matrix are rare. Abu-Khamsin, Ayub Al-Marhoun, et al. [7] conducted a study on cold waterflooding in a tar-mat reservoir (composite Berea sandstone core) using a laboratory model, finding a slight decrease in oil recovery as the tar zone’s viscosity-thickness product (Kμ) increased. Another study on oil recovery from tarmat reservoirs was conducted by Okasha, Menouar et al. [8] using solvent flooding and hot water. The results showed that higher hydrocarbon recoveries were obtained when combining hot water and two types of solvent flooding (naphtha and reformate) than when using hot water alone under temperatures of 103°C and 106°C, respectively. Furthermore, an optimum slug size for both solvents that maximizes the net hydrocarbon recovery was found. These optimum sizes for reformate and naphtha were 9.45% and 10.93% THPV, respectively. Solvent slugs that are larger or smaller than this optimum size is less effective by Okasha, Harouaka et al. [8-10] characterized the physical and chemical properties of tar mats from a carbonate reservoir in Saudi Arabia. The geochemical characteristics of tar mats that were derived from marine source rocks and their formation mechanisms also have been documented by Dahl and Speers [11,12].
Previous research has focused primarily on the evaluation of organic matter and source rock maturity of shale present in oil reservoirs. Nevertheless, no systematic study of the potential source rocks, organic geochemistry, and thermal maturation of tar mats present in heavy oil carbonate reservoirs has been reported.
The aim of this study was to systematically investigate the physical and chemical characterizations of tar-mat samples from a Kuwaiti carbonate reservoir. Also, an organic geochemical characterization was conducted using rock-eval 6 pyrolysis to obtain information for evaluating the quantity and quality of these tar-mat samples and, consequently, their petroleum potential and the type of kerogen they contain.
Materials and Methods
The following subsections describe the procedures and conditions under which oil was extracted from the tar-mat samples from the Kuwaiti carbonate reservoir and their physical and chemical properties were characterized.
Tar-mat oil samples
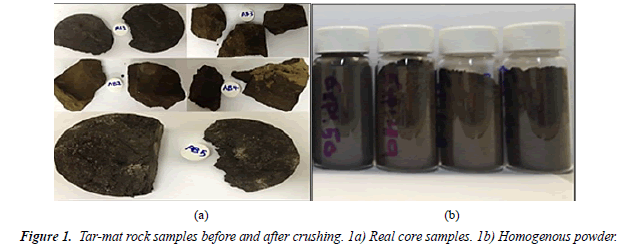
Five tar-mat cores were selected from a carbonate reservoir in Kuwait at depths of 2674 ft, 2703 ft, 2723 ft, 2755 ft, and 2782 ft. Then, 13 samples were collected from each core; one sample from each core was used for the evaluation before the extraction, and the other 12 for the evaluation after their extraction by toluene, hot water, and surfactant at four different temperatures (25°C, 135°C, 225°C, and 315°C). All of the samples were crushed by a manual marble grinder until they became homogeneous fine powder. Figures 1A and 1B show the tar-mat rock samples before and after being ground into fine powder.
Extraction Fluids: Toluene, hot water, and surfactant were used as extraction fluids to extract the oil that was used to determine the amount of saturates, aromatics, resins, and asphaltenes (SARA analysis) in the samples. The samples were studied before and after the extraction in order to compare the impact of the three extraction methods on the parameters obtained during the study. The physical properties of the tar-mat samples appear in Table 1. As indicated, the °API values from the five tarmat cores decreased as the depth increased. The °API gravity from the five tar-mat cores was calculated based on the method provided by Cubitt, England et al. [13]. This calculation was based on different parameters, such as S1r, S2a, and S2b [14].
| Zone | Depth (ft.) | h (ft.) | °API | Ø (%) | K (md) | |
|---|---|---|---|---|---|---|
| From | To | |||||
| AB1 | 2600 | 2674 | 74 | 1.34 | 34.9 | - |
| AB2 | 2674 | 2703 | 47 | 5.17 | 28.3 | 0.84 |
| AB3 | 2703 | 2723 | 23 | 4.1 | 35 | 7.3 |
| AB4 | 2723 | 2755 | 172 | 3.76 | 35.7 | 5.2 |
| AB5 | 2755 | 2782 | 84 | 1.72 | 9.8 | 5 |
Table 1: Physical properties of tar-mat samples.
Where:
S1r represents light oils of hydrocarbons in the range of C1- C22.
S2a represents heavy oils of hydrocarbons in the range of C22-C40.
S2b is an equivalent of resin + asphaltene in the C40+ range.
Elemental analysis
Vario macro elemental analysis 106 was used to determine the amounts of carbon (C), hydrogen (H), nitrogen (N), oxygen (O) and sulfur (S) in all samples before and after the extraction. The measurements were conducted twice to verify repeatability.
Rock-eval 6 pyrolysis
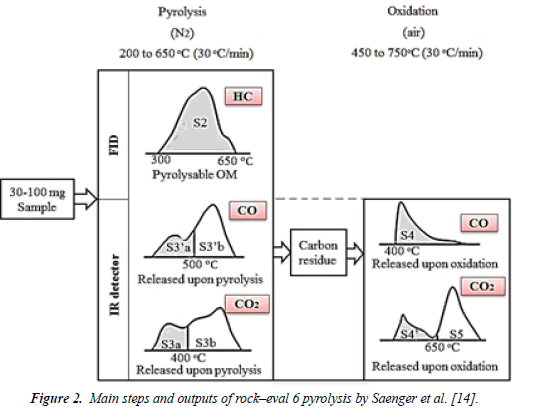
Rock–eval 6 pyrolysis was used to characterize the varying species of organic matter in sedimentary rocks, as well as some reservoir properties, such as the API of tar-mat samples, which cannot be characterized using conventional methods. The quantity, quality and thermal maturity of tar-mat rock samples were evaluated based on the total organic carbon (TOC) content and rock-eval 6 pyrolysis data. The thermal volatilization technique, which primarily entails keeping the sediments at a constant temperature of 300°C for three minutes and then gradually increasing the temperature to 500°C, was used to obtain characteristics S1 and S2. In this case, S1 represented the number of free hydrocarbons, such as oil and gas, in the test sample, measured in milligrams of hydrocarbon per gram of rock. Another important characteristic to determine is S2, which is the amount of hydrocarbon generated when nonvolatile organic matter is cracked thermally. The TOC was determined by oxidizing the pyrolysis residue in a second oven at 600°C. Figure 2 shows how other parameters, such as S3, S3’, S4, S5, were determined by Rock-eval 6 pyrolysis. Tmax is the temperature of the maximum rate of evolution of S2 hydrocarbons (top of S2 peak). Table 2 summarizes the parameters obtained from Rock-Eval 6.
| Rock-Eval 6 peaks and their significance | ||
|---|---|---|
| Parameter | Unit | Name |
| S1 | mg HC/g rock | Free hydrocarbons |
| S2 | mg HC/g rock | Hydrocarbons derived from kerogen pyrolysis (Hydrocarbons cracked) |
| Tmax | °C | Source rock maturity |
| S3 | mgCO2/g rock | CO2 from organic source |
| S3’ | mgCO2/g rock | CO2 from mineral source |
| S3CO | mg CO/g rock | CO from organic source |
| S3’CO | mg CO/g rock | CO from organic and mineral Sources |
| Source rock screening | ||
| TOC | % wt. | Total organic carbon |
| PI | - | Production index |
| PC | % wt. | Pyrolysable carbon organic |
| RC | % wt. | Residual carbon organic |
| HI | mg HC/g TOC | Hydrogen index |
| OI | mg CO2/g TOC | Oxygen index |
| PyroMinC | % wt. | Pyrolysis mineral carbon |
| OxiMinC | % wt. | Oxidation mineral carbon |
| MinC | % wt. | Mineral carbon |
Table 2: Summarized list of the Rock-eval 6 analysis output.
The following parameters can be calculated using the S1, S2, and TOC values obtained from the Rock-Eval 6 pyrolysis analytical test:
• HI: Hydrogen Index, (S2/TOC) × 100 (mg HC/g TOC)
• BI: Bitumen Index, (S1/TOC) × 100 (mg HC/g TOC)
• QI: Quality Index, ((S1+S2)/TOC) × 100 (mg HC/g TOC)
• PI: Productivity Index (transformation ratio), S1/(S1+S2)
• GP: Genetic Potential, (S1+S2) (mg HC/g rock)
• PCI: Pyrolyzable Carbon Index, (0.83 × (S1+S2))
When evaluating rocks to determine their potential to produce petroleum, three factors are employed that are based purely upon the parameters of the Rock-eval test. These factors are based on the guidelines for the pyrolysis parameters of quality, quantity and thermal maturity, as indicated previously adapted from Ghasemi-nejad, Head et al. [15], Peters and Cassa [16] (Table 3):
1. S1, S2 and TOC are the factors upon which the quantity, or in this case, the potential quantity, is based.
2. H1 and the S2/S3 ratio determine the type of hydrocarbon produced.
3. P1 and T-max determine the level of thermal maturity for the petroleum generated.
| Quantity | TOC (wt. %) | S1 (mg HC/g rock) | S2 (mg HC/g rock) |
|---|---|---|---|
| Poor | 0-0.5 | 0-0.5 | 0-2.5 |
| Fair | 0.5-1 | 0.5-1 | 2.5-5 |
| Good | 1-2 | 1-2 | 5-10 |
| Very Good | 2-4 | 2-4 | 10-20 |
| Excellent | >4 | >4 | >20 |
| Quality | HI (mg HC/g TOC) | S2/S3 | Kerogen type |
| None | <50 | <1 | IV |
| Gas | 50-200 | 1-5 | III |
| Gas and Oil | 200-300 | 5-10 | II/III |
| Oil | 300-600 | 10-15 | II |
| Oil | >600 | >15 | I |
| Maturation | Ro (%) | Tmax (°C) | PI |
| Immature | 0.2--0.6 | <435 | <15 |
| Early | 0.6-0.65 | 435-445 | 0.15-0.25 |
| Peak | 0.65-0.9 | 445-450 | 0.25-40 |
| Late | 0.9-1.35 | 450-470 | >40 |
| Postmature | >1.35 | >470 | - |
Table 3: Guidelines for pyrolysis of quality, quantity and thermal maturity adapted from Peters and Cassa in 1994.
Extracting oil from tar-mat samples
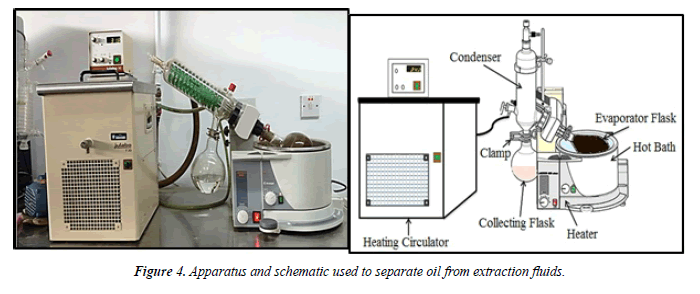
Oil was extracted from powdered tar-mat samples of approximately 10 to 21 g on average using a Soxhlet apparatus. The extraction took approximately 6 hours, and surfactant, water and toluene were used as the extraction fluids. The procedure involved dipping the powdered samples into the extraction fluids and using glass beads to raise them. Lastly, the oil was separated from the extraction fluids with Heidolph and JulaboRotary evaporators F30, as shown in Figures 3 and 4.
Sara analysis
SARA analysis was carried out to quantify the saturates, aromatics, resins and asphaltenes in these samples using thinlayer chromatography (TLC) equipped with scanning flame ionization detection (FID). The procedures for determining SARA using TLC-FID were specified by Barman [17]. The colloid instable index (CII), which was used to predict the stability of the crude oil extracted from these samples, can be calculated based on SARA analysis results using Eq. (1) by Newberry and Barker [18].
 (1)
(1)
Results and Discussion
The oil extracted from these samples using toluene was used for the SARA analysis. The other data were obtained based on the pyrolysis analysis of the rock samples before and after the extraction.
Elemental analysis
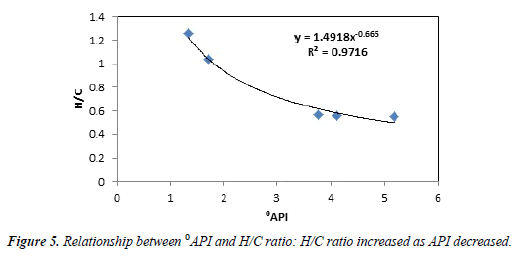
Table 4 summarizes the amounts of oxygen, carbon, nitrogen, sulfur and hydrogen that the samples contained before the extraction. The API decreased as the ratio of hydrogen to carbon increased (Figure 5). Samples extracted by water, toluene and surfactant may exhibit above-average levels of the elements listed in Table 4, probably due to the entrapment of solvents within the samples.
| Sample | wt (mg) | C (%) | H (%) | N (%) | S (%) | O (%) | H/C |
|---|---|---|---|---|---|---|---|
| AB1 | 43.00 | 24.27 | 2.54 | 0.71 | 7.96 | 64.52 | 1.26 |
| AB2 | 42.01 | 18.85 | 0.86 | 0.44 | 0.90 | 78.94 | 0.55 |
| AB3 | 42.60 | 18.69 | 0.88 | 0.47 | 0.75 | 79.21 | 0.56 |
| AB4 | 41.45 | 18.04 | 0.85 | 0.45 | 0.72 | 79.94 | 0.57 |
| AB5 | 40.12 | 30.76 | 2.67 | 0.82 | 5.24 | 60.51 | 1.04 |
Table 4: Result of elemental analysis from tar-mat samples before extraction.
As expected, the hydrogen and carbon content was lower following extraction by toluene, as evident in samples AB2, AB3 and AB4. Consequently, a slight decrease was recorded after extraction using surfactant and water, as shown in Table 5.
| Solvent | T (°C) | Sample | C (%) | H (%) |
Sample | C (%) | H (%) |
Sample | C (%) | H (%) |
Sample | C (%) | H (%) |
Sample | C (%) |
H (%) |
|---|---|---|---|---|---|---|---|---|---|---|---|---|---|---|---|---|
| raw | 25 | AB1 | 24.27 | 2.54 | AB2 | 18.85 | 0.86 | AB3 | 18.69 | 0.88 | AB4 | 18.04 | 0.85 | AB5 | 30.76 | 2.67 |
| Toluene | 25 | 22.75 | 2.83 | 16.22 | 0.46 | 16.28 | 0.50 | 13.58 | 0.38 | 29.76 | 2.55 | |||||
| 135 | 22.55 | 2.23 | 14.21 | 0.17 | 13.99 | 0.13 | 13.18 | 0.08 | 36.36 | 2.96 | ||||||
| 225 | 25.24 | 2.48 | 14.41 | 0.15 | 13.60 | 0.16 | 13.33 | 0.07 | 31.19 | 2.54 | ||||||
| 315 | 26.26 | 2.58 | 14.41 | 0.17 | 14.30 | 0.16 | 13.60 | 0.09 | 32.77 | 2.74 | ||||||
| Water | 25 | AB1 | 22.84 | 2.60 | AB2 | 19.43 | 0.89 | AB3 | 19.91 | 0.95 | AB4 | 13.33 | 0.07 | AB5 | 30.36 | 2.79 |
| 135 | 30.29 | 2.80 | 19.19 | 0.92 | 19.59 | 0.94 | 19.38 | 0.90 | 23.84 | 2.66 | ||||||
| 225 | 23.04 | 2.73 | 19.28 | 0.90 | 19.58 | 0.93 | 18.88 | 0.89 | 31.03 | 2.87 | ||||||
| 315 | 23.76 | 2.80 | 19.32 | 0.91 | 18.17 | 0.86 | 17.96 | 0.84 | 27.59 | 2.57 | ||||||
| Surfactant | 25 | AB1 | 22.35 | 2.62 | AB2 | 18.02 | 0.85 | AB3 | 18.43 | 0.89 | AB4 | 18.08 | 0.89 | AB5 | 27.97 | 2.62 |
| 135 | 22.67 | 2.73 | 18.05 | 0.83 | 18.58 | 0.90 | 17.76 | 0.85 | 29.09 | 2.83 | ||||||
| 225 | 21.15 | 2.74 | 17.76 | 0.82 | 18.17 | 0.88 | 17.95 | 0.86 | 29.21 | 2.79 | ||||||
| 315 | 21.85 | 2.75 | 18.07 | 0.84 | 18.21 | 0.88 | 17.65 | 0.84 | 29.58 | 2.97 |
Table 5: Result of elemental analysis from tar-mat samples after extraction by toluene, hot water, and surfactant under different temperatures (25°C, 135°C, 225°C, and 315°C).
Total organic carbon
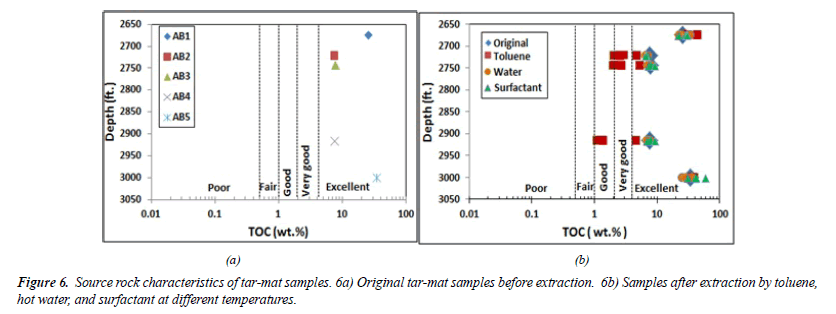
Before the extraction, the total organic carbon content (TOC, wt.%) for five samples from five tar-mat cores (AB1, AB2, AB3, AB4, and AB5) was measured using Rock-Eval 6. Table 6 lists these TOC values, which were 25.25, 7.56, 7.75, 7.61, and 34.29, respectively. The mean of the five samples was 16.49%. By considering these values and applying by Peters and Cassa [16] classification, it was concluded that tar-mat rock is an excellent rock source as it contains more than 4%, as shown in Figure 6A.
| Sample | wt. (mg) | Tmax | HI | S1 | S2 | S3 | TOC | OI | S2/S3 | BI | QI | PI | GP | PCI | Ro (%) |
|---|---|---|---|---|---|---|---|---|---|---|---|---|---|---|---|
| AB1 | 45.44 | 428 | 214 | 3.3 | 54 | 4.4 | 25.3 | 17 | 12.2 | 13.2 | 227.0 | 0.06 | 57.3 | 47.6 | 0.54 |
| AB2 | 45.44 | 465 | 514 | 18.2 | 38.9 | 0.3 | 7.6 | 4 | 114.4 | 240.6 | 754.9 | 0.32 | 57.1 | 47.4 | 1.21 |
| AB3 | 45.8 | 467 | 520 | 17.6 | 40.3 | 0.4 | 7.8 | 5 | 115.1 | 226.8 | 746.8 | 0.30 | 57.9 | 48.0 | 1.25 |
| AB4 | 45.86 | 468 | 577 | 16.9 | 43.9 | 0.3 | 7.6 | 4 | 141.6 | 221.4 | 798.4 | 0.28 | 60.8 | 50.4 | 1.26 |
| AB5 | 45.27 | 438 | 214 | 9.5 | 73.5 | 4.7 | 34.3 | 14 | 15.5 | 27.7 | 242.2 | 0.11 | 83.0 | 68.9 | 0.72 |
Table 6: Toc and rock-eval 6 pyrolysis data from tar-mat samples before extraction.
Figure 6B shows the TOC values under the varied extraction fluid conditions for the remaining 12 samples collected from each tar-mat core at various operating temperatures. The results showed that the TOC value rose in samples AB1 and AB5 following the extraction. This was perceived as being an extreme case for tar mats having high viscosity and low API gravity, most likely occurring because solvent was trapped within the samples. Following extraction using toluene, the TOC value fell in samples AB2, AB3 and AB4. Due to their low viscosity and high API, these three samples were considered light tar mats.
Rock-eval pyrolysis and organic matter types
The results of the rock-eval pyrolysis from tar-mat samples before extraction are summarized in Table 6. Figures 7-15 illustrate these results and those from the other 12 samples collected from each tar-mat core after extraction. These results were analyzed and interpreted according to Peters and Cassa [16], Espitalié, La Porte et al. [19], Avramidis and Zelilidis [20] using the guidelines shown in Table 3.
Quantity of organic matter from tar-mat samples: Geochemical organic analysis was conducted before and after the extraction for all samples in order to establish the genetic potential (GP) and to predict the quantity and nature of the hydrocarbons that could be generated from kerogen.
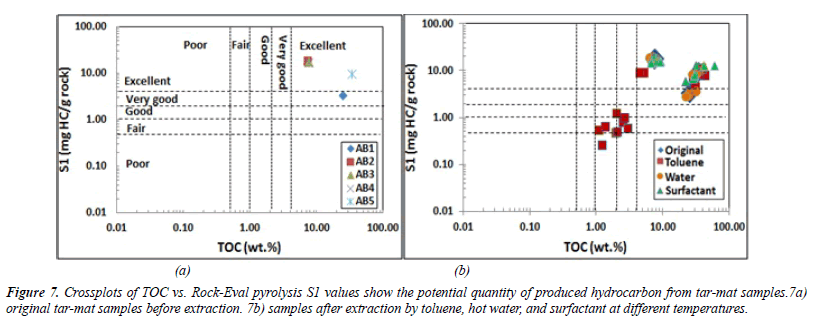
The potentiality of the source rock was determined by plotting the pyrolysis S1 and S2 values versus the TOC. For samples AB1 through AB5, the S1 value was between 3.33 mg HC/g and 18.19 mg HC/g rock. The average value of S1 was 13.01 mg HC/g of rock (Table 6). These obtained S1 values indicate a very good to excellent potential source rock for hydrocarbon generation (Figure 7).
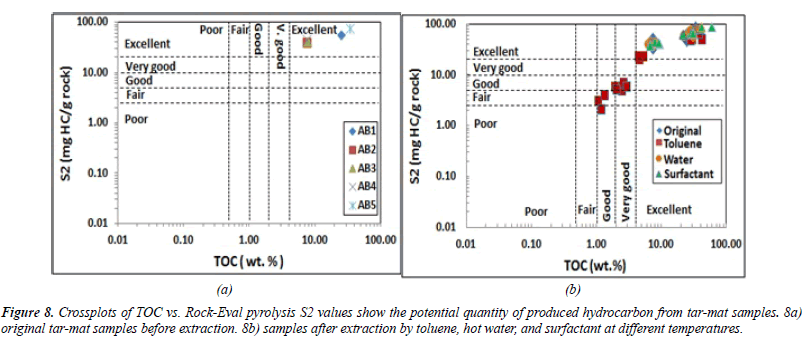
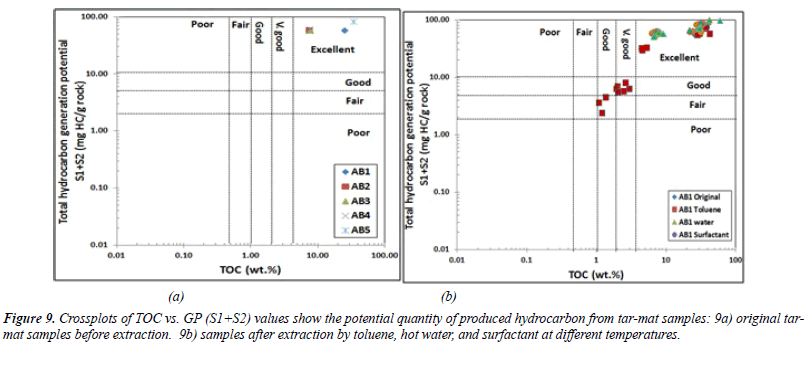
The S2 value for the same samples was between 38.88 and 73.54 mg HC in every gram of rock. The mean value was 50.13 mg HC/g of rock (Table 6). These values, depicted in Figure 8, indicate excellent hydrocarbon generation. The genetic potential (GP=S1+S2) values fell between 57.07 and 83.04 mg HC/g of rock, with an average of 63.22 mg HC/g of rock (Table 6). According to the classification given by Tissot and Welte [21], the GP values were above 6 mg HC/g of rock, indicating good source rock potential (Figure 8).
When water, surfactant, and toluene were used in the extraction, the 12 samples collected from each tar-mat core recorded reduced S1 and S2 values. Figures 7-9 illustrate that the reduction was even greater following extraction using toluene than when using surfactant or hot water. Figures 7B and 8B depict the S1 and S2 value reductions after extraction using toluene.
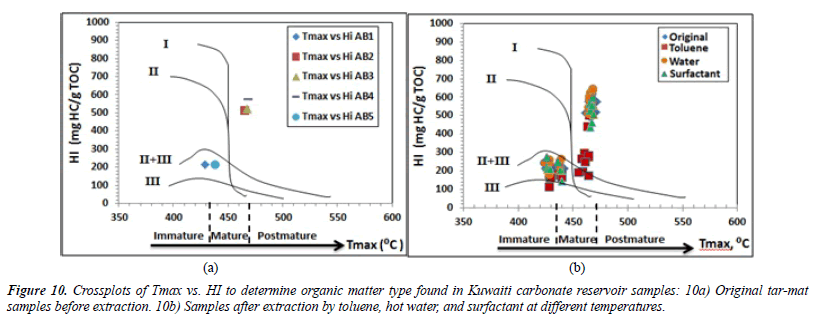
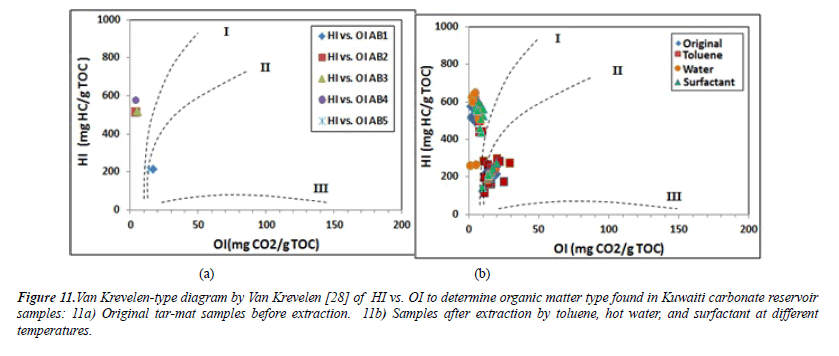
Type of organic matter (kerogen type): The hydrogen index (HI) values for the initial five samples, AB1 through AB5, before extraction were 214, 514, 520, 577 and 577 (mgHC/g of TOC), respectively. The mean was 407.8 (mgHC/g of TOC). According to Peters and Cassa [16] (Table 3), these values indicate that samples AB1 and AB5 contained Type II/III kerogen of either land or marine origin capable of emitting oil and gas. The other samples, AB2 through AB4, were composed of Type II kerogen of marine origin, which is rich in hydrogen and poor in oxygen. Combining these characteristics with the good S2 hydrocarbon of samples AB2, AB3 and AB4 yielded 39 mg HC/g, 40 mg HC/g and 44 mg HC/g of rock, respectively (Table 6). The oxygen index (OI) ranged from 4 to 17 mg CO2/g of TOC, with a mean of 8.8 mg CO2/g of TOC. The maximum temperature (Tmax) was between 428 and 468°C, with a mean of 453.2°C. As shown in Table 6, the organic geochemical results were plotted in the curves HI vs. Tmax and HI vs. OI in order to evaluate the type of kerogen in the five samples before the extraction. The HI vs. Tmax and HI vs. OI diagrams show that the samples laying on the curves mainly consisted of kerogen Types II and II/III (Figures 10 and 11).
The S2/S3 ratio, which represents the hydrocarbon type index, was used by Clementz, Demaison et al. [22], Groune, Halim et al. [23] to determine the kerogen type. The hydrocarbon type index (S2/S3) values of samples AB1 and AB5 were 12 and 15, respectively. Values ranging from 10-15 indicate Type II kerogen suitable for the production of oil (Table 6). The S2/S3 values of samples AB2, AB3 and AB4 were 114, 115 and 141; values greater than 15 (>15) may indicate kerogen Type I by Peters and Cassa [16].
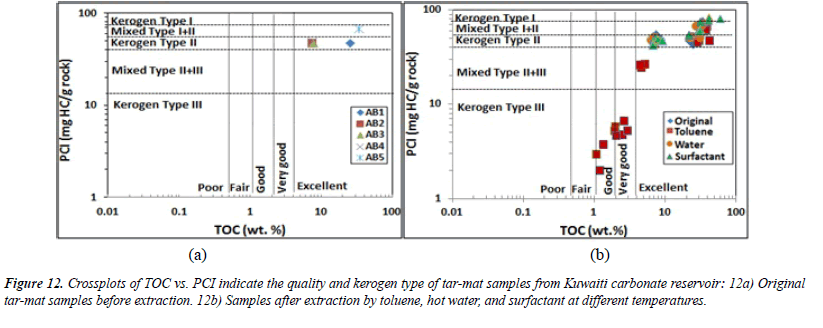
The pyrolyzable carbon index (PCI) indicates the maximum amount of hydrocarbon that a sample generated during the analysis. The PCI is another parameter that can be used to determine the kerogen type and its hydrocarbon potential. PCI values ≥ 75 indicate Type I; values from 40–50 represent Type II; and values <15 indicate Type III [24,25]. The expression for obtaining the PCI from the initial five tar-mat samples and from the 60 samples collected from these five initial tar mats was suggested to be by Reed and Ewan.[24], Shaaban, Lutz et al. [25,26]
(PCI) = 0.83*(S1+ S2)
The plot of PCI versus TOC before the extraction from the five initial samples shows that samples AB1 through AB4 were kerogen Type II, and sample AB5 was a mix of kerogen Type I/II (Figure 12A). Also, Figure 12B shows the results of the 60 samples after extraction using toluene, water and surfactant. The results indicate that toluene had a greater impact on these samples, especially AB2 through AB4 (Figure 12B).
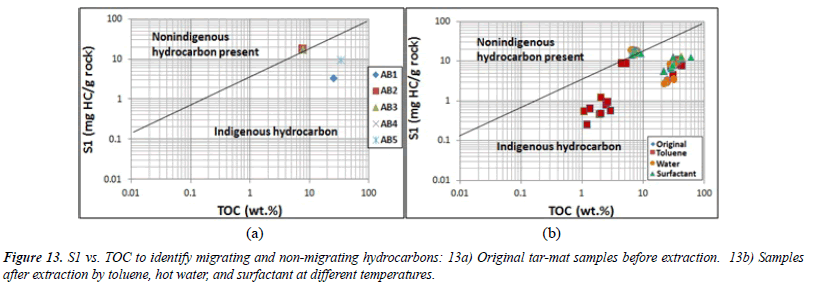
Clearly, the Kuwaiti carbonate reservoir formation is characterized by localized intervals with the capacity to generate both oil and mixed oil/gas. The oil-prone source rock intervals from samples AB2, AB3 and AB4 were characterized by very high TOC (7.56% to 7.75%) and excellent potential to generate oil, as indicated by their high HI (pyrolysis S2 yields from 38.9 to 43.9 mg HC/g of rock, and HI mostly >500 mg HC/g of TOC). The mixed-prone source rock intervals from samples AB1 and AB2 were characterized by high TOC (25.25% to 34.29%) and fair to very good potential to generate oil and gas, as indicated by their high HI (pyrolysis S2 yields from 54-73.5 mg HC/g of rock, and HI mostly >200 mg HC/g of TOC). Plotting S1 versus the TOC can help to differentiate between the migrated and nonmigrated hydrocarbons. When S1 is high and the TOC is low, this indicates migrated hydrocarbon [27] The dividing line on the plot is where S1/TOC=1.5. Non-indigenous hydrocarbons have higher values than this, while indigenous hydrocarbons have lower values [27]. All of the analyzed tar-mat samples contained both migrated and non-migrated hydrocarbons (Figure 13).
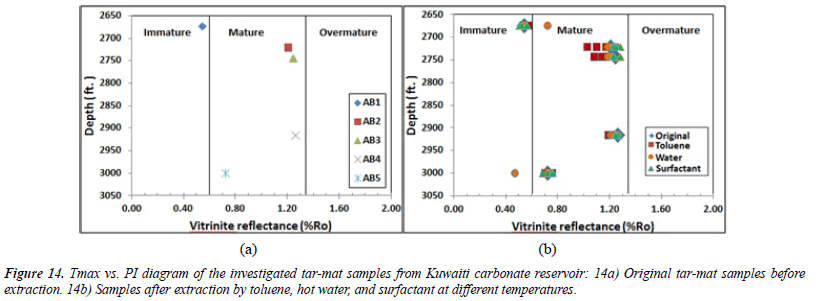
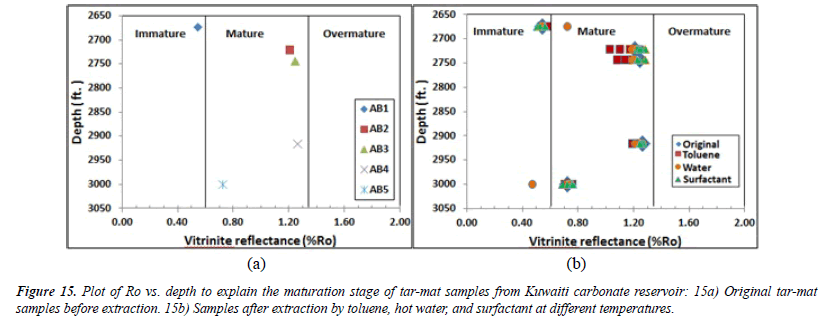
Thermal maturity of organic matter: Both Tmax and the Production Index or the transformation ratio (PI) can be used to determine the thermal maturity of the organic material from the tar-mat samples before the extraction. The production index (PI) ranged from 0.03 to 0.32, with an average of 0.21 (Table 6). The plot of Tmax versus the PI for samples AB1 and AB5 indicates a stage of immature oil formation (Figure 14) [28]. The values for the other three samples indicate a stage of late– mature oil formation. Similarly, the vitrinite reflectance (%Ro) value can be used to precisely determine the level of maturity in organic matter. This value can be calculated for kerogen Types II and III. The expression for obtaining %Ro, as suggested by Jarvie, Claxton et al. [29], is:
(%Ro) = (0.0180×Tmax ) − 7.16
The results of the Ro% analysis of the five tar-mat samples before the extraction appear in (Table 6). As Figure 15 depicts, the Ro% values, which ranged from 0.54% to 1.26%, with an average of 1.0%, indicate that this formation ranges from immature to mature.
SARA analysis
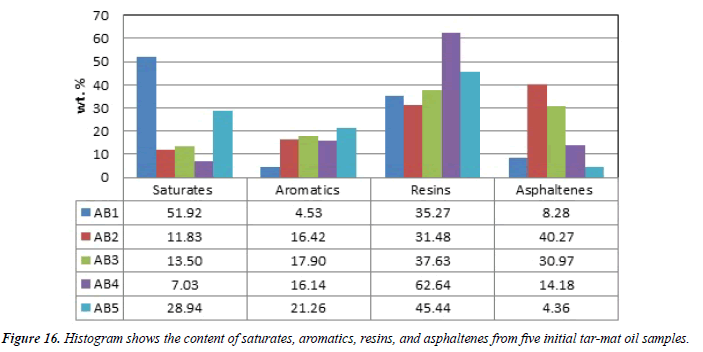
The tar-mat sample oil group compositions were analyzed using thin layer chromatography, and the results appear in Table 7. The saturate and aromatic content of the five tar-mat samples (AB1 through AB5) ranged from 7.03 wt%-51.92 wt% and 4.53 wt%-21.26 wt%, respectively. These values were relatively low considering the other two compositions (resins and asphaltenes), as shown in Figure 16. The resin and asphaltene content of the five oil samples ranged from 31.48 wt%-62.64 wt% and 4.36 wt%-40.27 wt%, respectively (Table 7).
| Sample | Saturates % | Aromatics % | Resins % | Asphaltenes % | Total % | CII | Stability |
|---|---|---|---|---|---|---|---|
| AB1 | 51.92 | 4.53 | 35.27 | 8.28 | 100 | 1.51 | Unstable>0.9 |
| AB2 | 11.83 | 16.42 | 31.48 | 40.27 | 100 | 1.09 | Unstable>0.9 |
| AB3 | 13.5 | 17.9 | 37.63 | 30.97 | 100 | 0.80 | Stable<0.9 |
| AB4 | 7.03 | 16.14 | 62.64 | 14.18 | 100 | 0.27 | Stable<0.9 |
| AB5 | 28.94 | 21.26 | 45.44 | 4.36 | 100 | 0.50 | Stable<0.9 |
Table 7: Analysis results of group composition from original tar-mat samples.
Within the scope of the samples analyzed, a noticeable difference existed in the SARA fraction distribution when comparing samples at various depths from the same well. Also, the tar-mat samples had higher concentrations of resins and asphaltenes than of saturates and aromatics. Some of the tar-mat samples, such as AB2, AB3 and AB4, showed high asphaltene concentrations (10% to 40% in weight).
Prediction of crude oil stability: Usually, the degree of asphaltene stability in crude oil is indicated by the proportions of SARA fractions. Carbognani and Espidel [30] demonstrated that reservoirs experience asphaltene problems not because they contain large amounts of asphaltene in the oil, but because they contain high saturate fractions. The ratio of resins to asphaltenes can be used as an indicator of asphaltene stability, as based on the hypothesis posited by Leontaritis and Mansoori [31] that resins confer asphaltene stability by peptizing (or coating) the asphaltenes. The colloidal instability inndex (CII), which is the ratio of total, saturates and asphaltenes to total resins and aromatics, also has been used to establish asphaltene stability. CII values below 0.9 indicate crude oil stability. However, values exceeding 0.9 indicate unstable oil [32,33]. However, no evidence fully supports either this hypothesis or the utility of any specific ratio to serve as an indicator of asphaltene stability.
Following the SARA method, the CII values of the tar-mat samples before the extraction were below 0.9 only in samples AB3, AB4 and AB5, indicating the stability of these samples and the instability of samples AB1 and AB2 (Table 7). These values also indicate that in the three former samples, asphaltene deposition tended to occur because of the lower concentration of aromatics and resins and the higher concentration of saturates and asphaltenes. On the other hand, the CII values for samples AB1 and AB2 were greater than 0.9, indicating that their asphaltene deposition tended to occur because of a lower concentration of saturates and asphaltenes (numerator) and a greater concentration of resins and aromatics (denominator). The asphaltene deposition sequence of the five oil samples was AB2>AB3>AB4>AB1>AB5, as shown in Figure 16.
Conclusion
The properties of tar mats can vary with depth and area within the same field. The analysis of the physical properties of tar-mat samples indicated a decrease in API gravity with depth, as well as a gradual increase in tar-mat viscosity with depth, which was more pronounced in the neighborhood of the tar/water contact. The elemental analysis of the tar-mat samples showed that the ratio of H/C increased as the API gravity decreased.
The rock-eval 6 and TOC analyses indicated very good to excellent generative potential in most of the tar-mat samples. These samples had high TOC values (>4 wt.%), and pyrolysis S2 values between 38.88 and 73.54 mg HC/g of rock. The HI versus Tmax and OI diagrams showed that this formation was composed of Types II and II/III kerogen from either land or marine origin capable of emitting oil and gas. Moreover, the Tmax, transformation ratio (PI), and vitrinite reflectance (%Ro) values indicated that this formation ranged from immature to mature.
Based on the evaluation of organic matter, the samples collected from five tar-mat cores from a Kuwaiti carbonate reservoir can be considered a good source rock that can generate oil upon pyrolysis.
Results from the SARA analysis showed that the tar-mat samples contained fewer saturates and aromatics than resins and asphaltenes. Furthermore, colloid instability index (CII) values were calculated based on the SARA method to predict crude oil stability. Samples AB3, AB4 and AB5 had CII values below 0.9, indicating that their asphaltene deposition tended to occur because of their higher saturate and asphaltene content and lower aromatic and resin content. On the other hand, the CII value was greater than 0.9 for samples AB1 and AB2, indicating that in these two samples, asphaltene deposition tended to occur because of the lower content of saturates and asphaltenes and greater content of resins and aromatics. The asphaltene deposition sequence of these five tar-mat oil samples was AB2>AB3>AB4>AB1>AB5. In general, the results indicated that toluene had more of an impact on most of the parameters after the extraction, while hot water and surfactant had only a slight impact.
References
- Nascimento J de DS, Gomes RMR. Tar mats characterization from NMR and conventional logs, Case studies in deep water reservoirs, offshore Brazil. Society of Petro Physicists and Well-Log Analysts. 2004
- Nascimento J de DS, Pinto ACC. Tar Mats?genesis, characterization and implications in E&P, internal report, Petrobras. 2003
- Wilhelms A, Larter SR. Origin of tar mats in petroleum reservoirs. Part II: Formation mechanisms for tar mats. Mar Pet Geol. 1994;11:442-56.
- Pineda-Flores G, Mesta-Howard AM. Petroleum asphaltenes: Generated problematic and possible biodegradation mechanisms. J Rev Latinoam Microbiologia. 2001;43:143-50.
- Moore LV. Significance, classification of asphaltic material in petroleum exploration. J Oil Gas. 1984;109-12.
- Hirschberg A. Role of asphaltenes in compositional of reservoir?s fluid column. J Pet Technol. 1988;89-94.
- Abu-Khamsin SA, Ayub M, Al-Marhoun MA, et al. Waterflooding in a tarmat reservoir laboratory model. J Pet Sci Enginee 1993;9: 251-61.
- Okasha TM, Menouar HK, Abu-Khamsin, SA. Oil recovery from Tarmat reservoirs using hot water and solvent flooding. J Canad Pet Technol 1998;37:33-40.
- Harouaka AS, Mtawaa B, Nofal WA. Characterization of tar from a carbonate reservoir in Saudi Arabia: Physical Aspect, SPE Paper 78538, 10th ADIPEC, Abu Dhabi, 2002.
- Harouaka AS, Asar HK, Al-Arfaj AA, et al. Characterization of Tar from a carbonate reservoir in Saudi Arabia-Part I: Chemical Aspect, SPE Paper 21004 International Symposium on Oil Field Chemistry, Anaheim, CA. 2014.
- Dahl B, Speers GC. Geochemical characterization of a tar mat in the Oseberg Field Norwegian Sector, North Sea: Org Geo chem. 1986;10:547-58.
- Wilhelms A, Larter SR. Origin of tar mats in petroleum reservoirs. Part 1: Introduction and case studies. Mar Pet Geol. 1994;11:418-41.
- Cubitt JM, England WA, Larter SR. Understanding petroleum reservoirs: Towards an integrated reservoir engineering and geochemical approach. London: Geological society. 2004.
- Saenger A, Cécillon L, Sebag D, et al. Soil organic carbon quantity, chemistry and thermal stability in a mountainous landscape: A rock?eval pyrolysis survey. Organic Geochemistry. 2013;54:101-14.
- Ghasemi-nejad E, Head M, Nader M. Palynology and petroleum potential of the Kazhdumi formation (cretaceous: albian?cenomanian) in the south-pars field, northern Persian gulf. Mar Pet Geol. 2008;1-24.
- Peters KE, Cassa MR. Applied source rock geochemistry, In: Magoon, LB, Dow, WG, (ed). The petroleum system-from source to trap: Tulsa, Okla, American Association of Petroleum Geologists Memoir. 1994;60:93-117.
- Barman BN. Hydrocarbon-type analysis of base oils and other heavy distillates by thin-layer chromatography with flame-ionization detection and by the clay?gel method. J Chromatogr Sci. 1996;34:219-25.
- Newberry ME, Barker KM. Formation damage prevention through the control of paraffin and asphaltene deposition SPE 13796, paper presented at the 1985 SPE operations Symposium, Oklahoma City, Oklahoma. 1985;53-61.
- Espitalié J, La Porte JL, Madec J, et al. Rapid method of characterization of source rocks of their petroleum potential and their degree of evolution. Rev Inst Fr Pet. 1977;32:23-42.
- Avramidis P, Zelilidis A. Potential source rocks, organic geochemistry and thermal maturation in the southern depocenter (kipourio-grevena) of the mesohellenic Basin, central Greece-Int J Coal Geol. 2007;71:554-67.
- Tissot BP, Welte DH. Petroleum formation and occurrence, 2nd revised and enlarged edition: Berlin heidelberg New York Tokyo, Springer-Verlag. 1984;699.
- Clementz DM, Demaison GJ, Daly AR. Well site geochemistry by programmed pyrolysis. Proceedings of the 11th annual offshore technology conference, Houston, OTC 3410.1979;1:465-47.
- Groune K, Halim M, Benmakhlouf M, et al. Organic geochemical and mineralogical characterization of the Moroccan rif bituminous rocks. J Mater Environ Sci. 2013;4:472-81.
- Reed S, Ewan HM, 1986. Geochemical report, Norse hydro A/S, 6407/7-1, http://www.npd.no/engelsk/cwi/pbl/geochemical_pdfs/474_7. pdf accessed February 8, 2010.
- Shaaban F, Lutz R, Littke R, et al. Source-rock evaluation and basin modelling in NE Egypt (NE Nile Delta and northern Sinai). J Pet Geol. 2006;29:103-24.
- http://www.dggs.dnr.state.ak.us/webpubs/dggs/gmc/text/gmc157.PDF accessed 2/14/2010.
- Hunt JM. Petroleum geochemistry and geology, second edition: New York, W.H. Freeman, and company. 1996;743.
- Van Krevelen DW. Coal: Typology-Chemistry-Physics-Constitution, (3rd ed). Elsevier Science, Amsterdam, 1993;979.
- Jarvie DM, Claxton BL, Henk F, et al. Oil and shale gas from the barnett shale, Ft. worth basin, Texas, AAPG National convention, Denver, CO, AAPG Bull. 2001;85:100.
- Carbognani L, Espidel J. Characterization of solid deposits from production facilities. Identification of possible causes of deposits formation. Technology Vision. 1995;31:35.
- Leontaritis KJ, Mansoori GA. Asphaltene flocculation during oil production and processing: A Thermodynamic collodial model. Society of Petroleum Engineers. 1987.
- Yen A, Yin YR, Asomaning S. Evaluating asphaltene inhibitors: Laboratory tests and field studies. spe international symposium on oilfield chemistry, Houston, Texas, USA. 2001.
- Chen C, Guo J, An N, et al. Study of asphaltene deposition from Tahe crude oil. Petroleum Science. 2013;10:134-38.
