Research Article - Journal of Biochemistry and Biotechnology (2024) Volume 7, Issue 6
Optimization of Pretreatment, Enzymatic Hydrolysis of Corn Husk for Enhanced Bioethanol Production
Amisha Biswal*, Priyanka Prusty, Swetlina Sahoo
Department of Biotechnology, MITS School of Biotechnology, India
- *Corresponding Author:
- Amisha Biswal
Department of Biotechnology
MITS School of Biotechnology, India
E-mail: biswalamisha316@gmail.com
Received: 30-Nov-2024, Manuscript No. AABB-24-153763; Editor assigned: 02-Dec-2024, Pre QC No. AABB-24-153763 (PQ); Reviewed: 10-Dec-2024, QC No. AABB-24-153763; Revised: 17-Dec-2024, Manuscript No. AABB-24-153763 (R); Published: 21-Dec-2024, DOI:10.35841/aabb-7.6.232
Citation: Biswal A. Optimization of Pretreatment, Enzymatic Hydrolysis of Corn Husk for Enhanced Bioethanol Production. J Biochem Biotech 2024; 7(6):232.
Keywords
Enzymatic hydrolysis, Corn husk, Bioethanol production, Lignocellulosic biomass, Cellulose conversion, Fermentation efficiency, Enzyme activity.
Introduction
The rising consumption of non-renewable energy sources has prompted a shift towards renewable alternatives like bioethanol, a promising substitute for petroleum. Derived from plant or algae sources, bioethanol reduces greenhouse gas emissions and supports energy sustainability. Despite its lower energy content compared to gasoline, bioethanol offers higher combustion efficiency due to its oxygen content. Many countries, including India, have adopted policies promoting bioethanol from lignocellulosic biomass, which is economically viable, environmentally sustainable, and avoids competition with food production. However, high processing costs limit its large-scale commercialization. Advanced technologies, such as genetic engineering and enzyme optimization, aim to enhance biomass conversion efficiency and reduce costs. This study explores the combined use of physical, chemical, biological, and enzymatic pre-treatments for corn husk conversion, employing optimized enzymatic activity and simultaneous saccharification and fermentation (SSF) using Saccharomyces cerevisiae to improve ethanol production [1].
Review and Literature
Maize
Maize, or corn (Zea mays), is a vital cereal crop globally, belonging to the Poaceae family. Its name originates from the Greek word "zea" (sustaining life) and Taino "mays" (life giver). A staple food for many, maize ranks third in production after rice and wheat. Native to the Americas, it is now cultivated worldwide, including the U.S., China, and Brazil. Rich in starch, protein, fats, and vitamins, maize supports human consumption, animal feed, and numerous industrial products like corn oil and starch. It thrives in warm climates, with optimal growth conditions including moderate temperatures (21–27°C), adequate rainfall (500–1200 mm), and frost-free periods. Sensitive to frost, waterlogging, and certain soil conditions, maize performs best in silt loam soils with pH 5.5–7.0. Used at various growth stages, it provides green fodder, silage, sweet corn, and roasted kernels [2]. The maize kernel consists of four parts: pericarp, aleurone layer, endosperm, and embryo, each contributing to its nutritional and reproductive functions.
Corn husk
Corn husks are an abundant by-product of corn processing, making up 10–14% of its total fiber. They are rich in cellulose, hemicellulose, and arabinoxylan (70%), making them suitable for producing dietary fiber and xylo-oligosaccharides. They also contain ferulic acid, a powerful antioxidant, which protects DNA and proteins from oxidative damage. Unlike other grain husks, corn husks have lower phytic acid, benefiting mineral metabolism. However, untreated corn husks can cause gastrointestinal discomfort due to insoluble fiber. Deep processing enhances their nutritional value and creates economically beneficial products [3].
Nutritional value of maize
The maize kernel is a nutritious part of the plant, rich in vitamins (A, C, E, K, and B-complex), minerals like potassium, and phytochemicals such as carotenoids and phenolic compounds. Its germ contains 45–50% oil, high in polyunsaturated fatty acids and tocopherols, particularly γ-tocopherol, which supports heart health and immunity. Yellow maize grains are abundant in carotenoid pigments, enhancing skin, hair, and thyroid function. Additionally, maize silk offers essential components like oils, resin, and fibers. Maize oil and B-complex vitamins improve joint mobility, digestion, and cardiovascular health, while potassium supports diuretic properties [4].
Chemical composition
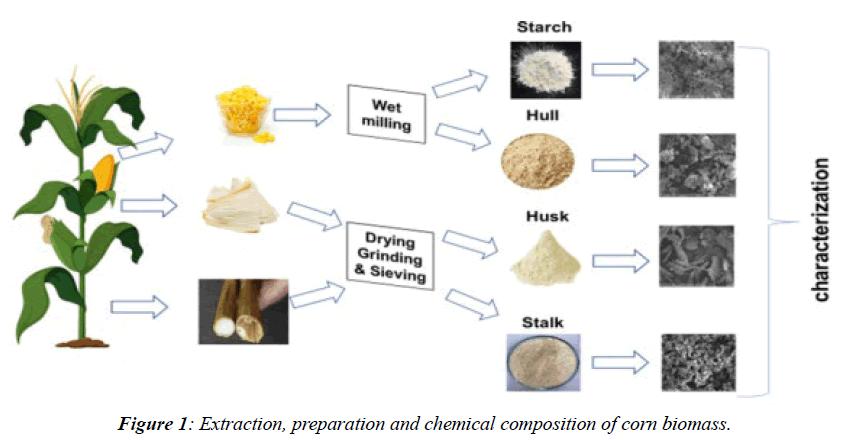
Corn fibre consists of about 70% carbohydrates, including cellulose, xylan, and residual starch, along with lignin, protein, and phenolic acids. Its glucan content (30–35%) is comparable to corn stover and cob but primarily originates from starch rather than cellulose (Table 1). Composition varies with corn variety and production location (Figure 1) [5].
| Component | Composition (% dry weight) |
|---|---|
| Starch | 16 |
| Cellulose | 14 |
| Hemicellulose(total) | 39 |
| Xylose | 18 |
| Arabinose | 12 |
| Galactose | 3.3 |
| Mannose + Rhamnose | 2.0 |
| Glucuronic acid | 3.7 |
| Ferulic acid(easters) | 3.1 |
| Coumaric acid (easters) | 0.3 |
| Acetic acid(easters) | 3.2 |
| Protein | 10 |
| Lignin | 5.7 |
Table 1. Chemical composition (%) of corn fibre
Important Factors in Production of Bio Ethanol From other lignocellulosic Waste
Bioethanol, a renewable energy source, is produced mainly via sugar fermentation and chemical processes, offering a sustainable alternative to fossil fuels. Agricultural and lignocellulosic wastes, such as corn husks, guinea corn husks, and millet husks, are promising feedstocks for bioethanol production, reducing reliance on food crops and mitigating waste pollution. Methods like acid hydrolysis and fermentation with microbes (e.g., Aspergillus niger and Zymomonas mobilis) are used to convert these residues into ethanol. Bioethanol is environmentally beneficial, as it emits no net CO2 and reduces greenhouse gases, with flexible fuel blends like E10 and E85 already in use [6].
Different pretreatment techniques used in pretreatment of corn husk
The complex structure of corn fiber necessitates pre-treatment to improve enzymatic hydrolysis by disrupting cellulose crystallinity, removing lignin, and breaking down hemicelluloses. Physical methods like milling or extrusion increase surface area and reduce particle size but are energy-intensive.
Physico-chemical approaches, including steam explosion, ammonia fiber explosion (AFEX), and liquid hot water (LHW), loosen biomass structure and dissolve hemicelluloses, with varying energy and cost implications. Chemical methods, such as acid or alkali treatments, hydrolyze hemicelluloses but may generate inhibitory by-products and require careful handling [7].
Biological methods use fungi for eco-friendly pre-treatment but are slow. Effective strategies focus on degrading hemicellulose without producing inhibitors to enhance enzymatic digestibility.
Bio-ethanol generations
First-generation bioethanol is produced from food crops like corn and sugarcane, using starch and sugar, but raises concerns about competition with food production and environmental issues like water depletion and soil degradation.
Second-generation bioethanol is derived from non-food sources, mainly lignocellulosic biomass, such as agricultural waste, industrial by-products, and dedicated energy crops. It avoids food competition and is more sustainable, though converting lignocellulose into fermentable sugars is challenging [8].
Third-generation bioethanol uses microalgae or microorganisms, helping reduce CO2 emissions by converting waste and CO2 into biofuels like bioethanol and biogas, although the production process remains complex and yields are low.
Fermentation
Pre-treatment is a most important step of bioethanol production, due to this step lignocellulosic biomass is converted to simple sugars which is further fermented into bioethanol and then distillation or purification. The carbohydrate polymer is break down into simple sugary unit pentose and hexose sugars, the hexose sugar is easily fermented by microbes in to bioethanol but fermentation of pentose sugars is done by only a few microorganism strains. Therefore, enough research has been conducted in recombinant organism for production of strains that are able to ferment both glucose and xylose into different important chemicals. The method by which hemicelluloses and cellulose breakdown in its sugary units and these sugary units is fermented into bioethanol by the microorganisms at the same time is called simultaneous saccharification and fermentation (SSF). Therefore, the SSF is an ideal way for making the biofuel and chemicals because this is economically feasible and both reactions such as hydrolysis and fermentation preformed in same reactor. This method of bioethanol formation includes conversion of fermented sugars into bioethanol followed by distillation process. Meanwhile, fermented CO2 is emitted as a by-product. Therefore, there are different types of feedstocks that are mainly used for fermentation process and some by-products are released from sugar industries like molasses. While some feedstocks are fermented directly while other feedstocks need to be fermented or processed into fermented sugars [9].
Production of ethanol directly from fermentable feedstocks includes molasses, produced directly from the sugar industry, consist of 45–50% TRS or total reducing sugars and it is considered as a major feedstock for production of bioethanol in India. Therefore, on the basis of the efficiency of recovery of sugar from sugarcane in different sugar mills, different grades of molasses are produced as ‘A’ grade molasses which contains more than 50% total reducing sugars, the ‘B’ grade molasses contains about 45– 50% total reducing sugars and ‘C’ grade molasses contains 40–45% total reducing sugars (TRS). Molasses is commonly used in India for production of bioethanol because of its higher efficiency, easy fermentation and cheap cost. Therefore, the ‘B’ grade molasses is commonly utilized for production of bioethanol in India. The ‘B’ grade molasses contains about 45– 50% TRS. Fermentation of bioethanol can be carried out in batch, fed-batch, repeated batch or continuous mode. In batch process, substrate is provided at the beginning of the process without addition or removal of the medium.
Solid-state fermentation
Solid state fermentation or (SSF) is a type of fermentation in which the microbes will grow in solid media but moisture is required at optimum level to support the growth of bacteria and fungi in the absence of free-flowing water. Therefore, the lower moisture content signifies that the fermentation can be carried out by a restricted number of the microbes, majorly, by fungi and yeasts, in spite of that some of the bacteria’s can be used. Among these microbes, fungi are considered to be the most adapted towards SSF because they can develop and penetrate their hyphae on and into inner surfaces particle and thereby colonizes the solid substrates. Therefore, the nature of the solid substrate is considered as one of the most essential factors which affects SSF processes and its selection rely upon many factors mainly related with availability and cost. The SSF processes have been appeared particularly suitable route for the production of enzymes by filamentous fungi so they offer natural habitats on which fungus grows better. An alternative to traditional submerged fermentation (SmF), SSF have advantages of improved yields, cost competitive, easier products recovery, and lack of foam formation. Furthermore, due to low water contents, contamination risks were significantly eliminated and subsequently the volume of residual wastes also decreases. Therefore, the major drawback of this type of cultivation concerns the scale up of the process, largely due to culture homogeneity problems and heat transfer. Many studies have been conducted towards the development of bioreactors for SSF systems. Therefore, to overcome this obstacle many studies have been performed by utilizing the SSF systems for the fabrication of various compounds of interest, constituting organic acids, enzymes, and flavours etc [10].
Submerged fermentation (SmF)
Submerged fermentation is a type of fermentation in which number of microbes is used for the process of fermentation. In the SmF, the composition of fermentation media has a liquid medium, source of sugar and nutrients. Submerged fermentation is an attractive system for bioethanol production due to different characters which are; (i) the fermentation media is uniform in distribution, (ii) all conditions are favourable for microbe growth, (iii) in this system we can easily modify the growth conditions just like- temperature, oxygen, pH, uniform distribution of media and composition of media, and (iv) we can also maintain the temperature by thermal conductivity. Therefore, submerged cultivation includes numerous microbial strains like bacteria, algae fungi and yeast. Media which are used for process it may be synthetic or we can also use lignocellulose residue after hydrolysis. The sugars which are released from lignocellulosic structure can be fermented by use of different microbes into different products of industrial importance by submerged fermentation systems, including ethanol, organic acids, glycerol, butanol, and food additives, etc. Therefore, the conversion of these hydrolysates needs considerable attention because higher yield and productivity can be achieved. Generally, the process of hydrolysis is not only employed for extraction of sugars from different structures of lignocellulose, but also for extraction of wide range of compounds proceeding from the lignin or they are originated from degradation of sugars. Therefore, their concentration solely relies on type of raw material and hydrolysis process used [11].
Separate hydrolysis and fermentation (SHF)
Separate Hydrolysis and Fermentation (SHF) is a process in which saccharification or enzymatic hydrolysis of polysaccharides and fermentation by use of microbes that are carried out sequentially in separate units. The major advantage of using this process is that the fermentation and hydrolysis both are carried out efficiently at their own optimum pH and temperature.
Simultaneous saccharification and fermentation (SSF)
In this process, hydrolysis and fermentation carried out simultaneously i.e., simultaneous saccharification and fermentation (SSF), which means released sugars, is directly used by microbes. This process is more favourable due to the lower capital cost and free from the risk of contamination. The reactor design is simple, convenient because two processes are performed in the same reactor. Which result in increased equipment and operation cost, but the different conditions for two stages including the temperature cycle, pH & other conditions will make the two reactions difficult to operate at the same time. SSF has major drawback that the fermentation and enzymatic hydrolysis need to be performed under specialized conditions, especially with respect to optimum temperature and pH because these conditions always vary. Therefore, hydrolysis is generally rating limiting process in SSF and the optimal temperature of enzyme reaction is much higher than that of fermentation. The major disadvantage of using SSF process is the inhibition of ethanol accumulation over microbes and enzymes [12].
Simultaneous saccharification and co-fermentation (SSCF)
Simultaneous saccharification and co-fermentation (SSCF) is the process in which the saccharification is carried out simultaneously with the co-fermentation of sugars like pentose and hexose sugars. Hence, the microbes are not able to utilize complete media because are they incapable to ferment pentose sugars. Therefore, in SSCF process microbes are able to ferment both pentose and hexose. This process can be operated with fed batch fermentation and at high content of water insoluble solids which simplifies mixing and higher ethanol yield. This process also helps to maintain low concentration of glucose, thereby allows efficient co-fermentation of xylose and glucose [13].
In this fermentation the pre-treated substrate is hydrolysed by enzymes/microbes in to the oligomers after in same reactor after the fermentation, sugar (pentose and hexose) is converted to ethanol. For the fermentation of both pentose and hexose sugar required a both type of microbial strain which can efficiently convert the both sugars in to bioethanol [14].
Materials and Methods
Collection and Preparation of sample
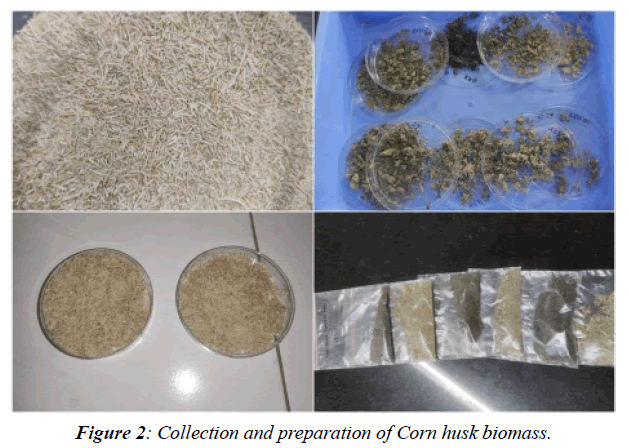
Wastage corn husk were collected in plastic bags from near the damana market and also from near KIMS hospital and were washed before use. Analytical grade chemical, sulphuric acid (H2SO4), sodium hydroxide (NAOH), and distilled water were used in the experiment (Figure 2).
Chemicals
Pure and analytical grade chemicals were used in all experiments including media preparation for growth. sulfuric acid (H2SO4),sodium hydroxide (NaOH), DNSa (3,4-Dinitrosalicylic acid).
Glassware and apparatus
All glass wares (conical flasks, round bottom flask, measuring cylinders, beakers, Petri plates and test tubes, pipette etc.) were procured from borosil. The equipment was used plastic bags, a steel knife, oven, grinder, electronic balance, digital pH meter (Model Hanna Instruments). Autoclave (Schimadu UV-1700), incubator (UNIQUAC), water bath, centrifuge (eitek TC 650 D). The instrument and apparatus used throughout the experiment was up to the research standard.
Experimental design
The Box-behnken method of RSM (Response surface methodology) was selected for pre-treatment and enzymatic hydrolysis. The optimization of four variables such as substrate concentration (g) acid concentration (% v/v), temperature (°C) and time (min) were take place for treatment. Similarly for enzymatic hydrolysis four parameters are used like temperature (°C) incubation time (hrs), enzymatic concentration (ul) and pH. For pre-treatmentfour variables and16runs were conducted to produce fermentable sugar in two sets which included sulfuric acid (H2SO4) and sodium hydroxide (NaOH) and for enzymatic hydrolysis four variables and 16runs were conducted for to produce glucose and xylose (mg/g) [15].
Cellulose content analysis
For cellulose estimation, Ig of sample was mixed with three millilitres nitric reagent and was placed in a water bath at 100 °C for 30 min. The samples in tubes were then cooled and centrifuged at 5000 rpm for 15-20 min. The residue content was washed with distilled water and 67% sulphuric acid (10 ml) was added to the washed residue which was incubated for 1 hour. From this solution, 1 ml of the sample was taken and the volume was made 100 ml using distilled water. Then from this 100 ml solution, 1 ml was taken to which 10 ml of anthrone reagent was added. The resulting solution was incubated in a water bath at 100°C for 10 min and then cooled to room temperature. The absorbance was measured at 630 nm.
Hemicellulose content analysis
Hemicellulose content in the biomass was estimated, by mixing1 g of the dried biomass samples to 10 ml of 3 % w/v H2SO4. The mixture was autoclaved at 121°C with 6.803 kg pressure. After autoclaving the samples, the pH was adjusted to 7.0 with addition of distilled water making the total volume to 100 ml. 5 ml of p-bromoaniline was added to the above mixture and the sample was incubated at 70°C for 10 min. It was then incubated in the dark for 70 min and the absorbance was taken at 540 nm. The ASL and AIL content of the biomass was analysed by using NREL protocol. Dried biomass (300mg) was taken in glass pressure tubes and 3 ml of 72 % H2SO4. (w/w) was added and kept at 30 °C for 2 h. The samples were mixed properly at 30 min time intervals for proper acid hydrolysis Followed by the hydrolysis step, the total volume was brought to 87 ml(with double distilled water) and the samples were autoclaved at 121°C for 1 h Further, these samples (after cooling at room temperature) were filtered through a vacuum pump using a filtering crucible. The ASL fraction was determined by measuring the absorbance at 240 nm. The AIL was determined using de ionized water to transfer all the residual solids out of the pressure tube into the filtering crucible. The solids were rinsed thoroughly with a minimum of 50 mi hot de-ionized water. The crucible and acid insoluble residue were dried at 105 "C until a constant weight was achieved [16]. The samples were kept in the oven and cooled in desiccators. The weight of the crucible and dry residue was measured. The crucibles and residue were kept in the muffle fumace at 575 25 °C for 24+ 6 h.
Lignin content analysis
The ASL and AIL content of the biomass was analysed by using NREL protocol (Sluiter, 2008). Dried biomass (300mg) was taken in glass pressure tubes and 3 ml of 72% H2SO4, (w/w) was added and kept at 30 °C for 2 h. The samples were mixed properly at 30 min time intervals for proper acid hydrolysis. Followed by the hydrolysis step, the total volume was brought to 87 ml (with double distilled water) and the samples were autoclaved at 121°C for 1 h. Further, these samples (after cooling at room temperature) were filtered through a vacuum pump using a filtering crucible. The ASL fraction was determined by measuring the absorbance at 240 nm. The All was determined using de-ionized water to transfer all the residual solids out of the pressure tube into the filtering crucible. The solids were rinsed thoroughly with a minimum of 50 ml hot de-ionized water [17]. The crucible and acid insoluble residue were dried at 105 °C until a constant weight was achieved. The samples were kept in the oven and cooled in desiccators. The weight of the crucible and dry residue was measured. The crucibles and residue were kept in the muffle furnace at 575+25 °C for 24+ 6 h.
Assessment of pretreated corn husk using FTIR AND SEM
FTIR spectra and SEM analysis were undertaken in order to inspect the structural variations in the physical and chemical features of the untreated and pretreated lignocellulosic biomasses (HNG and DG). For FTIR analyses, the spectra of the untreated and pretreated lignocellulosic biomasses in the KBr phase were recorded in a Perklin FTIR spectrophotometer, with a nominal resolution of 2 cm−one averaging 44 scans. SEM analysis was used to investigate the structural characterization of native, acid pretreated and ultrasonication assisted acid pretreated grass varieties. A SEM (M- Spectrum Two S. No- 104789) was used for the analyses [18]. The detector used for SEM was Secondary Electron; Semiconductor Back-scattered Electrons (Quad type)* and Cathodoluminescence detector, respectively. The samples were mounted in very thin layers over the copper sample holder which was gold coated and then analyzed for the morphological changes. SEM and FTIR were carried out using scanning electron microscope of OUAT, Bhubaneswar using NIOS2 software. The variations in the configuration of lignocellulosic biomass before and after pretreatments can be monitored using FTIR spectroscopy. The FTIR spectra of untreated, acid treated and acid along with ultrasonication pretreatment DG and HNG were assessed. Similar results were observed in FTIR study of newspaper [19].
RSM for optimization of enzymatic hydrolysis of pretreated corn husk
For enzymatic hydrolysis RSM method is applied. The best pretreated corn husk sample is made up to 135g and divided into 27 segments each containg 5g of pretreated rice straw. 100ml of Na-citrate buffer were added to each of these parts with variable pH ranging 5.5, 6.5 and 7.5; these were mixed thoroughly to form mixtures. Enzyme containg hemi cellulase and cellulase were added with different amount ranging (in μl) 100, 175 and 250 to different mixtures. Then all the mixtures were incubated according to their condition of time spanning 12hrs , 18hrs and 24 hrs with temperatures ranging 45.0°C, 52.5°C and 60°C. The enzyme breaks cellulose and hemicellulose in glucose and xylose respectively. The glucose and xylose contents were analyzed for all the 27 samples and with highest content sugars totally were taken for fermentation.
Results and Discussion
Pre-treatment of corn husk using acid hydrolysis (H2SO4)
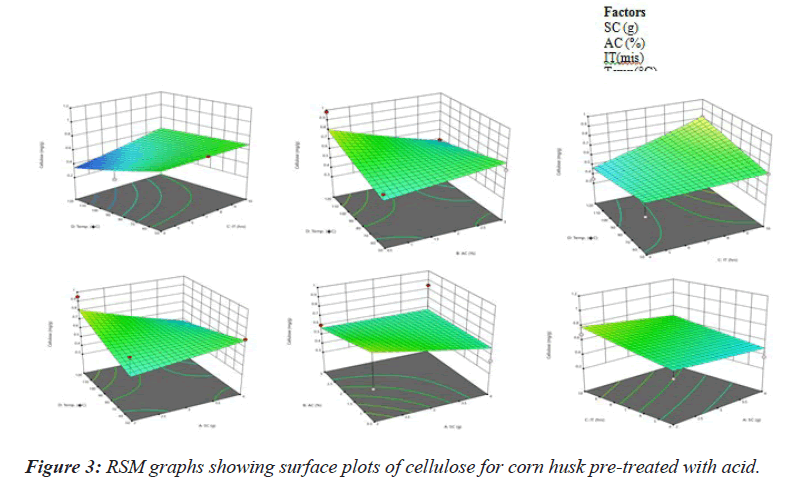
In total, sixteen experiments were conducted for pre-treatment of corn husk samples pre-treated with Sulphuric acid (H2SO4). The (Response surface methodology) RSM method was followed for conducting the experiments. The main effect plot for cellulose, hemicellulose and lignin on RSM graph of the different parameters such as incubation Time (IT), temperature (C), substrate concentration (g), acid concentration (%) on corn husk pre-treated with sulphuric acid (H2SO4).
Cellulose estimation from acid pretreated corn husks using RSM method
It represents the effect of different parameters on cellulose concentration (Figure 3). It is observed that SC i,e. 4gm and temperature i.e. 60°C has the highest effect while incubation time and acid concentration has the least effect on cellulose exposure (Table 2). Therefore, further optimization of temperature of alkali concentration will be required to obtain the optimum value of both.
| S.I.No. | Substrate concentration | Acidic concentration (%) | Incubation time(min) | Temperature | Cellulose(mg\g) | Hemicellulose (mg\gm) | Lignin (mg\gm) |
|---|---|---|---|---|---|---|---|
| 1 | 2 | 0.5 | 40 | 60 | 0.845 | 0.381 | 14.2 |
| 2 | 3 | 1.25 | 50 | 90 | 0.72 | 0.39 | 15.2 |
| 3 | 4 | 0.5 | 40 | 60 | 0.997 | 0.393 | 12.1 |
| 4 | 2 | 2 | 60 | 60 | 0.691 | 0.276 | 10.9 |
| 5 | 4 | 2 | 40 | 60 | 0.975 | 0.361 | 12.8 |
| 6 | 2 | 2 | 40 | 60 | 0.691 | 0.269 | 13.2 |
| 7 | 5 | 1.25 | 50 | 90 | 0.62 | 0.397 | 14.1 |
| 8 | 3 | 1.25 | 50 | 90 | 0.598 | 0.151 | 19.9 |
| 9 | 2 | 0.5 | 60 | 120 | 0.747 | 0.399 | 16.1 |
| 10 | 2 | 0.5 | 40 | 120 | 0.346 | 0.201 | 17.1 |
| 11 | 4 | 2 | 40 | 120 | 0.367 | 0.35 | 15.9 |
| 12 | 2 | 2 | 60 | 120 | 0.461 | 0.401 | 14.7 |
| 13 | 2 | 0.5 | 60 | 60 | 0.813 | 0.273 | 11.6 |
| 14 | 4 | 0.5 | 40 | 120 | 0.603 | 0.443 | 9.3 |
| 15 | 3 | 1.25 | 50 | 90 | 0.527 | 0.248 | 12.5 |
| 16 | 3 | 1.25 | 50 | 90 | 0.33 | 0.213 | 11.8 |
Table 2. RSM table for acidic pretreatment of corn husk
Hemicellulose estimation from corn husks using RSM method
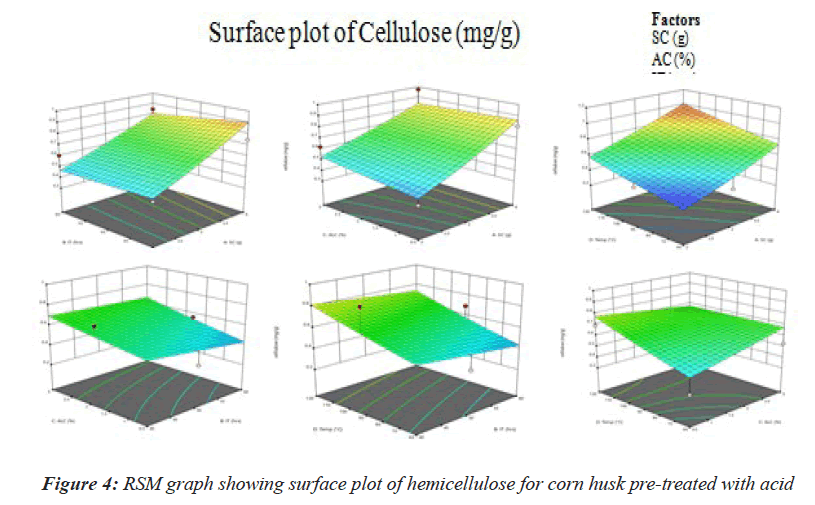
This represents the effect of different parameters on hemicellulose concentration. It is observed that Temperature (60°C) and acid concentration (2%) has the highest effect while SC (g) and IT (mins) has the least effect on cellulose exposure. Therefore further optimization of temperature of alkali concentration will be required to obtain the optimum value of both (Figure 4).
Estimation of lignin from corn husks by RSM method
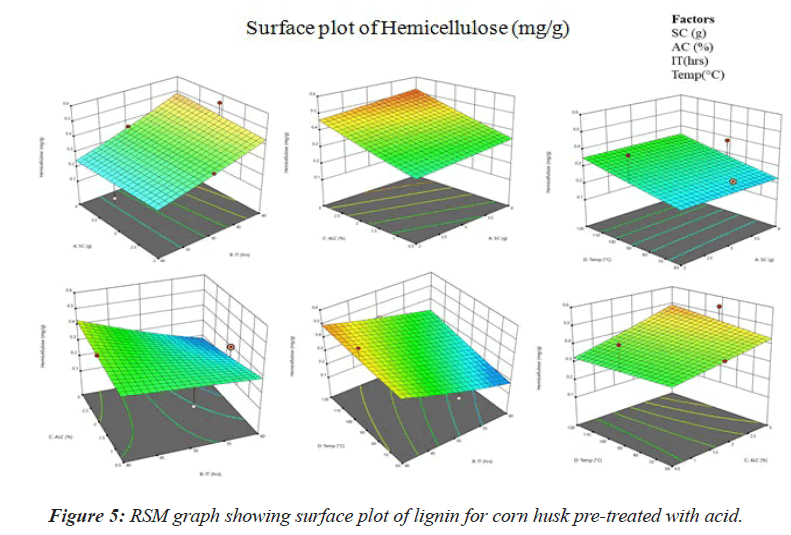
A represents the effect of different parameters on lignin concentration. It is observed that temperature (60 °C) and acid concentration (2%) has the highest effect while SC (4g) and incubation time (40 mins) has the least effect on cellulose exposure. Therefore further optimization of temperature of alkali concentration will be required to obtain the optimum value of both (Figure 5).
Residual probability and predicted Values of RSM model (ANOVA)
To determine whether the model satisfies the assumptions of the analysis of variance (ANOVA) this is shown in Tables. The probabilities (P-Values) were used a device to check the significance is co efficient which shows the strength of each parameter. The smaller the p-values show larger significance of interaction. The model F- values implies the model is significant.
Pre-treatment of corn husk using alkali hydrolysis (NaOH)
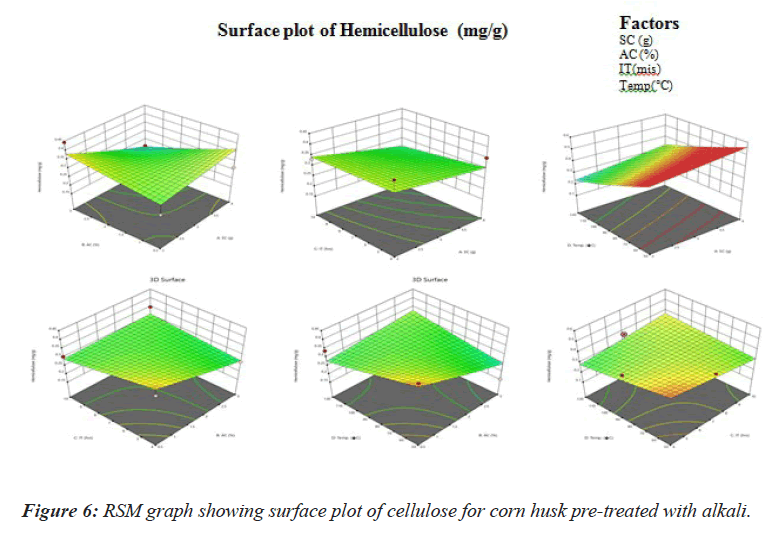
In total, sixteen experiments were conducted for pre-treatment of corn husk samples pre-treated with Sodium hydroxide (NaOH). The (Response surface methodology) RSM method was followed for conducting the experiments. The (Figure 6) represents the main effect plot for cellulose, hemicellulose and lignin on RSM graph of the different parameters such as incubation Time (IT), temperature (C), substrate concentration.
Hemicellulose estimation from corn husks using RSM method
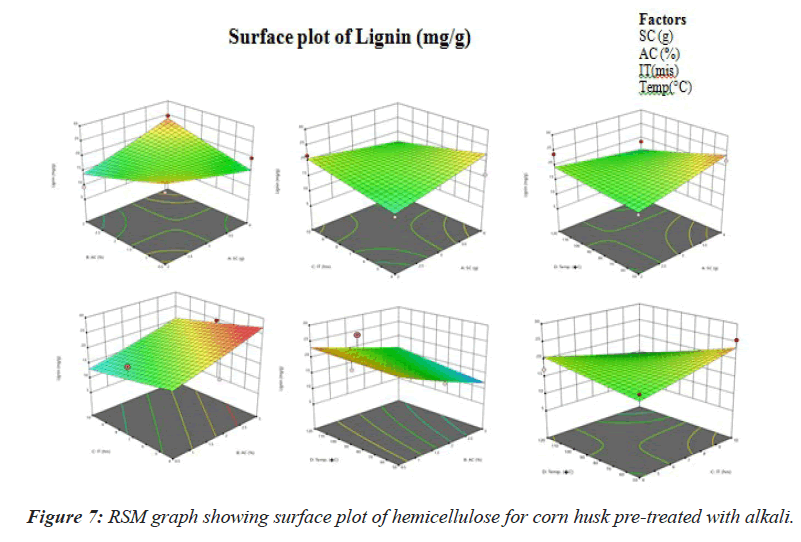
It represents the effect of different parameters on hemicellulose concentration (Figure 7). It is observed that Temperature (85°C) and alkali concentration (1.75%) has the highest effect while SC (g) and IT (mins) has the least effect on cellulose exposure. Therefore further optimization of temperature of alkali concentration will be required to obtain the optimum value of both.
Estimation of lignin from corn husks by RSM method
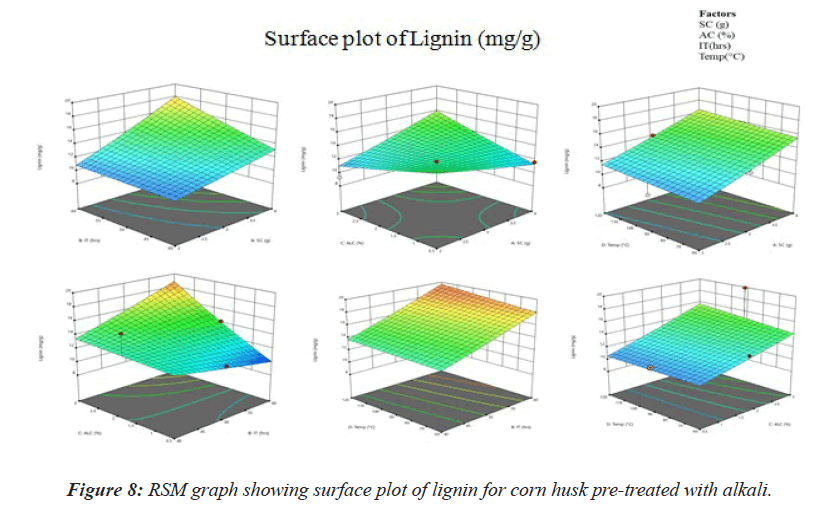
A represents the effect of different parameters on lignin concentration. It is observed that temperature (85°C) and alkali concentration (1.75%) has the highest effect while SC (3g) and incubation time (7hrs) has the least effect on cellulose exposure. Therefore further optimization of temperature of alkali concentration will be be required to obtain the optimum value of both required to obtain the optimum value of both (Figure 8).
Residual probability and predicted Values of RSM model (ANOVA)
To determine whether the model satisfies the assumptions of the analysis of variance (ANOVA) which is shown in Tables.The probabilities (P-Values) were used a device to check the significance is co efficient which shows the strength of each parameter. The smaller the p-values show larger significance of interaction. The model F- values implies the model is significant.
Assessment of pre-treated corn husks using SEM and FTIR analysis
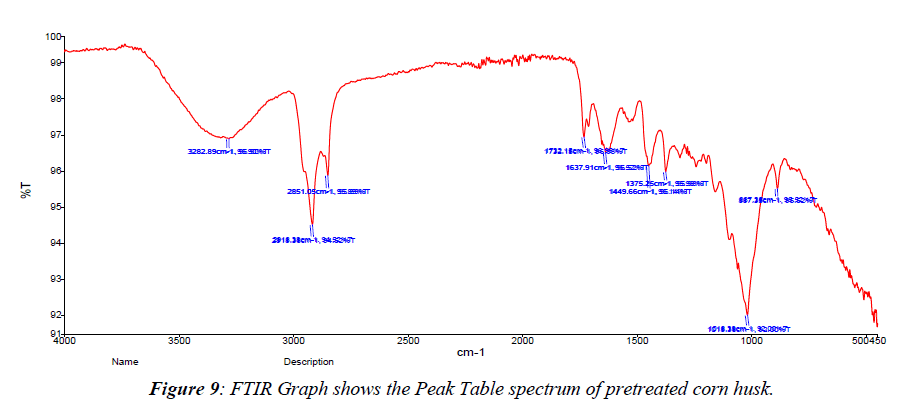
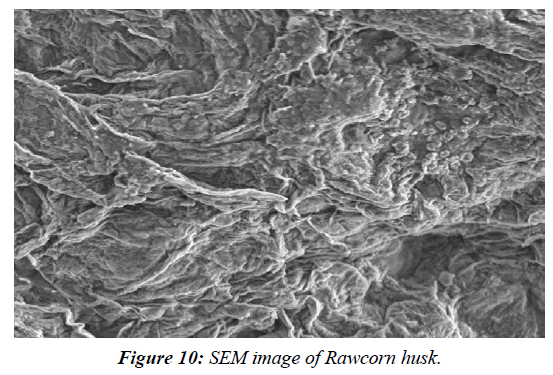
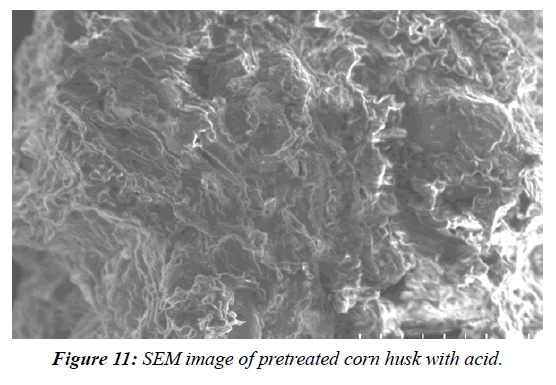
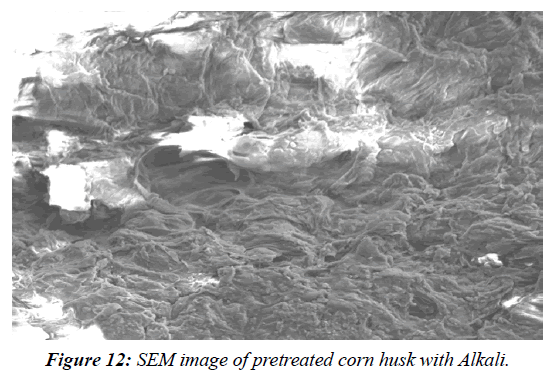
SEM analysis was used to investigate the structural characterization of native, acid pre-treated and raw corn husk. A SEM (Model: spectrum Two, S-104789, Universal ATR) was used for the analyses. The detector used for SEM was Secondary Electron; Semiconductor Back-scattered Electrons (Quad type)* and Cathode luminescence detector, respectively. The samples were mounted in very thin layers over the copper sample holder which was gold coated and then analysed for the morphological changes in OUAT (Bhubaneswar) using software. FTIR spectra analysis were undertaken in order to inspect the structural variations in the physical and chemical features of the untreated and pre-treated lignocellulosic biomasses. For FTIR analyses, the spectra of the untreated and pre-treated lignocellulosic biomasses in the peak values were taken in table and the phase were recorded in a Perklin FTIR spectrophotometer, with a nominal resolution of 2 cm−one averaging 44 scans (Table 3). SEM analysis was used to investigate the structural characterization of native, acid pre-treated (Figure 9- Figure 12).
| Peak No. | X (cm-1) | Y (%T) | Peak No. | X (cm-1) | Y (%T) | Peak No. | X (cm-1) (%T) | Y |
|---|---|---|---|---|---|---|---|---|
| 1 | 3282.89 | 96.9 | 2 | 2918.38 | 94.52 | 3 | 2851.05 | 95.89 |
| 4 | 1732.15 | 96.95 | 5 | 1637.91 | 96.52 | 6 | 1449.66 | 96.14 |
| 7 | 1375.25 | 95.98 | 8 | 1018.38 | 92 | 9 | 887.35 | 95.52 |
Table 3. Peak value table of pretreated corn husk.
Taguchi method of enzymatic hydrolysis of enzyme hydrolysed corn husk
A total of sixteen experiments were conducted using the aforementioned parameters in which glucose and xylose were considered as the response. 16 variable runs were conducted to produce fermentable sugar in two sets which included sulfuric acid (H2SO4) and sodium hydroxide (NaOH) and for enzymatic hydrolysis sixteen variable runs were conducted for to produce glucose and xylose. Corn husk was prepared for each of 16 conditions, containing different amount of crushed sample in 100ml of distilled water in separate flasks, containing variations of temperature ranging 24°C, 37°C, 45°C and 50°C, acid and Enzyme concentration ranging 0.2 to 0.8 micro litres each .The samples were incubated in water bath for 24hrs, 36hrs, 48hrs and 72hrs, according to their respective criterion. The optimal parameters for enzymatic hydrolysis were determined to be pH 6.2, incubation time 48h, enzyme concentration 625μl and temperature 45°C which resulted in 456.15 mg/g glucose and 32.36 mg/g of xylose.
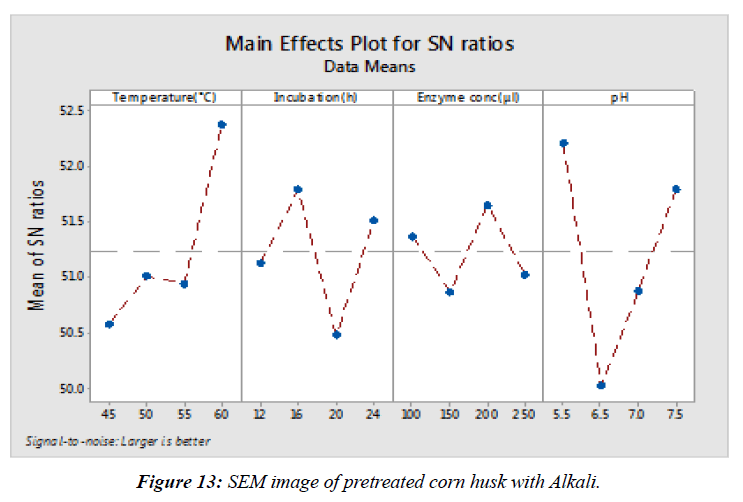
It represents the main effect plots for SN ratio of glucose (mg/g) during enzymatic hydrolysis (Figure 13). They show interaction of each parameter during enzymatic hydrolysis for glucose production. In the figure it is clearly observed that SN ratio for IT and pH comparatively less than SN ratio of temperature and EC. The response table SN ratios show that pH has highest effect on the enzymatic hydrolysis. EC has comparatively less effect on enzymatic hydrolysis than temperature. IT has milder effect on while has the least effect on enzyme concentration. Therefore further optimization of incubation time and enzyme concentration will be required to obtain the optimum value of both. Response Table for Signal to Noise Ratios Larger is better (Table 4).
| Sl.No. | Enzyme conc. | pH | Temperature | Incubation time (hrs) | Gluose(mg/g) | Xylose(mg/g) |
|---|---|---|---|---|---|---|
| 1. | 0.8125 | 4.8 | 45 | 24 | 270.77 | 20.19 |
| 2. | 0.8125 | 5.5 | 50 | 24 | 257.69 | 19.91 |
| 3. | 0.125 | 5.5 | 45 | 48 | 279.62 | 24.62 |
| 4. | 0.8125 | 5.5 | 45 | 36 | 195.77 | 22.26 |
| 5. | 0.625 | 6.2 | 45 | 48 | 456.15 | 32.36 |
| 6. | 1.8125 | 5.5 | 50 | 48 | 354.23 | 24.72 |
| 7. | 0.125 | 5.5 | 50 | 36 | 324.23 | 22.74 |
| 8. | 0.125 | 6.2 | 45 | 36 | 199.23 | 18.40 |
| 9. | 0.8125 | 4.8 | 45 | 48 | 255.00 | 17.64 |
| 10. | 0.8125 | 5.5 | 40 | 48 | 268.08 | 26.98 |
| 11. | 0.8125 | 4.8 | 40 | 36 | 300.77 | 23.02 |
| 12. | 0.8125 | 4.8 | 50 | 36 | 425.00 | 37.83 |
| 13. | 0.125 | 4.8 | 45 | 36 | 367.69 | 32.64 |
| 14. | 0.8125 | 5.5 | 40 | 24 | 240.77 | 11.23 |
Table 4. Enzymatic Hydrolysis of alkali pretreated cornhusk biomass
Normal probability and predicted Taguchi model (ANOVA)
To determine whether the model satisfies the assumptions of the analysis of variance (ANOVA) which is shown (Table 5) .The probabilities (P-Values) were used a device to check the significance is co efficient which shows the strength of each parameter. The smaller the p-values show larger significance of interaction. The model F- values 4.51 implies the model is significant.
| Source | DF | Seq SS | Adj SS | Adj MS | F | P |
|---|---|---|---|---|---|---|
| Temperature(°C | 3 | 7.431 | 7.431 | 2.4772 | 2.94 | 0.200 |
| Incubation(h) | 3 | 3.863 | 3.863 | 1.2878 | 1.53 | 0.368 |
| Enzyme conc(μl) | 3 | 1.460 | 1.460 | 0.4867 | 0.58 | 0.668 |
| pH | 3 | 11.405 | 11.405 | 3.8017 | 4.51 | 0.124 |
| Residual Error | 3 | 2.526 | 2.526 | 0.8421 | ||
| Total | 15 | 26.687 |
Table 5. Analysis of Variance (ANOVA) for SN Ratio
Conclusion
Corn husk biomass which is an industrial waste product has the potential to be an economical feedstock for bioethanol production. However, a series of steps such as pretreatment, enzymatic hydrolysis and fermentation are required for production of bioethanol. In the present study, a comparative study was conducted for alkali and acid pretreatment using RSM design L16 orthogonal array. It was evident from the study that in comparison to acid pretreatment, alkali pretreatment was an effective technique for enhanced delignification (2%) and cellulose exposure (0.965mg/g). Further, Taguchi method was used for determining the optimized parameter for hydrolysis of cellulose and hemicellulose that were exposed after the acidic pretreatment. The optimal parameters for enzymatic hydrolysis were determined to be pH 6.2, incubation time 48h, enzyme concentration 625μl and temperature 45°C which resulted in 456.15 mg/g glucose and 32.36mg/g of xylose. The pretreated and enzyme hydrolyzed samples were analysed and having a potential amount of simple sugar that can be used for fermentation to produce suitable amount of ethanol. It is evident from this study that, corn husk has tremendous potential to be an economical feedstock for biorefinery based bioethanol concept.
References
- Aditiya HB, Mahlia TM, Chong WT, et al. Second generation bioethanol production: A critical review. Renew Sust Energ Rev. 2016;66:631-53.
- Alvira P, Tomás-Pejó E, Ballesteros M, et al. Pretreatment technologies for an efficient bioethanol production process based on enzymatic hydrolysis: a review. Bioresour Technol. 2010;101(13):4851-61.
- Bahrani S, Raeissi S, Sarshar M. Experimental investigation of ionic liquid pretreatment of sugarcane bagasse with 1, 3-dimethylimadazolium dimethyl phosphate. Bioresour Technol. 2015;185:411-5.
- Beri D, York WS, Lynd LR, et al. Development of a thermophilic coculture for corn fiber conversion to ethanol. Nat Commun. 2020;11(1):1937.
- Chatterjee S, Sharma S, Prasad RK, et al. Cellulase enzyme based biodegradation of cellulosic materials: an overview. Cellulose. 2015 (6):271-82.
- De Gonzalo G, Colpa DI, Habib MH, et al. Bacterial enzymes involved in lignin degradation. J Biotech. 2016;236:110-9.
- Farnham DE, Benson GO, Pearce RB. Corn perspective and culture.
- Hang YD, Woodams EE. Corn Husks: A Potential Substrate For Production Of Citric Acid By Aspergillus Niger. LWT-Food Sci and Technol. 2000;33(7):520-1.
- Kang J, Guo Q, Shi YC. NMR and methylation analysis of hemicellulose purified from corn bran.F ood Hydrocoll. 2019;94:613-21.
- Limayem A, Ricke SC. Lignocellulosic biomass for bioethanol production: current perspectives, potential issues and future prospects. PECS. 2012;38(4):449-67.
- Lin M, Ryu GH. Effects of thermomechanical extrusion and particle size reduction on bioconversion rate of corn fiber for ethanol production. Cereal Chem. 2014;91(4):366-73.
- Mankar AR, Pandey A, Modak A, et al. Pretreatment of lignocellulosic biomass: A review on recent advances. Bioresour Technol. 2021;334:125235.
- Mendonca S, Grossmann MV, et al. Corn bran as a fibre source in expanded snacks. LWT-Food Science and Technology. 2000;33(1):2-8.
- Nair RB, Lennartsson PR, Taherzadeh MJ. Bioethanol production from agricultural and municipal wastes. InCurrent developments in biotechnology and bioengineering 2017 (pp. 157-190). Elsevier.
- Orthoefer F, Eastman J, List G, et al. Corn oil: composition, processing and utilization. Corn Chemistry and Technology. Minnesota: AACC International, Inc. 2003:671-94.
- Paliwal RL, Granados G, Lafitte HR, et al. Tropical maize: improvement and production. 2000.
- Qing Q, Hu R, He Y, et al. Investigation of a novel acid-catalyzed ionic liquid pretreatment method to improve biomass enzymatic hydrolysis conversion. Appl Microbiol Biotechnol. 2014;98:5275-86.
- Reddy N, Yang Y. Biofibers from agricultural byproducts for industrial applications. Trends Biotechnol. 2005;23(1):22-7.
- Sun Y, Zhang Z, Cheng L, et al. Polysaccharides confer benefits in immune regulation and multiple sclerosis by interacting with gut microbiota. Food Res Int. 2021;149:110675.
Indexed at, Google Scholar, Cross Ref
Indexed at, Google Scholar, Cross Ref
Indexed at, Google Scholar, Cross Ref
Indexed at, Google Scholar, Cross Ref
Indexed at, Google Scholar, Cross Ref
Indexed at, Google Scholar, Cross Ref
Indexed at, Google Scholar, Cross Ref
Indexed at, Google Scholar, Cross Ref
Indexed at, Google Scholar, Cross Ref
Indexed at, Google Scholar, Cross Ref
Indexed at, Google Scholar, Cross Ref
Indexed at, Google Scholar, Cross Ref
Indexed at, Google Scholar, Cross Ref
Indexed at, Google Scholar, Cross Ref
