Research Article - Journal of Food Nutrition and Health (2023) Volume 6, Issue 4
Nutritional assessment and role of Dietitian on nutritional status of nephrotic patients
Safia S. Elramli1*, Ala Abdulla2 and Salema Shokri2
1Department of Nutrition, University of Benghazi, Benghazi, Libya
2Department of Public Health, University of Benghazi, Benghazi, Libya
- Corresponding Author:
- Safia S. Elramli
Department of Nutrition
University of Benghazi
Benghazi, UK
E-mail: safiaelramli2015@gmail.com
Received: 27-Jul-2023, Manuscript No. AAJFNH-23-108225; Editor assigned: 29-Jul-2023, Pre QC No. AAJFNH-23-108225(PQ); Reviewed: 12-Aug-2023, QC No. AAJFNH-23-108225; Revised: 17-Aug-2023, Manuscript No. AAJFNH-23-108225(R), Published: 24-Aug-2023,DOI:10.35841/aajfnh-6.4.157
Citation: Elramli SS. Nutritional assessment and role of dietitian on nutritional status of nephrotic patients. J Food Nutr Health. 2023; 6(4):157
Introduction
Nephrotic Syndrome (NS) is a rare clinical condition caused by glomerular filtration barrier damage due to glomerulopathy and is characterized by proteinuria exceeding 3.5 g/day, resulting in hypoalbuminemia, hyperlipidemia, and oedema [1]. The term describes the association of (heavy) proteinuria with peripheral oedema, hypoalbuminemia, and hypercholesterolemia.
Pathophysiological studies have indicated that nephrotic syndrome is associated with a hypercatabolic state expressed as an exacerbated degradation of muscle mass, however, the clinical significance of this phenomenon has not yet been investigated. Pathophysiology of protein metabolism and its regulation in nephrotic syndrome has been studied in detail since the 1950s. It has been found that aside from urinary loss of albumin, an increased fraction of this protein is catabolized in renal tubular cells. The intensified hepatic synthesis is insufficient to counterbalance the overall deficit and the hypoalbuminemia is present until the proteinuria ameliorates .Thus, it has been established that due to a loss of a large amount of protein, a decrease in the general body protein pool is observed in nephrotic patients.
Diagnostic criteria for nephrotic syndrome
There are no established guidelines on the diagnostic workup or management of nephrotic syndrome. Imaging studies are generally not needed, and blood tests should be used selectively to diagnose specific disorders rather than for a broad or unguided workup. Renal biopsy may be useful in some cases to confirm an underlying disease or to identify idiopathic disease that is more likely to respond to corticosteroids.
?Proteinuria greater than 3-3.5 g/24 hour or spot urine protein: creatinine ratio of >300-350 mg/mmol
?Serum albumin <25 g/l
?Clinical evidence of peripheral oedema
?Severe hyperlipidemia (total cholesterol often >10 mmol/l) is often present.
Nephrotic syndrome has an incidence of three new cases per 100 000 each year in adults. It is a relatively rare way for kidney disease to manifest compared with reduced kidney function or microalbuminuria as a complication of systemic diseases, such as diabetes and raised blood pressure. Nephrotic syndrome may be caused by primary (idiopathic) renal disease or by a variety of secondary [2].
Pathophysiology
The underlying pathophysiology of nephrotic syndrome is not completely clear [3]. Although the more intuitive “underfill” mechanism of edema from reduced oncotic pressure caused by marked proteinuria may be the primary mechanism in children with acute nephrotic syndrome, edema in adults may be caused by a more complex mechanism. Massive proteinuria causes renal tubulointerstitial inflammation, with resulting increased sodium retention that overwhelms the physiologic mechanisms for removing edema [4]. Patients may have an “overfilled” or expanded plasma volume in addition to expanded interstitial fluid volume. This may be clinically important if over-rapid diuresis leads to acute renal failure from reduced glomerular blood flow, despite persistent edema.
Management
There are no clinical guidelines and few high-quality studies on the management of nephrotic syndrome in adults. Recommendations are based primarily on early case series, other observational studies, and expert opinion.
Medical management
Diuretics: Diuretics are the mainstay of medical management; however, there is no evidence to guide drug selection or dosage. Based on expert opinion, diuresis should aim for a target weight loss of 1 to 2 lb (0.5 to 1 kg) per day [5]. To avoid acute renal failure or electrolyte disorders.
Ace inhibitors: Angiotensin-Converting Enzyme (ACE) inhibitors have been shown to reduce proteinuria and reduce the risk of progression to renal disease in persons with nephrotic syndrome [6,7]. One study found no improvement in response when corticosteroid treatment was added to treatment with ACE inhibitors.The recommended dosage is unclear, and enalapril (Vasotec) dosages from 2.5 to 20 mg per day were used. Most persons with nephrotic syndrome should be started on ACE inhibitor treatment to reduce proteinuria, regardless of blood pressure [8].
Albumin: Intravenous albumin has been proposed to aid diuresis, because edema may be caused by hypoalbuminemia and resulting oncotic pressures. However, there is no evidence to indicate benefit from treatment with albumin [9], and adverse effects, such as hypertension or pulmonary edema, as well as high cost, limit its use.
Corticosteroids: Treatment with corticosteroids remains controversial in the management of nephrotic syndrome in adults. It has no proven benefit but is recommended in some persons who do not respond to respond to conservative treatment.
Lipid-lowering treatment
A Cochrane review is underway to investigate the benefits and harms of lipid-lowering agents in nephrotic syndrome (10). Some evidence suggests an increased risk of atherogenesis or myocardial infarction in persons with nephrotic syndrome, possibly related to increased lipid levels [10] conservative treatment.
Dietary management of nephrotic syndrome: The main aim of nutritional management of nephrotic syndrome is to replace the protein loss by having an adequate intake of protein; however, high intake of protein must be avoided to prevent tubular damage caused by filtering of the excess proteins.
The amount of protein and fluid a patient with nephrotic syndrome should have depends on the patient’s current condition, age, and weight. It is very important that a nephrologist and/or a renal dietitian be consulted.
Nutrition therapy and role of Dietitian in nephrotic syndrome: Dietitian will advise on the correct amount of protein to eat. As a rule, avoid large serves of these foods. It is common for people who have nephrotic syndrome to have high levels of cholesterol and triglycerides High levels of these blood fats may increase the risk of heart disease. The following advice and instructions should patients follow.
Avoid a high protein diet: Too much protein can worsen urinary protein loss. Individual protein needs should be like those recommended for each CKD stage. For individuals with early phases of CKD, an average of 0.8 g/kg body weight is recommended.
Monitor total sodium intake: Limiting total salt intake is also recommended in the patient with nephrotic syndrome. Goals should include no more than 2,300 milligrams per day to prevent edema and to maintain a healthy blood pressure.
Balance electrolytes to maintain levels within normal limits: Changes with electrolytes such as potassium may occur as part of the nephrotic syndrome. Adjusting dietary intake to help maintain electrolytes within normal range may be needed. With an increased risk for hyperlipidemia due to the nephrotic syndrome, total dietary fat should be evaluated. Limiting total fat intake and avoiding foods high in saturated fat and Tran’s fat is encouraged.
Maintain goal vitamin D levels: Tracking vitamin D level in the patient with impaired kidney function is important because of the many roles this vitamin plays in the body. If insufficient, supplementation should be provided with cholecalciferol or ergocalciferol [11].
Routine assessment of nutritional status
?The assessment of nutritional status should be based on clinical evaluation and biochemical markers. ? Valuable clinical parameters for routine assessment of nutritional status are history of weight loss, percentage of standard weight, BMI, clinical evaluation of muscle and subcutaneous FM, and assessment of co?morbid conditions. ?Valuable biochemical parameters for routine assessment of nutrition are serum albumin, creatinine, and total cholesterol in combination with CRP for the assessment of inflammation. ? Present research was therefore designed to study the prevalence of malnutrition among nephrotic syndrome patients and role of Dietitian advice on the nutritional status of nephrotic patients.
Subjects and Method
Study design, setting and subjects
It was cross-sectional study random sample conducted at Hawari Nephrology Center and OPD nephrology clinic in Alsafwa private Hospital Benghazi-Libya, to determine effect of follow Dietitian advice on nutritional status of nephrotic patients and prevalence of malnutrition among nephrotic patients . Total sample was 35 patients include both Male and females aged 19 years and over with nephrotic syndrome for at least 3 months diagnosed with N.S. from February 2023to June 2023.
The target of study consisted of Subjects who were 19years old and over were selected to the study. All nephrotic patients who gave informed consent or assent were eligible to take part in the study.
Criteria for inclusion the study
The target of study consisted of patients with nephrotic syndrome both male and female with Libyan nationality. All enrolled patients should have completed a minimum of three months duration diagnosed with nephrotic syndrome.
Exclusion criteria
All Patients were severe cardiovascular, respiratory, or liver disease, have infection, on special diet. Patients had nephrotic syndrome with acute or chronic renal failure or end stage renal failure, as well as patients who were hospitalized for more than two weeks had signs of active infection were excluded from the study. Patients from other nationality other than Libyan nationality or patients younger than 19 years old were excluded.
Procedure and Materials
The study will be carried out over 4 month’s period from February 2023to June 2023. The researcher will seek approval to conduct the study and to discuss access with site mangers. Researchers should be set to meet with participants to discuss the study, obtaining an informed consent, measurements, and data collection .Researchers were set to meet with participants the study was explained, and an informed consent obtained. In this study, data of 35 nephrotic patients were collected with a structured questionnaire was used to obtain information on demography, socioeconomic background, medical history. The questionnaire was structured and sectioned into the following sub-headings Demographic data, socioeconomic background, assessment of nutritional status, dietary history, and nutritional compliance for Dietitian advice. SGA tool was employed to assess the level of malnutrition of participants and a 24-hour dietary recall, and ask about follow Dietitian advice were used to estimate dietary intakes and nutritional compliance of participants. The baseline laboratory tests included serum hemoglobin, serum albumin, [total cholesterol, serum creatinine, CRP, serum potassium, sodium, calcium and phosphorus, and serum urea nitrogen. The questionnaire was piloted before commencement of data collection.
Assessment nutritional status
Diagnosis of malnutrition
Clinical symptoms: Pallor, biting spot, pitting oedema, and sever visible wasting.
Body weight: Body weight should always be interpreted under the aspect of the oedema-free normal body weight.
Body Mass Index (BMI)
Calculated from a subject's height and weight, is widely used for categorizing underweight, normal weight, overweight and obesity.
Subjective Global Assessment (SGA): Patients identified to be at nutrition risk require a diagnosis to confirm malnutrition. Subjective global assessment (SGA) is the gold standard for diagnosing malnutrition. SGA is a simple bedside method used to diagnose malnutrition and identify those who would benefit from nutrition care. The assessment includes taking a history of recent intake, weight change, gastrointestinal symptoms, and a clinical evaluation. SGA has been validated in a variety of patient populations. The physical examination includes an evaluation of the patient's muscle mass and subcutaneous fat mass for detection of any fat and muscle wasting. Following these procedures, the nutritional status is classified into three categories by a composite scoring system: normal nutritional status, mild to moderate malnutrition and severe malnutrition [12].
Biochemical and body composition measurements
Serum Albumin Concentration (SA), Total serum protein, Blood urea, Creatinine.
Lipid profile including total cholesterol, Serum level of hemoglobin, serum potassium, sodium, calcium, phosphorus (Pi). Serum albumin level and Body Mass Index (BMI) were the most predictive parameters of malnutrition. However, the nutritional status of patients was assessed by extensive anthropometric measurements and skin fold thickness. Whereas the biochemical markers of nutrition such as serum albumin was unavailable. Full evaluation of anthropometric measurements (weight, height, body mass index, skin fold thickness, neck circumference, waist circumference, hip circumference, and waist hip ratio) was collected. Skin fold thickness SFT is used to check and indicate body fat by using special calliper; but not always dietitian has calliper. There are some alternative methods.
SFT was calculated using the US Navy Method Skin Fold thickness alternative methods [13].
The steps as following:
1. Measure the height.
2. Measure the waist circumference.
3. Measure the neck circumference.
4. Measure the hips circumference if a woman.
5. Calculations.
Men: %Fat = 86.010*LOG (abdomen-neck) - 70.041*LOG (height) + 30.30
Women: %Fat = 163.205*LOG (abdomen+hip-neck) - 97.684*LOG (height) - 104.912 compare to (Table 1).
| Age | Body fat percentage in women | |||
|---|---|---|---|---|
| up to 20 | 11-18 % | 18-23% | 23-30% | 30-35% |
| 21-25 | 12-19% | 19-24% | 24-30% | 30-35% |
| 26-30 | 13-20% | 21-25% | 25-31% | 31-36% |
| 31-35 | 13-21% | 21-26% | 26-33% | 33-36% |
| 36-40 | 14-22% | 22-27% | 27-34% | 34-37% |
| 41-45 | 14-23% | 23-28% | 28-35% | 35-38% |
| 46-50 | 15-24% | 24-30% | 30-36% | 36-38% |
| 51-55 | 16-26% | 26-31% | 31-36% | 36-39% |
| 56 & up | 16-27% | 27-32% | 32-37% | 37-40% |
| Lean | Ideal | Average | OverFat | |
Table 1: US navy method.
Assessment of dietary intake
24Hours recall: Nutritional intakes were obtained from subjects by 24-hour recall. All subjects were interviewed by the researcher and their 24-hour recall were recorded .Then all the food records were compiled and evaluated by food composition table for analysis of nutritional value and assess the amount of nutrients in N.S patients food intake, we analyses the food related to N.S especially protein, fat, sodium intakes and compered it with the recommendation.
Result
The aim of this study was to study the prevalence of malnutrition among patients with nephrotic syndrome and role of Dietitian advice on the nutritional status of nephrotic patients who follow up nephrotic outpatient department (OPD) at Hawari Nephrology Center and Alsafwa private Hospital. A total of 35 nephrotic patients were recruited for the study, the age ranges was between 19-80 years. The results showed the involved in this study are 19 female and 16 males.
Description of study participants and socioeconomic characteristics
The background characteristics of the participants are summarized. A total of 35 participants aged between 19 to 80 years old were enrolled for the study. Out of the total sample, 46% (n=16) respondents were males and 54% (n=19) were Females as shown in table. Most of group in study sample was from Benghazi (71%) were the remaining 28% was from outside of Benghazi. The most of family income in our sample were between800-1000D.L about 17 family (48%) while the family with no income was about 14 family ( 40% ), as well as 3 family (9%) the income was 1000-2000D.L., and family with more than 2000D.L was only one family (3%) .Majority of study sample revealed did not smoke which was 94.3% while other 5.7% were smoke as shows in table below.
The table below demonstrated that the highest percent patients were educated which about 80% while about 20% of patients was illiterate as illustrated. Results reveal that the 14 (40%) of nephrotic patients were unemployed, while about 11(31%) they were housewife, 5 patients (14.3%) were teacher and 5(14.3%) were self-employed. Regarding to marital status, we shown the most of participants in this study was married were about 54%, however, 46% were unmarried as illustrated (Table 2).
| Characteristics | N | % |
|---|---|---|
| Address | ||
| 1-Benghazi | 25 | 71% |
| 2-Out of Benghazi | 10 | 29% |
| Sex | ||
| 1-Male | 16 | 46% |
| 2-Female | 19 | 54% |
| Education | ||
| 1-Educated | 28 | 80% |
| 2-Illetrate | 7 | 20% |
| Occupation | ||
| 1-Teacher | 5 | 14.30% |
| 2-House wife | 11 | 31% |
| 3-self employed | 5 | 14.30% |
| 4- unemployed | 14 | 40% |
| Income | ||
| 1- 800-1000 | 17 | 48% |
| 2- 1000-2000 | 3 | 9% |
| 3->2000 | 1 | 3% |
| 4-No income | 14 | 40% |
| Smoking | ||
| 1-Yes | 2 | 5.70% |
| 2-No | 33 | 94.30% |
| Marital status | ||
| 1-Married | 19 | 54.30% |
| 2-Single | 16 | 45.70% |
Table 2: Demographic characteristics.
Clinical information of the studied patients
Clinical information of the studied patients is presented in (Table 3), (46%) of studied patients reported that they have been do surgeries, however, about 54% they do not. Comorbidity was particularly in this population were reporting two chronic diseases. The most prevalent disease was hypertension 31%, followed by diabetes with hypertension disease (11%), however, about 54% studied patients did not have any chronic disease. Common cause of nephrotic disease in the study patients were mainly idiopathy (66%) followed by unknown cause (23%), other cause like systemic lupus, diabetes was the same percentage 6% as shows in. According to table below shows that the highest number in our sample had family history of chronic disease which was about71%, while the lowest did not have family history of disease which was 29% .Most of our sample did not have family history of renal disease which was 91%%,while only 9% confirmed with family history of renal disease. The result shows that almost patients (94%) had drug abuse whereas about 6% of patients did not have drug abuse.
| Characteristics | N | % |
|---|---|---|
| Past surgery | ||
| 1-yes | 16 | 46% |
| 2-No | 19 | 54% |
| Chronic diseases | ||
| 1-diabetes | 1 | 3% |
| 2-hypertension | 11 | 31% |
| 3-both | 4 | 11% |
| 4-no chronic disease | 9 | 54% |
| Cause of NS | ||
| 1-Diabetes | 2 | 6% |
| 2-systemiclopus | 2 | 6% |
| 3-Idiopathy | 23 | 66% |
| 4-unknown | 8 | 23% |
| Family chronic diseases | ||
| 1-yes | 25 | 71% |
| 2-No | 10 | 29% |
| Renal disease | ||
| 1-Yes | 3 | 9% |
| 2-No | 32 | 91% |
Table 3: Clinical information of nephrotic patients.
Assessment of nutritional status of nephrotic patients
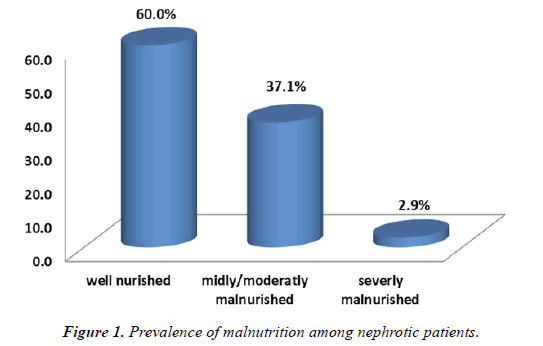
Prevalence of malnutrition using subjective global assessment: Subjective Global Assessment (SGA) score that was originally developed to assess post-operative nutritional state and is one of the methods suggested assessing nutritional status in renal patients. The SGA was suggested by the National Kidney Foundation and has undergone several modifications. The SGA comprises of five criteria, and includes medical history, physical examination, subcutaneous fat, muscle wasting and fluid retention. A score an indicated well nourished, score B mildly to moderately malnourished, score C severely malnourished. The nutritional status of the patients indicated that (60%) were wellnourished while the remaining (37%, 3%) had mild-to-severe malnutrition below (Figure 1).
Association between demographic and clinical variable and SGA: The SGA score was analyzed for association with various demographic and clinical variables.
(Table 4-6) Showed no significant difference in SGA score based on income (P= 0.657), Patients with comorbid condition had un-significant relation with SGA scores (P=0.429).
| Chi-Square Tests | Value | df | Asymp. Sig. (2-sided) |
|---|---|---|---|
| Pearson Chi-Square | 4.145a | 6 | 0.657 |
| Likelihood Ratio | 4.75 | 6 | 0.576 |
| Linear-by-Linear Association | 2.164 | 1 | 0.141 |
| N of Valid Cases | 35 |
Table 4: Association between SGA scores and respondent’s income Chi-Square Tests.
| Chi-Square Tests | Value | df | Asymp. Sig. (2-sided) |
|---|---|---|---|
| Pearson Chi-Square | 5.953a | 6 | 0.429 |
| Likelihood Ratio | 6.708 | 6 | 0.349 |
| Linear-by-Linear Association | 2.039 | 1 | 0.153 |
| N of Valid Cases | 35 |
Table 5: SGA score and comorbidity disease.
Further analysis of SGA score with education level showed that patients had significant positive correlation was found between SGA score and education level as shown in below (P value=0.012).
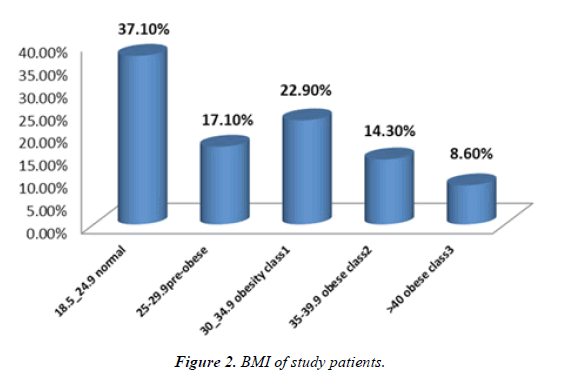
Body mass index in the study patients: Regarding the patient’s BMI 37.1% were within the normal range, 17.1% were overweight, 22.9% were grad1obese, 14.3% grad 2 obese, 8.6% grad 3 obese.
BMI and SGA score: The result demonstrated that there were no significant association was found between a patient’s BMI and SGA score (P value=0.458) (Table 7 and Table 8).Figure 2.
| Chi-Square Tests | Value | df | Asymp. Sig. (2-sided) |
|---|---|---|---|
| Pearson Chi-Square | 8.855a | 2 | 0.012 |
| Likelihood Ratio | 9.043 | 2 | 0.011 |
| Linear-by-Linear Association | 5.169 | 1 | 0.023 |
| N of Valid Cases | 35 |
Table 6: Association between SGA scores and education level.
| 18.5_24.9 Normal | 25-29.9 Pre-obese | 30_34.9 Obesity class1 | 35-39.9 Obese class2 | >40 Obese class3 | ||
|---|---|---|---|---|---|---|
| SGA | Well nurished | 9 | 4 | 3 | 2 | 3 |
| Midly/moderatly Malnurished | 4 | 2 | 4 | 3 | 0 | |
| Severly malnurished | 0 | 0 | 1 | 0 | 0 | |
| Total | 13 | 6 | 8 | 5 | 3 | |
Table 7: Correlation between BMI and SGA score.
| Chi-Square Tests | Value | df | Asymp. Sig. (2-sided) |
|---|---|---|---|
| Pearson Chi-Square | 7.752a | 8 | 0.458 |
| Likelihood Ratio | 8.31 | 8 | 0.404 |
| Linear-by-Linear Association | 0.206 | 1 | 0.65 |
| N of Valid Cases | 35 |
Table 8: Association between SGA scores.
| 24hrs recall method | N | % |
|---|---|---|
| T. Protein | ||
| <40(low) | 7 | 20% |
| 40-70(normal) | 15 | 42.80% |
| >70(high) | 13 | 37.10% |
| T. Fat | ||
| <37 (low) | 25 | 71.40% |
| 38-70(normal) | 6 | 17.10% |
| 71-85( high) | 4 | 11.40% |
| T. Na | ||
| Normal | 2 | 5.70% |
| Low | 33 | 94.30% |
Table 9: Nutrients intake by 24hrs recall.
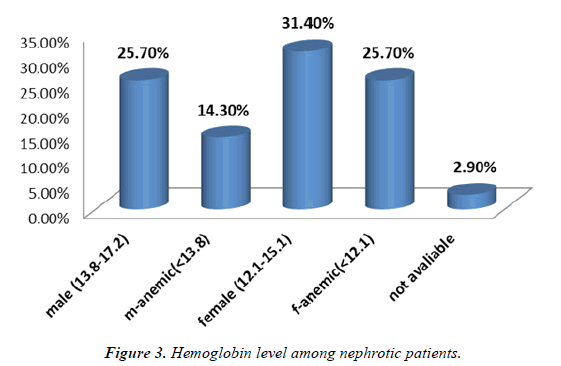
Laboratory investigation: The represented that hemoglobin level regarding both sexes, the percent of normal level of HBG among male group was 25.7%as well as the percent of male patients with low level of HBG and had anemia was 14.3%. About female group, 31.4% of female in our sample had HBG with normal level, while the female with low HBG level and had anemia was 25.7%, about 2.9% of our sample were missing HBG investigation.
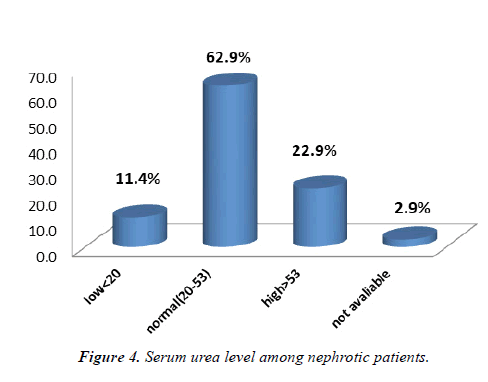
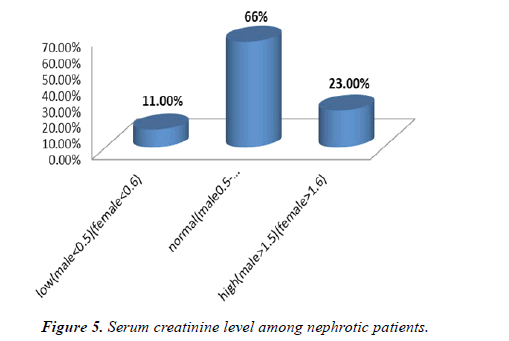
Our result shows that most of patients in our sample had normal blood urea (20-53mg/dl) which about 62.9%, while 22.9% of study sample had high blood urea (more than 53mg/dl), other 11.4% of patients had low serum urea (less than 20m9/dl) due to dehydration, the rest of our sample (2.9%) the investigation was unavailable(Figure 3). With regard the creatinine serum level, we shown the most of patients both male and female had normal creatinine level which about 66%, whereas 23% of both groups had high creatinine level. The remaining 11% of study sample had low serum creatinine level in both sexes as illustrates in (Figure 4).
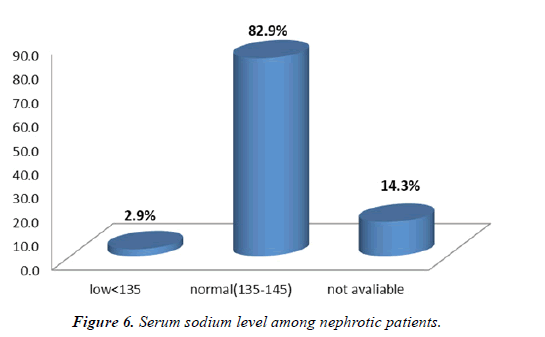
The figure below demonstrated that the highest percent of patients had normal sodium level (135-145mg/dl) about 82.9% while about 2.9% had low Na level (less than 135mg/ dl) and had sign of hyponatremia ,14.3% of study sample were missing of this investigation (Figure 5).
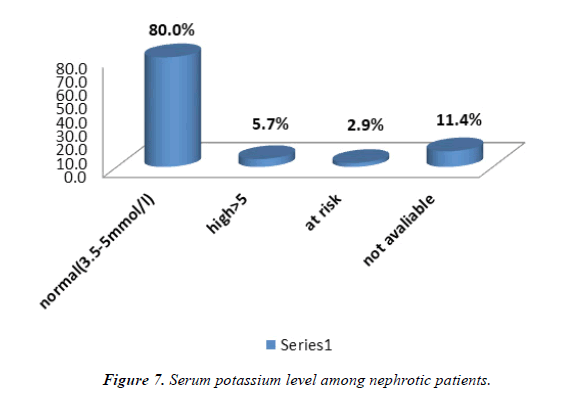
Based on our result 80% of patients in our sample had normal potassium level while about 5.7% of patients were suffer from hyperkalaemia (more than 5mg/dl). As well as 2.9% of study sample who at risk of high serum K level, however, 11.4% of our sample were the investigation unavailable. Revealed all previously mentioned (Figure 6).
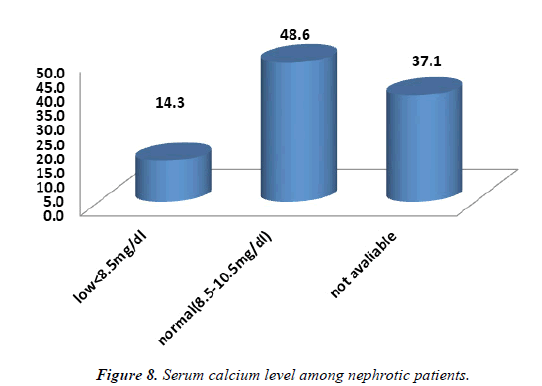
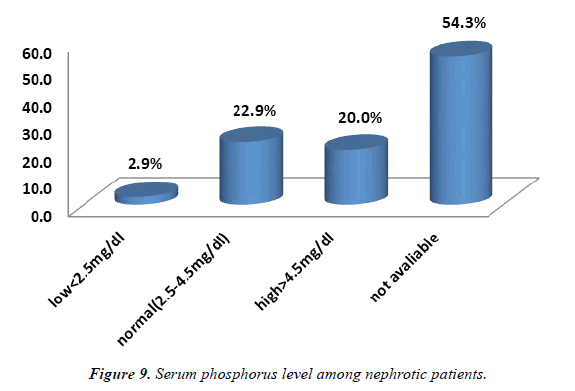
With regard to serum calcium and phosphate the percent of normal level of serum calcium and phosphorus in study sample was 48.6%, 22.9% respectively, among percent of low level of S.Ca and S. Ph were 14.3%,2.9% in our sample. Our result represented that 37.1%, 54.3% of nephrotic patients appearing this investigation were unavailable. In addition, about 20% of our sample had high level of S. Ph (hyperphosphatemia). As shows in (Figure 7).
Dietary counseling by renal dietician
Nutrients Intake by 24 hours recalls analysis: The average daily nutrient intake of participants was assessed from information gathered by means of one-day 24-hour dietary recall. The results are summarized in Tables below (Table 9).
The maximum intake of patients from protein, fat was 37.1%, 11.4% respectively, while the normal intake from protein and fat was 42.8%, 17.1%, whereas the most of patients revealed with low intake of fat which was 71.4%. Only 20% in our sample shows with low intake of protein in their diet as represented in table, our result found that inadequate food intake from fat, protein was insufficient compared to the dietary intakes recommended for nephrotic patients, especially protein so that poor nutritional status of nephrotic patients will be existing. Regarding with sodium intake most of study sample low Na intake in their diet which about 94.3% whereas only 5.7% of patients were normal Na in their diet [15].
Patients’ compliance for nutritional advice: Below shows that most of patients did not apply leaching practice of vegetables which was 74.3%, while 25.7% in our sample were practiced of leaching. About 51.4% of study sample follow the fat restriction in their diet, however 48.6% ate high fat in their diet. Regarding other food intakes among nephrotic patients below reveals that the highest percent (74.3%) of protein consumed by participants was at normal level; however 25.7% of patients were not following Dietitian advice [16-18]. As well as patients followed fluid restriction was 62.9%, whereas 37.1% did not follow the restrictions. Based on results of our study we shown that 57.1% of patients followed low salt and low potassium in their diet, however, 42.9% did not follow the Dietitian advice for salt and K restriction. Table 9 below demonstrated that the highest of patients (71.4%) intake of 2-3 number of snack and meals whereas 22.9% intake of 4-6 numbers of meals and snack, only 5.7% had irregular meal pattern (Table 10).
| Characteristics | N | % |
|---|---|---|
| Leaching vegetables | ||
| 1-practiced | 9 | 25.70% |
| 2-Not practiced | 26 | 74.30% |
| Low fat diet | ||
| 1-Yes | 18 | 51.40% |
| 2-No | 17 | 48.60% |
| Normal protein diet | ||
| 1-yes | 26 | 74.30% |
| 2-NO | 9 | 25.70% |
| Fluid restriction | ||
| 1-Yes | 22 | 62.90% |
| 2-No | 13 | 37.10% |
| Low salt diet | ||
| 1-Yes | 20 | 57.10% |
| 2-No | 15 | 42.90% |
| Low K diet | ||
| 1-Yes | 20 | 57.10% |
| 2-No | 15 | 42.90% |
| No meals and snacks | ||
| 2-3 | 25 | 71.40% |
| 4-6 | 8 | 22.90% |
| Irregular | 2 | 5.70% |
Table 10: Patients’ compliance.
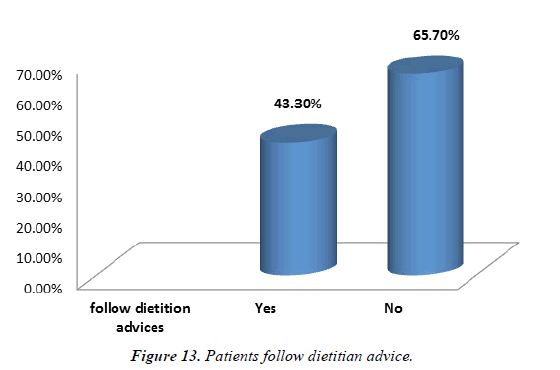
Patients follow dietitian advice: In the present study, most patients in our sample did not follow Dietitian advice which was 65.7% whereas 43.3% were follow the advice as shows in. From the above findings, it can be suggested that the improvement in nutritional status of nephrotic patients was dependent on followed of counseling by the renal Dietitian [19].
Association between patients’ conservative treatment and SGA score: Based on the results there was showed patients on conservative treatment had a highly signi?cant association with SGA scores (P-value 0.000) (Table 11).
| Conservative | Total | ||||
|---|---|---|---|---|---|
| Diet | Medication | Both | |||
| SGA | Well nourished | 0 | 15 | 6 | 21 |
| Mildly/moderately malnourished | 0 | 10 | 3 | 13 | |
| Severely malnourished | 1 | 0 | 0 | 1 | |
| Total | 1 | 25 | 9 | 35 | |
Table 11: Correlation between SGA score and patients’ conservative treatment.
Correlation between SGA score and follow dietitian advice: Correlational analysis was carried out between SGA scores and patients follow Dietitian advice the shows that results (Table-12, Table-13, Table-14). No significant correlation was found between SGA score and follow advice (P value=0.369).
| Chi-Square Tests | Value | df | Asymp. Sig. (2-sided) |
|---|---|---|---|
| Pearson Chi-Square | 35.128a | 4 | 0 |
| Likelihood Ratio | 9.208 | 4 | 0.056 |
| Linear-by-Linear Association | 2.321 | 1 | 0.128 |
| N of Valid Cases | 35 |
Table 12: Chi-Square Tests correlation between SGA score and follow Dietitian advice.
| Follow Dietitian advices | Total | |||
|---|---|---|---|---|
| yes | no | |||
| SGA | Well nourished | 7 | 14 | 21 |
| Mildly/moderately malnourished | 4 | 9 | 13 | |
| severely malnourished | 1 | 0 | 1 | |
| Total | 12 | 23 | 35 | |
Table 13: Chi-Square Tests
| Chi-Square Tests | Value | df | Asymp. Sig. (2-sided) |
|---|---|---|---|
| Pearson Chi-Square | 1.996a | 2 | 0.369 |
| Likelihood Ratio | 2.222 | 2 | 0.329 |
| Linear-by-Linear Association | 0.3 | 1 | 0.584 |
| N of Valid Cases | 35 |
Table 14: Chi-Square Tests
Discussion
Nutritional status is an important predictor of outcome in nephrotic patients. Assessment of the nutritional status needs a systematic nutritional evaluation based on anthropometric, laboratory, and clinical parameters from which a malnutrition score can be calculated. SGA has been widely used as a nutritional assessment tool and found to be highly predictive of nutrition-associated complications. Our study indicated that 60% of the studied patients were well nourished, while 37.1%, 2.9% had mild-to-severe malnutrition. However study was done by Vijaya et al. demonstrated that overall malnutrition rates at baseline were 95.3%. reports from other studies suggests varying degrees of malnutrition which ranged from 40% to 97%.Such a differences in prevalence may be because of dietary and environmental diversities.
Renal disorders have been associated with increased risk of malnutrition, particularly along with the progression of CKD. The poor nutritional status of nephrotic patients is the result of several interrelated factors. Apart from the catabolic effect of N.S, albumin loss in urine, and uremic toxicity, several co-morbid conditions may also contribute to malnutrition including chronic infection and superimposed diseases that result in anorexia and inadequate food intake. The NKF-K/ DOQI Clinical Practice Guidelines for nutrition in nephrotic patients and for evaluation of protein energy malnutrition and nutritional status recommended assessment with a combination of valid, and complementary, measures rather than any single measure alone as malnutrition may be identified with greater sensitivity and specificity using a combination of factors. Nutritional assessment ideally should be used to determine the nutritional requirements for all patients taking into account their nutritional and metabolic status and should be used to monitor the patient’s progress and any alteration in requirements. In addition, nutritional assessment should be able to identify groups of patients at risk from the effects of malnutrition. Finally, the parameters used for assessment should be simple, yet effective, and readily available in any hospital. Because of the complexity of the nutritional management of nephrotic patients, registered dietitians should be consulted, especially for nutritional counseling of the patients. Physicians and other clinical personnel should also strongly encourage dietary compliance of the patients because dietary adherence can determine outcomes in nephrotic syndrome.
Association between demographic and clinical variable and SGA
Our results indicated that most of nephrotic patients were well nourished although the nutritional score was insignificantly associated with certain demographic and clinical variables such as income, chronic disease. However, SGA score results indicated some significant correlations with patient’s education level .Study was done by Aghakhani et al (2012) was carried out in Saudi found that uneducated nephrotic patients had greater risk of malnutrition and the study have shown that dedicated health-care workers for education patients with N.S can improve nutritional state and health outcomes. As shown in our result Patients with comorbid condition had unsignificant relation with SGA scores. In contrast study carried out in Riyadh city, the SGA score was significantly associated with the presence of comorbid diseases. As well as Jahromi et al. showed that comorbidities were significant predictors of malnutrition in NS patients. As mentioned previously our result reveals that most of nephrotic patients had low income and shows non-significant associated between income and SGA. On the other hand, Oliveira et al.(2012) performed a detailed assessment of the nutritional status in N.S and showed that MN was correlated with monthly personal income, which was in opposition to the data reported here [20]. Contrary to our result, the same study by Oliveira et al. also reported that MN was more prevalent among illiterate patients that those with a higher education status.
With regard to association between BMI and SGA score our result illustrated that 37.1% of study sample were within the normal range, 17.1% were overweight, 22.9% were grad1obese, 14.3% grad 2 obese, 8.6% grad 3 obese.
The result demonstrated that no significant association was found between a patient’s BMI and SGA score. Similarly, study done by Fouque et al. reported that BMI and serum albumin levels have been traditionally known as nutritional markers. Many studies emphasize the protective effect of a higher BMI is in improved survival in nephrotic patients additionally, a BMI lower than 20 kg/m2 is considered an index of malnutrition [21-22].
Laboratory investigation: The result represented that hemoglobin level regarding both sexes, normal level of HBG among male group was 25.7%as well as the percent of male patients with low level of HBG and had anemia was 14.3%. About female group, 31.4% of female in our sample had HBG with normal level, while the female with low HBG level and had anemia was 25.7%, about 2.9% of our sample were missing HBG investigation. In addition, the result shows that most of patients in our sample had normal blood urea, creatinine, Na, K, Ca, and Ph. Level. Regarding biochemical indexes of nephrotic syndrome and nutritional status of nephrotic patients (Figure 8 and Figure 9).
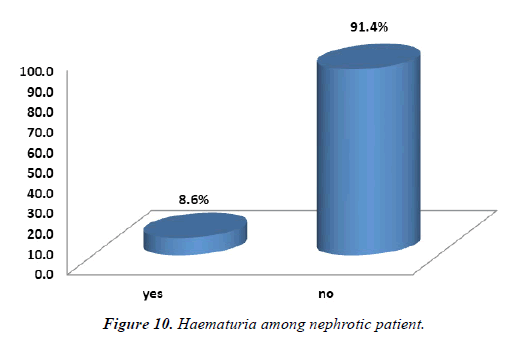
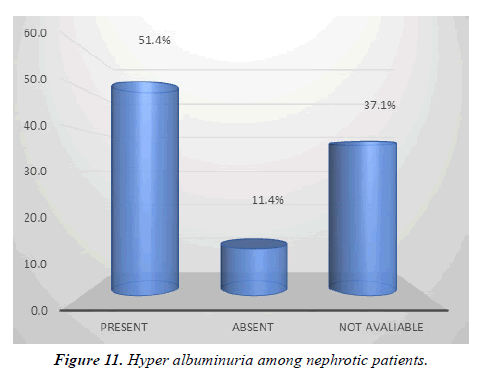
Haematuria (blood in urine) is important sign of N.S , the figure below(10) shows that 91.4% of nephrotic patients don’t have Haematuria, however 8.6% of patients had haematuria . About urine Albumin level 51.4% of patients had high albumin level in their urine( hyper albuminuria more than > 3.5g/d) while the 11.4% of patients did not appearing high albumin level in their urine (less than 3.5g/dl) , as well as the figure below (11) represented that 37.1% of patients in our sample this investigation were unavailable (Figure 10 and Figure 11).
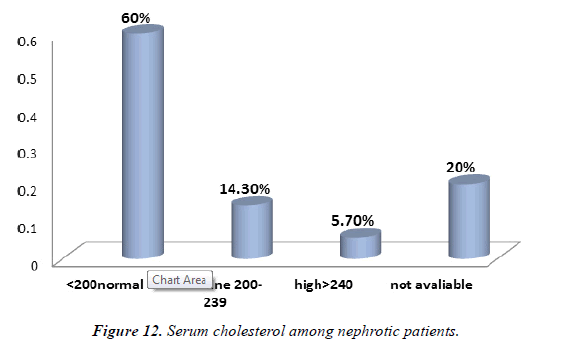
Demonstrated that the highest percent of patients had normal cholesterol level (<200 mg/dl) which about 60%, while 14.3% in our sample was at borderline ( 200-239mg/dl), the least of patients had hypercholesterolemia (>240mg/dl) which was 5.7%. The rest of patients (20%) in our sample were missing this investigation as illustrates in figure (12). We noted that majority of patients in our sample had normal cholesterol level compared with hypercholesterolemia ,whereas urine albumin was high level . High loss of albumin in urine is marker of malnutrition and nephrotic syndrome (Figure 12).
The average daily nutrient intake of participants was assessed from information gathered by means of one-day 24-hour dietary recall. The results are summarized in Tables below ( 8). The maximum intake of patients from protein , fat was 37.1%, 11.4% respectively ,while the normal intake from protein and fat was 42.8% , 17.1% , whereas the most of patients revealed with low intake of fat which was 71.4%. Only 20% in our sample shows with low intake of protein in their diet as represented in table 8, our result found that inadequate food intake from fat ,protein was insufficient compared to the dietary intakes recommended for nephrotic patients , especially protein so that poor nutritional status of nephrotic patients will be existing . Regarding with sodium intake most of study sample low Na intake in their diet which about 94.3% whereas only 5.7% of patients were normal Na in their diet (Figure 13).
The majority of nephrotic patients had normal cholesterol level, absent of hematuria, whereas urine albumin was high level. High loss of albumin in urine is marker of malnutrition and nephrotic syndrome. On the other hand, our results disagreed with the study by Feinstein et al. Have previously found that the most severe hypoalbuminemia and hypoproteinemia were seen in nephrotic patients. Severe nephrotic syndrome was characterized by higher total cholesterol, LDL and HDL. It is well known that individuals lacking plasma albumin do not usually develop significant sodium retention. As well as Hyperphosphatemia and hyperuricemia have been other wellknown indicators of hyper catabolism. It has been noted in nephrotic patients that hyperphosphatemia (hPi) is attributed to active nephrosis. Vanholder et al. suggested that urinary excretion of insulin growth factor 1 (IGF-1) and its influence on increased tubular phosphate retention, may be a possible mechanism of increased phosphorus concentration in this group of adult patients 50. Study was done by Cairo et al. reported that the highest phosphate and uric acid serum concentrations were observed in the NS patients [<
References
- Andolino TP, Reid Adam J. Nephrotic syndrome.Pedia in rev. 2015; 36.3:117-26.
- Hull RP, Goldsmith David JA. Nephrotic syndrome in adults.Bmj. 2008; 7654:1185-89.
- Cho S, Atwood JE, Peripheral edema.Am J Med.2002;113(7):580-86.
- Rodríguez-Iturbe B, Herrera-Acosta J, Johnson RJ. Interstitial inflammation, sodium retention, and the pathogenesis of nephrotic edema: A unifying hypothesis.Kidney Int.2002;62:1379-84
- Brater DC. Diuretic therapy.N Engl J Med.1998;339:387-95.
- Ruggenenti P, Mosconi L, Vendramin G, et al. ACE inhibition improves glomerular size selectivity in patients with idiopathic membranous nephropathy and persistent nephrotic syndrome.Am J Kidney Dis.2000;35(3):381-91.
- Korbet SM. Angiotensin antagonists and steroids in the treatment of focal segmental glomerulosclerosis. Semin Nephrol.2003;219-28.
- Stiles KP, Abbott KC, Welch PG, et al. Effects of angiotensin-converting enzyme inhibitor and steroid therapy on proteinuria in FSGS: a retrospective study in a single clinic.Clin Nephrol.2001;56:89-95.
- Crook ED, Habeeb D, Gowdy O, et al. Effects of steroids in focal segmental glomerulosclerosis in a predominantly African-American population.Am J Med Sci.2005;330:19-24.
- Fan J, Li Z, Wu T, et al. Lipid-lowering agents for nephrotic syndrome (intervention protocol).Cochrane Database Syst Rev.2009;2:CD005425.
- Walser M, Hills S, Tomalis EA. Treatment of nephrotic adults with a supplemented, very low-protein diet.Am J Kidney Dis.2006; 28: 354-64.
- FORCE, Canadian Malnutrition Task. Subjective global assessment (SGA)—Diagnosing Malnutrition. 2021.http://www.wikihow.com/Measure-Body-Fat-without-a-Caliper2016
- Vijaya KL, Aruna M, Narayana Rao SVL.et al. Dietary counseling by renal dietician improves the nutritional status of hemodialysis patients.Ind J Nep. 2019; 29:179.
- Berg J, York S, Cormier S, et al. Patient education. Incentive program to control interdialytic weight gains.J Ren Nutr.2004;14:52–9.
- Matyjek A, Literacki S, Niemczyk S, et al. Protein energy-wasting associated with nephrotic syndrome–the comparison of metabolic pattern in severe nephrosis to different stages of chronic kidney disease.BMC nephrol, 2020; 21:1-11.
- Kopple JD. National Kidney Foundation K/DOQI clinical practice guidelines for nutrition in chronic renal failure. Am J Kidney Dis 2001;37:S66-70.
- Aghakhani N, Samadzadeh S, Mafi TM, et al. The impact of education on nutrition on the quality of life in nephrotic patients: A comparative study from teaching hospitals. Saudi J Kidney Dis Transpl. 2012;23:26-30
- Jahromi SR, Hosseini S, Razeghi E, et al. Malnutrition predicting factors in nephrotic hemodialysis patients.Saudi J Kidney Dis Transpl.2010;21(5):846–851.
- Oliveira GT, Andrade EI, Acurcio Fde A, et al. Nutritional assessment of patients undergoing hemodialysis at dialysis centers in Belo Horizonte, MG, Brazil.Rev Assoc Med Bras.2012;58(2):240–247.
- Fouque D, Vennegoor M, Ter Wee P, et al. EBPG guideline on nutrition.Nephrol Dial Transplant.2007;22:45–87
- Feinstein S, Becker-Cohen R, Rinat C, et al. Hyperphosphatemia is prevalent among children with nephrotic syndrome and normal renal function.Pediatr Nephrol.2006;21:1406–12.
- Vanholder R, Sever MS, Erek E, Et al. Rhabdomyolysis.J Am Soc Nephrol.2000;11:1553–61.
- Rodríguez-Iturbe B, García GG. The role of tubulointerstitial inflammation in the progression of chronic renal failure.Nephron Clin Pract.2010;116:c81–c88.
- Azar AT, Wahba K, Mohamed AS, et al. Association between dialysis dose improvement and nutritional status among hemodialysis and nephrotic patients.Am J Nephrol.2007;27:113-9.
- Castellino P, Cataliotti A. Changes of protein kinetics in nephrotic patients.Curr Opin Clin Nutr Metab Care.2002;5:51–54.
- Koomans HA, Geers AB, vd Meiracker AH, et al. Effects of plasma volume expansion on renal salt handling in patients with the nephrotic syndrome.Am J Nephrol.1984;4:227–34
- Dashti N, Einollahi N, Nabatchian F, et al. Significance of albumin and C-reactive protein variations in 300 end stage renal disease patients in tehran university of medical sciences hospitals during year 2010.Acta Med Iran.2012;50:197–202
Indexed at, Google Scholar, Cross Ref
Indexed at, Google Scholar, Cross Ref
Indexed at, Google Scholar, Cross Ref
Indexed at, Google Scholar, Cross Ref
Indexed at, Google Scholar, Cross Ref
Indexed at, Google Scholar, Cross Ref
Indexed at, Google Scholar, Cross Ref
Indexed at, Google Scholar, Cross Ref
Indexed at, Google Scholar, Cross Ref
Indexed at, Google Scholar, Cross Ref
Indexed at, Google Scholar, Cross Ref
Indexed at, Google Scholar, Cross Ref
Indexed at, Google Scholar, Cross Ref
Indexed at, Google Scholar, Cross Ref
