Research Article - International Journal of Pure and Applied Zoology (2020) Volume 8, Issue 3
Molecular Phylogeny and Sequence Divergence in Stink Bugs of family Pentatomidae (Hemiptera: Heteroptera) inferred from analysis of Mitochondrial Cyt B Gene in India
Ramneet Kaur1* and Devinder Singh2
1Department of Zoology, Punjabi University, Patiala, India
2Department of Zoology, GGDSD College, Chandigarh, India
- Corresponding Author:
- Ramneet Kaur
Department of Zoology
GGDSD College
Chandigarh, India
Tel: +919779384377
E-mail: ramneetkaur.in@gmail.com
Received: 02nd July, 2020; Accepted: 16th July, 2020; Published: 23rd July, 2020
Abstract
The present work was aimed to investigate the phylogenetic analysis of different species of Indian stink bugs belonging to family Pentatomidae based on mitochondrial Cyt b DNA sequences. We sequenced and analysed a 440 bp fragment of the mitochondrial Cyt b gene to assess the level of sequence divergence in different species of Pentatomid bugs collected from distant localities of Northern India. The data divulged an R value of 1.19 suggesting transitions to be more than transversions. 18 sequences representing 10 species and 5 genera were finally analysed using partial Cyt b gene region. The intraspecific divergence ranged from 0.2 to 7.2% with an average of 3.75 ± 3.0% whilst interspecific divergence ranged from 3.8 to 10.3% with an average of 7.49 ± 1.7% and intergeneric distance ranged from 12.1 to 20.2% with an average of 16.37 ± 2.2%. The percentage divergence values revealed a clear pattern of increased nucleotide diversity from conspecific to congeneric to intra subfamily level using Cyt b gene fragment.
Keywords
Pentatomidae, Stink Bugs, Mitochondrial Cyt b, Phylogenetic analysis
Introduction
Hemiptera is a very large and diverse order of hemimetabolous insects which is further divided into five suborders: Heteroptera, Cicadomorpha, Fulgoromorpha, Sternorrhyncha and Coelorrhyncha (Schuh and Slater, 1995). Out of these five suborders, Heteroptera is a highly diverse taxon with more than 42,000 species in over 5800 genera and 140 families described worldwide (Henry, 2009; Park et al., 2011). Infraorder Pentatomomorpha, which consists of 40 families representing more than 14,000 species, is the second largest among the seven infraorders of Heteroptera and constitutes the most recognizable group of true bugs. Pentatomomorpha is further divided into six superfamilies viz., Pentatomoidea, Coreoidea, Pyrrhocoroidea, Idiostoloidea, Aradoide and Lygaeoidea (Dolling, 1981; Schaefer, 1993; Schuh and Slater, 1995; Weirauch and Schuh, 2011; Tian et al., 2011). Superfamily Pentatomoidea consists of about 7,000 known species in 15 families, of which family Pentatomidae is a large family containing 4,722 species in about 900 genera (Rider 2019). Pentatomids are generally known as “Stink Bugs”, because of the emission of disagreeable pungent odour from a pair of scent glands that open in the region of the metapleura. They produce large quantities of strong smelling and irritating defensive chemicals, which are released when they are disturbed or molested. The high reproductive rates and an exceptional ability to transmit diseases make them the worst agricultural pests (Song and Liang, 2009).
Traditionally, identification has been done on the basis of morphological diagnoses provided by taxonomical studies. But only experts such as taxonomists and trained technicians can identify taxa accurately, as it requires special skills acquired through extensive experience (Jinbo et al., 2011). Moreover, small size of some insects, availability of damaged specimens or partial fragments of body parts or immature stages also act as a barrier in the identification process. To overcome these limitations molecular techniques are commonly used nowadays in which molecular data have proven to be very effective for understanding phylogenetic relationships (Blair and Hedges, 2005; Regier et al., 2005; Roe and Sperling, 2007) and diagnosing and delimiting cryptic species (Sperling and Hickey, 1994; Goetze, 2003; Blair et al., 2005; Hendrixson and Bond, 2005; Roe and Sperling, 2007). The degree of genetic relatedness between species reveals their relationships with one another. The more the genetic relatedness, the more will be the similarity in DNA fragments in any two individuals. The techniques on the basis of which we can perform the DNA typing include PCR, AFLP, RAPD, RFLP, RT-PCR and microsatellite technology (Mullis and Faloona, 1987; Agrawal and Shrivastava, 2014). Mitochondrial DNA is widely used as a valuable molecular marker for phylogenetic studies in animals, because of its simple genomic structure (Avise, 1994). It is small, circular DNA with length ranging from 14,000 to 17,000 bp that comes predominantly from maternal sources (Lessinger et al., 2000; Boore, 1999; Cameron et al., 2007). It has relatively fast mutation rate, lacks introns and shows no recombination (Brown et al., 1979; Hebert et al., 2003). Thus, mtDNA suits as the best device to trace phylogeny (Simon et al., 1994; Rubinoff and Holland, 2005). The genomic DNA is first subjected to PCR amplification and then analysed by sequencing. By comparing the DNA sequences, it is possible to create phylogenetic trees which show the degree of relatedness between the species. This technique was developed by Sanger et al. (1977) and is considered as the best way to directly estimate genetic variations of specific genes among taxa. The datasets can be aligned and analysed with different computer based algorithms and methods of phylogenetic analyses. The most commonly used methods are multiple alignment of nucleotide or protein sequences and their analyses by maximum parsimony, maximum likelihood, Bayesian inference and distance algorithms, implemented in programs such as Clustal W, MUSCLE, MEGA 6.0 (Thompson et al., 1994; Huelsenbeck et al., 2001; Swofford, 2002; Tamura et al., 2013).
Materials and Methods
Taxon sampling
The first step subsumed the collection of stink bugs from different regions of North India (Himachal Pradesh, Punjab and Uttarakhand), followed by sorting, pinning, labelling and identification of the collected specimens. The collection of stink bugs involved both day and night collection. After collection few specimens were pinned while rest of them were preserved in absolute alcohol and stored at -20°C for molecular studies. For a molecular study, DNA isolation is the first and crucial step. DNA isolation is a multistep procedure which involves cell lysis by treatment with lytic enzymes and/or detergents, extraction with organic solvents and then the recovery of DNA by alcohol precipitations. Here, liquid nitrogen was used which allowed access to DNA by breaking cell wall while other cellular enzymes and chemicals remained inactivated, thus giving the higher yield of DNA. DNA was extracted from thorax region using modified phenol: chloroform method (Kambhampati and Rai, 1991). Genomic DNA was eluted in 100 μl of TE buffer and stored at -20°C. Integrity of extracted DNA was checked on 0.8% agarose gel by horizontal gel electrophoresis. Quantification of DNA was done by nanodropspectrophotometer. The Cyt b gene was amplified using forward primer 5’- TAGGATATGTTTTACCTTGAGGACA-3' and reverse primer 5'- TCCTCCTAATTTATTAGGAATTG-3' (Muraji et al., 2000). The protocol followed for amplification of DNA was shown in Table 1. PCR was carried out at an annealing temperture of 55°C for 40 sec and an extension at 72°C for 40 sec.
| S. No. | Reagents | Volumes (µl/10µl rxn) |
|---|---|---|
| 1. | PCR Buffer (5X) | 1.20 ml |
| 2. | Magnesium Chloride (50mM) | 0.20 ml |
| 3. | dNTPs Mix(2.5mM) | 1.20 ml |
| 4. | Primer-Forward (10pM) | 0.25 ml |
| 5. | Primer-Reverse (10pM) | 0.25 ml |
| 6. | Template DNA (ng/µl) | 0.50 ml |
| 7. | Phusion DNA polymerase | 0.10 ml |
| 8. | Double Distilled water | 6.30 ml |
| Total volume | 10 ml |
Table 1: Various components of the reaction mixture with the volume used.
The most commonly used method of sequencing DNA, the dideoxy method or chain termination method, was developed by Sanger et al. (1977). The amplified products of Cyt b gene fragments were got sequenced directly from Agrigenome Pvt. Ltd, Cochin (India). The edited sequences were compared with related sequences from the nucleotide database of the National Centre for Biotechnology Information (NCBI) (http://www. ncbi.nlm.nih.gov), using Basic Local Alignment Search Tool (BLAST) algorithm (Altschul et al., 1997). Cyt b nucleotide sequences generated from this study were converted into amino acid sequences using MEGA software package (Kumar et al., 1994; 2001) and checked for the occurrence of stop codons. Nucleotide sequences were further aligned in MUSCLE tool (Edgar, 2004) of Codon Code Aligner v. 3.7.1. Nucleotide composition and substitution statistics were analysed in MEGA version 6.06 (Tamura et al., 2013) for inferring phylogenetic trees and for estimating divergence times. Percentage divergence matrix was drawn using Kimura-2-parameter model (Kimura, 1980) in MEGA 6.06 (Tamura et al., 2013). Codon positions included were 1st+2nd+3rd+Noncoding.
Results and Discussion
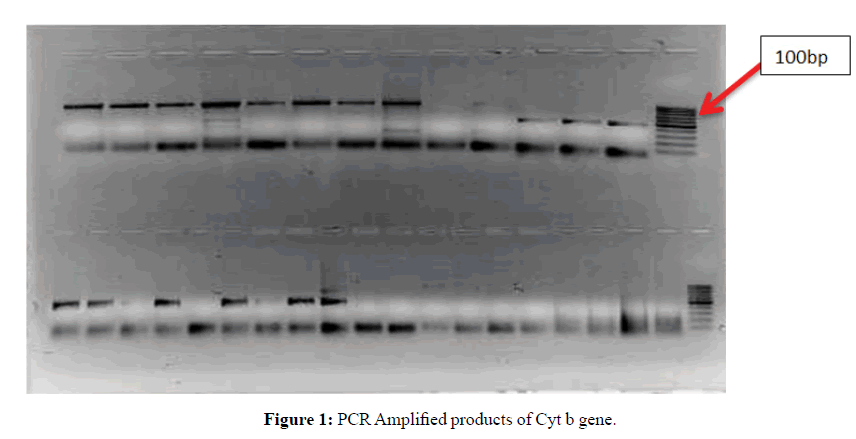
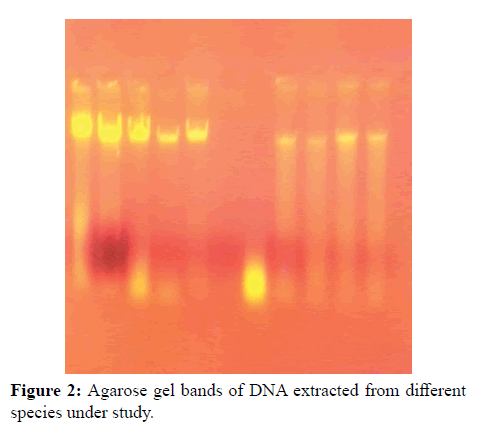
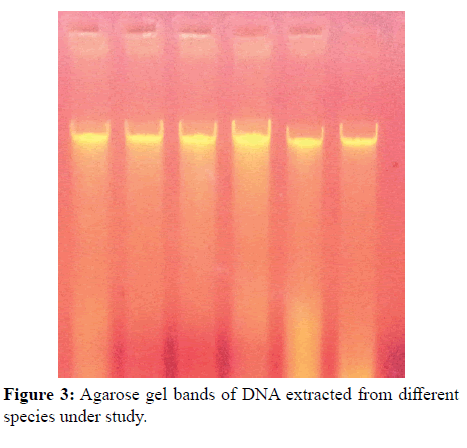
The first step was extraction of DNA from both dry old pinned and alcohol preserved fresh samples. It was observed that the quality as well as the quantity of DNA was far better in case of alcohol preserved fresh samples in comparison to old samples. Only insect legs and thorax were used for extraction. The integrity of the extracted DNA was checked qualitatively by horizontal agarose gel electrophoresis. PCR amplification was performed for 7 species representing 4 genera belonging to two subfamilies (Pentatominae and Podopinae) of family Pentatomidae. The PCR products were run on 2% agarose gel along with a 100 and 500 bp DNA ladder to determine the size of the amplified products. The bands obtained were clean and intense. Specific primers were used in the present study and measures were taken to avoid any chances of amplifying numts (nuclear mitochondrial DNA). The samples containing the required amplicons (Figures 1-3) were sequenced by both forward and reverse sequencing by chain termination method. Once sequences were obtained, these were analysed, edited and trimmed accordingly by Codon Code Aligner.
Lane M: 100 bp DNA ladder
Lanes: Different species of family Pentatomidae taken for the present study
Multiple sequence alignments
11 sequences of 440 bp representing seven species of four genera belonging to two subfamilies (Pentatominae and Podopinae) were finally taken for further analysis (Table 2). 7 corresponding sequences of five species deposited by other workers were procured directly from Genbank (Table 3). The final aligned data pertained to 18 Cyt b sequences of 440 bp representing 10 species and 5 genera. Sequence of Aeschyntelusnotatus, belonging to family Rhopalidae, was included in the analysis as the outgroup taxon.
| S. No. | Taxa | SpecimenCode | CollectionState | Collection Month/Year | Accession Number |
|---|---|---|---|---|---|
| 1 | Graphosoma lineatum (Linnaeus, 1758) | HP25 HP14 |
Uttarakhand Himachal Pradesh |
May, 2016 March, 2013 |
MG994919 MG994918 |
| 2 | Halyomorpha picus (Fabricius, 1794) | HP22 HP16 |
Uttarakhand Himachal Pradesh |
Oct, 2015 May, 2014 |
MG994913 MG821869 |
| 3 | Nezara antennata (Scott, 1874) | P18 | Punjab | June, 2013 | MG994914 |
| 4 | Nezara viridula (Linnaeus, 1758) | P9 P10 HP19 |
Punjab Punjab Himachal Pradesh |
March, 2013 April, 2014 June, 2014 |
MG821868 MG821867 MG821866 |
| 5 | Plautia crossota (Dallas, 1851) | U8 | Uttarakhand | Oct, 2015 | MG994917 |
| 6 | Plautia stali (Scott, 1874) | HP17 | Uttarakhand | Oct, 2015 | MG994915 |
| 7 | Plautia viridicollis (Westwood, 1837) | HP26 | Himachal Pradesh | Aug, 2015 | MG994916 |
Table 2: Details of species analysed for Cyt b in the present study.
| S. No. | Taxa | Family | Accession no. | Country |
|---|---|---|---|---|
| 1 | Graphosomaru brolineatum | Pentatomidae | KX267740.1 | China |
| 2 | Halyomorpha halys | Pentatomidae | FJ685650.1 | Korea |
| 3 | Nezara viridula | Pentatomidae | AB020514.1 AY839170.1 FJ418864.1 |
Japan Slovenia China |
| 4 | Nezara antennata | Pentatomidae | FJ418867.1 | China |
| 5 | Aeschyntelus notatus | Rhopalidae | EU427333.1 | China |
Table 3: List of taxa whose Cyt b sequences were downloaded from Genbank for alignment.
Nucleotide substitution
Nucleotide substitution patterns may play an important role in obtaining information about phylogenetic relationships and the population structure of different organisms and such variations may show increased diversification among independent lineages and increasingly divergent taxa (Galtier et al., 2005; Souza et al., 2016). Transitional substitutions are known to occur much more readily than transversional substitutions (Brown et al., 1979; Muraji et al., 2000).The pattern of nucleotide substitutions was estimated using Maximum Composite Likelihood method. The estimated transition/transversion bias was R=1.19 Cyt b sequences respectively, suggesting transitions to be more than transversions. Maximum number of transitions is the result of A+T rich regions in the insect genome.
In several insect species, it has been reported that the frequency of base changes was different among different types of nucleotide substitution (Dowton et al., 1998; Muraji et al., 2000). In Cyt b gene region, A-T transversions showed a lower frequency than T-C transition. In particular, in the second positions of codons, T-C transitions showed the highest frequency which is 3.5 times higher than the number of A-T transversions (Table 4). Muraji et al. (2000) also found similar results showing the high rates of T-C transitions than A-T transversions in partial Cyt b gene fragment. According to their study, nucleotide substitution may occur more frequently between pyrimidine bases than between pyrimidine and purine bases respectively.
| Nucle-otide | Codon Position | |||||||||||||||
|---|---|---|---|---|---|---|---|---|---|---|---|---|---|---|---|---|
| 1st Codon Position | 2nd Codon Position | 3rd Codon Position | Overall | |||||||||||||
| A | T | C | G | A | T | C | G | A | T | C | G | A | T | C | G | |
| A | - | 2.2 | 0.64 | 2.46 | - | 6.51 | 2.71 | 3.16 | - | 10.86 | 6.3 | 2.48 | - | 8.04 | 3.85 | 4.05 |
| T | 3.1 | - | 8.29 | 0.16 | 7.38 | - | 14.41 | 2.32 | 5.47 | - | 15.31 | 3.13 | 7.19 | - | 13.44 | 2.66 |
| C | 3.1 | 28.7 | - | 0.16 | 7.38 | 34.56 | - | 2.32 | 5.47 | 26.38 | - | 3.13 | 7.19 | 28.05 | - | 2.66 |
| G | 48.35 | 2.2 | 0.64 | - | 10.04 | 6.51 | 2.71 | - | 4.33 | 10.86 | 6.3 | - | 10.97 | 8.04 | 3.85 | - |
Table 4: The transition transversion rates at 1st, 2nd, 3rd and 1st+2nd+3rd+noncoding positions in mtDNACyt b sequences.
Sequence divergence
The genetic divergence among the selected species of family Pentatomidae was estimated using partial Cyt b gene sequences. All the species exhibited discriminative values of intra and interspecific and intergeneric divergence using Cyt b gene fragment. The percent divergence values revealed a clear pattern of increased nucleotide diversity from conspecific to congeneric to intra subfamily level. The intraspecific divergence ranged from 0.2 to 7.2% with an average of 3.75 ± 3.0% whilst interspecific divergence ranged from 3.8 to 10.3% with an average of 7.49 ± 1.7% and intergeneric distance ranged from 12.1 to 20.2% with an average of 16.37 ± 2.2%. Intergeneric divergence was quite high in the present study for all the genera and no ambiguity was observed as it was above 10% for all. For Halyomorphapicus interspecific divergence was quite higher than intraspecific divergence indicating the species to be well separated.
Phylogenetic tree
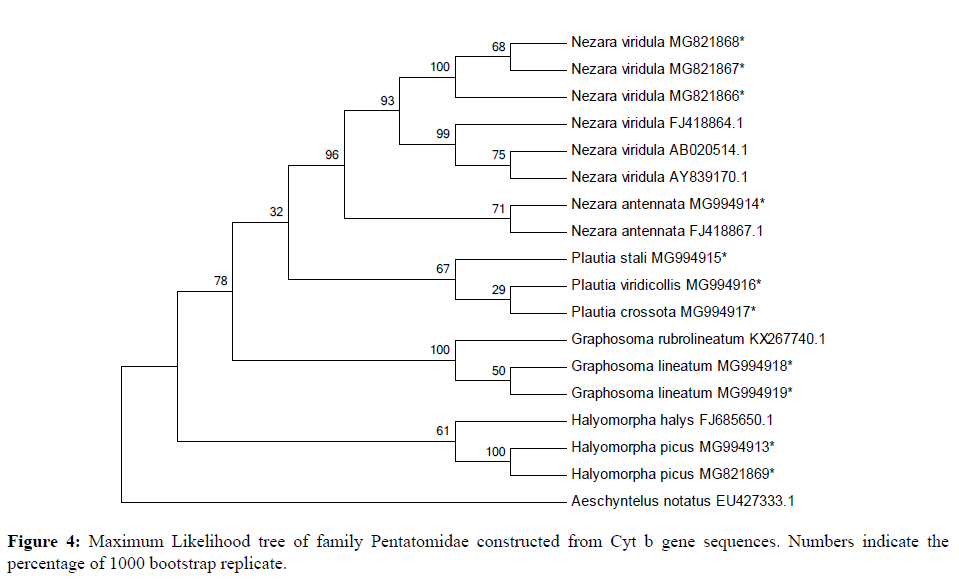
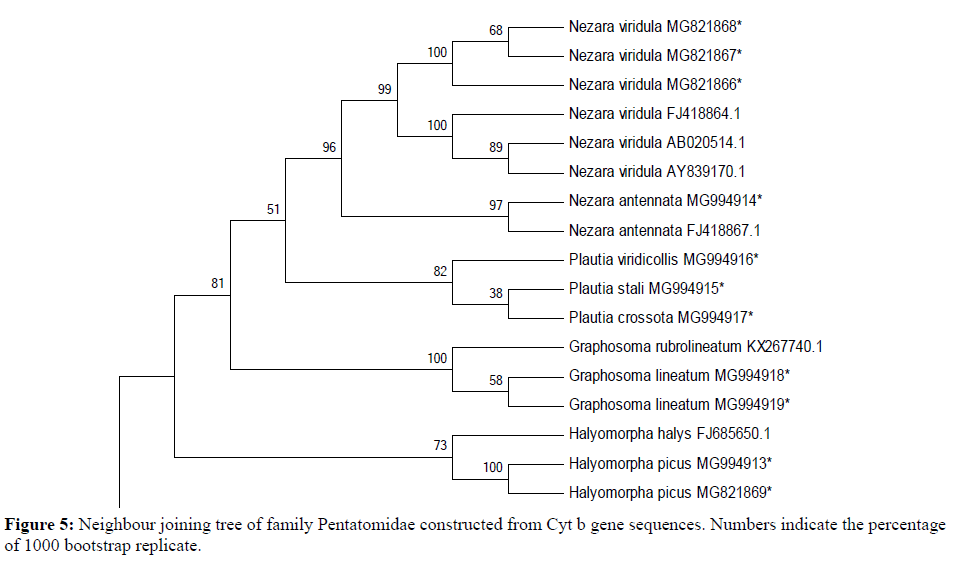
18 sequences of 440 bp representing 9 species of four genera belonging to two subfamilies (Pentatominae and Podopinae) were finally taken along with 1 species of family Rhopalidae (taken as an out group) using partial Cyt b gene fragment for phylogenetic analysis in family Pentatomidae with a bootstrap value of 1000 replications. The NJ and ML trees for the 440 bp region of Cyt b gene of mtDNA isolated from the nine species of Pentatomidae and their world sequences are shown in Figures 4 and 5. It is clear from the data that all the samples of the nine species are well separated from the other species and grouped together with their world sequences with high bootstrap values. In all trees, Graphosomalineatum and Graphosomarubrolineatum belonging to subfamily Podopinae acted as a sister taxon of genus Nezara and Plautia of subfamily Pentatominae with 81% BT in NJ, 82% in ME tree. Aeschyntelusnotatus (out group) with Gen Bank accession number EU427333.1 was most basal followed by Halyomorphapicus belonging to subfamily Pentatominae in all the trees. Figures 4 and 5 clearly showed that all the nine species are well separated with high bootstrap support.
Species Plautiastali, P. crossota and P. viridicollis have no Gen Bank sequence for comparison and they are new for the Gen Bank database from India. All the present sequences belonging to Nezaraviridula were clustered together showing 99% bootstrap value in NJ tree. The three species of genus Plautia whose world sequences were not available grouped together within their own samples and separated from other species with 82% bootstrap value in NJ trees. However, in ML tree species of subfamily Pentatominae appeared as a sister clade to genus Graphosoma of subfamily Podopinae with 78% bootstrap value (Figure 5). The analysis of phylogenetic trees clearly showed that all the pentatomid species considered for the present research based on Cyt b got rightly allotted to the three subfamilies namely, Pentatominae, Podopinae and Asopinae.
Conclusion
During phylogenetic analysis it was observed that subfamily Pentatominae might not be monophyletic or subfamily Asopinae and Podopinae showed very close relationship with Pentatominae. The three subfamilies showed a close relationship with each other in each tree. The species taken as an outgroup remained separated from the studied family in all the trees. All the species studied revealed a similar pattern with high bootstrap value forming well separated clades. Different genera clustered separately and congeners clustered together in all the trees. On the basis of above discussion it can be concluded that Cyt b gene fragment of mitochondrial DNA are useful in the identification and phylogenetic analysis of Indian Pentatomid bugs. Cyt b acts as wonderful markers for both phylogenetic analysis describing monophyly and polyphyly of the groups and at the same time it also throws some light on the apparent geographical population distribution pattern with the genetic variation in these gene fragments.
Acknowledgement
We acknowledges Rajiv Gandhi National Fellowship for financial support and DBT-IPLS Project for required laboratory facilities at Sophisticated Instrumentation Centre and Zoology Department, Punjabi University, Patiala.
References
- Agrawal, P.K. and Shrivastava, R. (2014). Molecular markers. In: Adv.Biotechnol., 25-39.
- Altschul, S.F., Madden, T.L., Schäffer, A.A., Zhang, J., Zhang, Z., Miller, W. and Lipman, D.J. (1997). Gapped BLAST and PSI-BLAST: a new generation of protein database search programs. Nucleic. Acids. Res., 25: 3389-3402.
- Avise, J.C. (1994). Molecular Markers, Natural History and Evolution. Chapman and Hall., New York, 511.
- Blair, C.P., Abrahamson, W.G., Jackman, J.A. and Tyrrell, I. (2005). Cryptic speciation and host race formation in a purportedly generalist tumbling flower beetle. Evolution., 59: 304-316.
- Blair, J.E. and Hedges, S.B. (2005). Molecular phylogeny and divergence times of Deuterostome animals. Mol. Biol.Evol., 22: 2275-2284.
- Boore, J.L. (1999). Animal mitochondrial genomes. Nucleic. Acids. Res., 27: 1767- 1780.
- Brown, W.M., George, M. and Wilson, A.C. (1979). Rapid evolution of animal mitochondrial DNA. Proceedings of the National Academy of Sciences of the United States of America; 76: 1967-1971.
- Cameron, S.L., Lambkin, C.L., Barker, S.C. and Whiting, M.F. (2007). A mitochondrial genome phylogeny of Diptera: whole genome sequence data accurately resolve relationships over broad timescales with high precision. Sys.Entomol., 32: 40-59.
- Dolling, W.R. (1981). A rationalized classification of the burrower bugs (Cydnidae). Sys.Entomol., 6: 61-76.
- Dowton, M., Austin, A.D. and Antolin, M.F. (1998). Evolutionary relationships among the Braconidae (Hymenoptera: Ichneumonoidea) inferred from partial 16S rDNA gene sequences. Insect. Mol. Biol., 7: 129-150.
- Edgar, R.C. (2004). MUSCLE: Multiple sequence alignment with high accuracy and high throughput. Nucleic. Acids. Res., 32: 1792-1797.
- Galtier, N., Enard, D., Radondy, Y. and Bazin, E. (2005). Mutation hot spots in mammalian mitochondrial DNA. Genome Res., 16: 215-222.
- Goetze, E. (2003). Cryptic speciation on the high seas; global phylogenetics of the copepod family Eucalanidae. Proceedings of the Royal Society of London; 270: 2321-2331.
- Hebert, P.D.N., Ratnasingham, S. and deWaard, J.R. (2003). Barcoding animal life: cytochrome c oxidase subunit 1 divergences among closely related species. Proceedings of the Royal Society of London Series B: Biological Sciences; 270: 96-99
- Hendrixson, B.E. and Bond, J.E. (2005). Testing species boundaries in the Anthrodiaetus unicolor complex (Araneae: Mygalomorphae: Antrodiaetidae): Paraphyly and cryptic diversity. Mol.Phylogen. Evol., 36: 405-416.
- Henry, T.J. (2009). Biodiversity of Heteroptera. Insect biodiversity: Sci. Society., 1: 223-263.
- Hua, J., Li, M., Dong, P., Cui, Y., Xie, Q. and Bu, W. (2008). Comparative and phylogenomic studies on the mitochondrial genomes of Pentatomomorpha (Insecta: Hemiptera: Heteroptera). BMC Genomics., 9: 610-625.
- Huelsenbeck, J.P., Ronquist, F., Nielsen, R. and Bollback, J.P. (2001). Bayesian inference of phylogeny and its impact on evolutionary biology. Science., 294: 2310-2314.
- Jinbo, U., Kato, T. and Ito, M. (2011). Current progress in DNA barcoding and future implications for entomology. Entomol. Sci., 14: 107-124.
- Kambhampati, S. and Rai, K.S. (1991). Mitochondrial DNA variation within and among populations of the mosquito Aedesalbopictus. Genome., 34: 288-292.
- Kumar, S., Tamura, K. and Nei, M. (1994). MEGA: molecular evolutionary genetics analysis software for microcomputers. Bioinformatics., 10: 189-191.
- Kumar, S., Tamura, K., Jakobsen, I.B. and Nei, M. (2001). MEGA2: molecular evolutionary genetics analysis software. Bioinformatics., 17: 1244-1245.
- Lee, W., Kang, J., Jung, C., Hoelmer, K., Lee, S.H. and Lee, S. (2009). Complete mitochondrial genome of brown marmorated stink bug Halyomorphahalys(Hemiptera: Pentatomidae) and phylogenetic relationships of hemipteran suborders. Mol. Cells., 28: 155-165.
- Lessinger, A.C., Junqueira, A.C.M., Lemos, T.A., Kemper, E.L., da Silva, F.R., Vettore, A.L., Arruda, P. and Azeredo-Espin, A.M.L. (2000). The mitochondrial genome of the primary screwworm fly Cochliomyiahominivorax (Diptera: Calliphoridae). Insect. Mol. Biol., 9: 521-529.
- Liu, H., Li, Z.X., Li, S.J. and Cai, W.Z. (2007). Application of mitochondrial DNA sequences in molecular systematics of true bugs (Hemiptera: Heteroptera). Entomotaxonomia., 4: 8.
- Mullis, K.B. and Faloona, F.A. (1987). Specific synthesis of DNA in vitro via a polymerase catalyzed chain reaction. Methods.Enzymol., 155: 335-350.
- Muraji, M., Kenjiro, K. and Toru, S. (2000). Phylogenetic utility of nucleotide sequences of mitochondrial 16S ribosomal RNA and cytochrome b genes in anthocorid bugs (Heteroptera: Anthocordiae). App.Entomol. Zool., 35: 293-300.
- Park, D.S., Foottit, R., Maw, E. and Hebert, P.D. (2011). Barcoding Bugs: DNA based identification of the true bugs (Insecta: Hemiptera: Heteroptera). PLoS.One., 6: 1-9.
- Regier, J.C., Shultz, J.W. and Kambic, R.E. (2005). Pancrustacean phylogeny: hexapods are terrestrial crustaceans and maxillopods are not monophyletic. Proceedings of the Royal Society of London. Series B; 272: 395-401.
- Roe, A.D. and Sperling, F.A.H. (2007). Patterns of evolution of mitochondrial cytochrome c oxidase I and II DNA and implications for DNA barcoding. Mol.Phylogen.Evol., 44: 325-345.
- Roe, A.D. and Sperling, F.A.H. (2007). Patterns of evolution of mitochondrial cytochrome c oxidase I and II DNA and implications for DNA barcoding. Mol.Phylogen.Evol., 44: 325-345.
- Rubinoff, D. and Holland, B.S. (2005). Between two extremes: mitochondrial DNA is neither the panacea nor the nemesis of phylogenetic and taxonomic inference. Sys. Biol., 54: 92-961.
- Sanger, F., Nicklen, S. and Coulson, A.R. (1977). DNA sequencing with chain-terminating inhibitors. Proceedings of the National Academy of Sciences; 74: 5463-5467.
- Schaefer, C.W. (1993). The Pentatomomorpha (Hemiptera: Heteroptera): an annotated outline of its systematic history. Eur. J.Entomol., 90: 105-122.
- Schuh, R.T. and Slater, J.A. (1995). True Bugs of the World (Hemiptera: Heteroptera) Classification and Natural History. Cornell University Press, Ithaca.
- Simon, C., Frati, F., Beckenbach, A., Crespi, B., Liu, H. and Flook, P. (1994). Evolution, weighting and phylogenetic utility of mitochondrial gene sequences and a compilation of conserved polymerase chain reaction primers. Ann.Entomol., 87: 651-701.
- Song, N. and Liang, A. (2009). The complete mitochondrial genome sequence of Geisha distinctissima (Hemiptera: Flatidae) and comparison with other hemipteran insects. Acta.Biochimica.Et.Biophysica.Sinica., 41: 206-216.
- Souza, H.V., Marchesin, S.R.C. and Itoyama, M.M. (2016). Analysis of the mitochondrial COI gene and its informative potential for evolutionary inferences in the families Coreidae and Pentatomidae (Heteroptera). Gen. Mol. Res., 15: 1-14.
- Sperling, F.A.H. and Hickey, D.A. (1994). Mitochondrial DNA sequence variation in the spruce budworm species complex (Choristoneura: Lepidoptera). Mol. Biol.Evol., 11: 656-665.
- Swofford, D.L. (2002). PAUP* Phylogenetic analysis using parsimony (and other methods). Version 4. Sinauer, Sunderland, Massachusetts.
- Tamura, K., Stecher, G., Peterson, D., Filipski, A. and Kumar, S. (2013). MEGA6: Molecular Evolutionary Genetics Analysis version 6.0. Mol. Biol.Evol., 30: 2725-2729.
- Thompson, J.D., Higgins, D.G. and Gibson, T.J. (1994). CLUSTAL W: improving the sensitivity of progressive multiple sequence alignment through sequence weighting, position specific gap penalties and weight matrix choice. Nucleic. Acids. Res., 22: 4673-4680.
- Tian, X., Xie, Q., Li, M., Gao, C., Cui, Y., Xi, L. and Bu, W. (2011). Phylogeny of pentatomomorphan bugs (Hemiptera-Heteroptera: Pentatomomorpha) based on six Hox gene fragments. Zootaxa; 2888: 57-68.
- Weirauch, C. and Schuh, R.T. (2011). Systematics and evolution of Heteroptera: 25 years of progress. Ann. Rev.Entomol., 56: 487-510.
- Zhao, Q., Wei, J., Zhao, W., Cai, B., Du, X. and Zhang, H. (2017c). The first mitochondrial genome for the subfamily Asopinae (Heteroptera: Pentatomidae) and its phylogenetic implications. Mitochondrial DNA Part B; 2: 804-805.
