Research Article - Biomedical Research (2018) Medical Diagnosis and Study of Biomedical Imaging Systems and Applications
Iris images based pre-diagnostic tool to predict obstructive lung diseases
Atul Bansal1*, Ravinder Agarwal2 and Sharma RK3
1Department of Electronics and Communication, GLA University, Mathura, UP, India
2EIED, Thapar University, Patiala, Punjab, India
3CSED, Thapar University, Patiala, Punjab, India
- *Corresponding Author:
- Atul Bansal
Department of Electronics and Communication
GLA University, India
Accepted date: March 20, 2018
DOI: 10.4066/biomedicalresearch.29-17-1998
Visit for more related articles at Biomedical ResearchAbstract
Lungs are the vital respiratory organs of the human beings. Poor respiration leads to various Obstructive Lung Diseases (OLD) such as bronchitis, asthma or even lung cancer. Pre-diagnostic tool to predict OLD using iris images has been proposed and implemented in the current research work. Two different models have been proposed to extract significant features, viz., one using wavelets and other using Gabor filter. SVM based classifier has been implemented for classifying subjects into healthy or one with obstructive lung disease. An accuracy of 89.0% and 88.0% in case of wavelet based model and Gabor filter based model, respectively, with a sample size of 100 has been obtained.
Keywords
Lungs, Iridology, Wavelet, Gabor filters, SVM, Iris images
Introduction
Thin circular diaphragm that lies between cornea and lens of the eye is known as iris. It is the colored area of an eye that surrounds dark pupil. Iridology, an alternate medicine technique examines characteristics of the iris to determine the health status of rest parts of the body [1,2]. Iridology does not diagnose any diseases, it merely reveals the weakness in a particular part of the human body. Iris is like a map of the body. Left eye corresponds to left portion and right eye to right portion of human body. Iridology charts [3] divides iris into a number of sectors/zones where each sector/zone corresponds to specific parts of the body. Iridologists use these charts to compare the specific markings, such as a dark spot, circular ring, etc. of the subject with that of healthy human iris. Based upon these observations they determine which part of human body is weak and prone to suffer from disease much prior to actual symptoms.
Iris recognition, an accurate and reliable biometric system [4], identify enrolled individual based upon iris features. Few studies [5-7] combining iris recognition algorithms and iridology to determine the status of health of an individual have been reported. Stearn et al. [1] used iridology to determine hearing loss and found an accuracy of 70%. Wibawa and Purnomo [5] employed iridology in conjunction with iris recognition system and obtained an accuracy of 94% in determining the broken tissues of pancreas. Ma and Li [6] reported an accuracy of 86.4% and 84.9% for iris based diagnosis model to determine alimentary canal disease and nerve system respectively. Similarly, Lesmana et al. [7] obtained an accuracy of 83.3% for their model to determine pancreas disorder. As of now, computer aided diagnostic tools are becoming an important area of research in medical field [8-10]. Similarly, different researchers [11,12] have proposed various methods and models related to lung diseases.
In this paper, an iridodiagnosis system, combining iridology and iris recognition technique, to predict OLD has been proposed and implemented. Due to atmospheric pollution, and certain bad habits like smoking, lungs are prone to various diseases such as bronchitis, asthma or even lung cancer. These diseases are generally diagnosed using various pathological/ clinical tests at very late stage. OLD can be predicted at a much earlier stage than actual symptoms. Spirometry is the widely used non-invasive test to assess how well lungs function and is helpful in diagnosing the OLD [13]. It measures how much air one inhales, how much one exhales and how quickly one can inhale and exhale. Smoking is one of the reasons for developing obstructive lung disease. The probability of smokers developing obstructive lung disease is higher when compared to non-smokers [14-17]. Quitting smoking and following healthy diets along with regular exercises can delay if not prevent the cancer. In this paper, experiments have been carried out on iris images to predict the OLD. Two different models based on wavelets and 2D Gabor filters for feature extraction and Support Vector Machine (SVM) as a classifier has been used to predict OLD.
Material and Methods
Proposed pre-diagnostic model consists of five stages: iris image capture, iris image pre-processing, separating region of interest, feature extraction, disease classification. These stages are discussed in following subsections.
Iris image capture
Iris image capture is the most important thing to implement iris based pre-diagnostic model. I-SCANTM-2 dual iris scanner of Cross Match Technologies Inc. [18] has been used to capture Iris images. Iris images from 100 subjects have been captured. Spirometry test has been used to diagnose the OLD in these subjects. This test uses two parameters, namely, Forced Expiratory Volume in 1 s (FEV1) and Forced Vital Capacity (FVC) [19]. The ratio of these parameters (ρ=FEV1/FVC) is less than 0.8 for a subject with high probability of suffering from obstructive lung disease. Spirometry test on 100 subjects was carried out and based upon spirometry test ratio, dataset was classified into healthy subjects and the subjects suffering from obstructive lung disease as shown in Table 1. Figure 1 shows the sample images captured by iris scanner.
| Health status of subjects | ρ | Total number of subjects | Number of smokers | Number of non-smokers |
|---|---|---|---|---|
| Suffering from obstructive lung disease | ≤ 0.7 | 25 | 25 | 0 |
| 0.7<ρ<0.8 | 24 | 22 | 2 | |
| Healthy | ≥ 0.8 | 51 | 3 | 48 |
Table 1. Dataset details.

Figure 1: Sample images captured using iris scanner.
Subjects filled a questionnaire related to the health details, such as whether cough with sputum, smoker’s cough, shortness of breath, history of TB, blood in sputum. An informed written consent of each person and ethical approval from the Institutional ethics committee was taken for this research.
Iris image pre-processing
To obtain suitable form of iris image such that significant features can be extracted, pre-processing is required. Initially, iris region is isolated from an eye image by determining the boundaries of iris using Circular Hough Transform (CHT) [20]. Next task is to normalize iris image to eliminate dimensional inconsistencies arising due to different image capturing conditions such as illumination, distance, etc. Using Daughman’s rubber sheet model [4,21] doughnut shape of iris is converted into a rectangular array of size n × m where n represents radial resolution and m represents angular resolution. Here, value of n is 100 and that of m is 500. Further, to adjust the contrast and poor illumination enhancement of normalized iris image is carried out using local histogram analysis and thresholding [22].
Separating region of interest
The health status of a particular organ of human body is reflected at the specific segment of iris. Iridology chart [3] shows lungs of human body between 2 o’clock and 3 o’clock in left eye, whereas, between 9 o’clock and 10 o’clock in right eye. To predict OLD, Region of Interest (ROI), i.e. lungs region is segmented from the normalized iris image. In present work, the size of ROI considered is 100 × 60.
Feature extraction
Iridologists compare the specific markings in the subject’s iris at a particular location with healthy human iris. Based upon comparison results, iridologists determine the weakness of a particular organ. For a pre-diagnosis system, it becomes important to extract significant features from an iris. Different researchers had employed various feature extraction algorithms [6,7] for automated iris diagnosis models.
Two different models have been proposed and implemented for predicting OLD. In Model-I, the salient features from the segmented lung region of normalized iris image are extracted using 2D wavelet tree and in Model-II, feature extraction is carried out using Gabor filter.
Using wavelet transform: Here, 2D Discrete Wavelet Transform (DWT) has been used to extract significant features from iris images. DWT decomposes an image into four subsampled images. The original image of size N × N is split into four sub-images each of size N/2 × N/2 and contains information from different frequency components. After decomposition four sub-sampled images are approximation (LL), horizontal (HL), vertical (LH) and diagonal (HH). It can be noted that (i) HH is an image that has been high passed in the horizontal and vertical directions. (ii) LH is an image that has been low passed in the vertical and high passed in the horizontal direction. (iii) HL is an image that has been high passed in the vertical and low passed in the horizontal direction. (iv) LL means low pass filtered in both directions.
Using DWT an image can be decomposed more than once. There are mainly two ways for decomposition, namely, pyramidal and packet decomposition. In case of pyramidal decomposition, further decompositions are applied only to the approximation (LL) sub-band. At each level, the approximation sub-band is further decomposed whereas, in case of packet decomposition, the decomposition is not limited to LL sub-band only rather it allows further decomposition of all sub-bands at each level. Figure 2 depicts three level pyramidal decomposition.

Figure 2: Three level pyramidal decomposition.
An attempt has also been made to study the effect of decomposition levels. Feature vector is obtained either by considering approximation coefficients after each level of decomposition or by possible combinations of these approximation coefficients. Results have been reported up to fifth level of decomposition. In this research work, experiments have been carried out using Daubechie’s db2 wavelet function.
Using Gabor filter: In this model, segmented lungs region from 2D normalized iris images is convolved with Gabor filter to extract features. The 2D Gabor filter in spatial domain is expressed as:
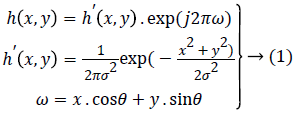
where, (x, y) is coordinates of spatial region, σ is the standard deviation represents frequency component and θ is direction parameter of filter. Iris feature vector is created by combining 12 texture energy features computed along four different directions and with three different frequencies. Initially for each filter channel (ωi, θj) (i=1, 2, 3) and (j=1, 2, 3, 4) the segmented lungs region of iris image I (x, y) is convolved with Gabor filters h (x, y) to obtain an image S (x, y) in frequency domain. The energy for each channel was then computed as:
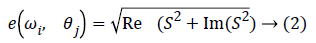
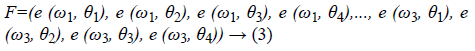
where, Re (S) and Im (S) are the real and imaginary part of image S (x, y). The feature vector so obtained is as shown in Equation 3.
Disease classification
The obtained feature vector was used for classifying the subjects into a healthy one or one prone to OLD using SVM classifier [23-26]. The SVM was proposed by Vapnik [23]. Nowadays, SVM is a popular classifier in the field of text classification, voice recognition, image recognition, pattern recognition etc. [24]. Burges [25] and Cristanini [26] provided in-depth information on SVM. It is a binary classifier and is based on the principal of structural risk minimization. In SVM, the main aim was to construct an optimal hyper plane that separates two classes. The hyper plane was constructed in such a way that the margin of separation between two classes is maximum [26,27]. In this paper, a standard SVM was created for classifying the subjects into healthy one or one prone to obstructive lung diseases.
Results and Discussions
The proposed models have been implemented using an image processing module of Matlab 7.1 on Intel Core2 Duo 1.80 GHz processor with 1GB RAM. 10-fold cross validation technique has been applied to validate the experiments. The whole dataset was divided randomly into ten equal groups. Here, nine groups were used for training the SVM and one group was used for testing. Accuracy of the system was measured for each iteration independently and overall accuracy of the system was the mean of accuracies obtained for individual iterations. Hence, there were ten iterations of training and testing the SVM. The accuracy of the proposed system was calculated by considering linear, polynomial and Gaussian RBF kernel functions for SVM.
Using wavelet transform
Features extracted as discussed in the last section are used for classification of subjects into healthy and ones suffering from OLD. Table 2 depicts the accuracy of proposed method for predicting OLD. This table shows that as the level of decomposition increases, the accuracy of the proposed system increases. It has also been observed that further decomposition beyond level 5 does not lead to improvement in accuracy.
| Kernel function/Feature vector | Polynomial (2nd degree) (in %) | Polynomial (3rd degree) (in %) | RBF (in %) | Sigmoid (in %) |
|---|---|---|---|---|
| LL1 | 77 | 76 | 80 | 80 |
| LL2 | 77 | 77 | 81 | 81 |
| LL3 | 78 | 77 | 82 | 81 |
| LL4 | 79 | 79 | 82 | 82 |
| LL5 | 80 | 82 | 83 | 83 |
| LL1+LL2 | 78 | 81 | 82 | 80 |
| LL1+LL3 | 78 | 81 | 82 | 80 |
| LL1+LL4 | 78 | 82 | 82 | 82 |
| LL1+LL5 | 80 | 83 | 82 | 82 |
| LL2+LL3 | 80 | 80 | 82 | 80 |
| LL2+LL4 | 78 | 80 | 82 | 81 |
| LL2+LL5 | 78 | 81 | 81 | 81 |
| LL3+LL4 | 78 | 81 | 82 | 82 |
| LL3+LL5 | 79 | 83 | 82 | 82 |
| LL4+LL5 | 80 | 84 | 83 | 82 |
| LL1+LL2+LL3 | 83 | 84 | 84 | 83 |
| LL1+LL2+LL4 | 83 | 85 | 86 | 84 |
| LL1+LL2+LL5 | 82 | 85 | 86 | 84 |
| LL1+LL3+LL4 | 82 | 85 | 87 | 84 |
| LL1+LL3+LL5 | 83 | 85 | 87 | 85 |
| LL1+LL4+LL5 | 83 | 85 | 87 | 85 |
| LL2+LL3+LL4 | 82 | 83 | 86 | 83 |
| LL2+LL3+LL5 | 82 | 83 | 86 | 84 |
| LL2+LL4+LL5 | 82 | 84 | 87 | 84 |
| LL3+LL4 +LL5 | 82 | 84 | 86 | 84 |
| LL1+LL2+LL3+LL4 | 84 | 85 | 87 | 86 |
| LL1+LL2+LL3+LL5 | 84 | 86 | 88 | 86 |
| LL1+LL2+LL4+LL5 | 84 | 86 | 88 | 86 |
| LL1+LL3+LL4+LL5 | 85 | 86 | 88 | 87 |
| LL2+LL3+LL4+LL5 | 85 | 85 | 88 | 87 |
| LL1+LL2+LL3+LL4+LL5 | 85 | 87 | 89 | 87 |
Table 2. Overall accuracy with different feature vectors and kernel functions for predicting obstructive lung disease.
It has also been observed that performance of the system improves as the size of feature vector is increased by considering the combinations of LL coefficients. It is clear from the results that the combination of LL1, LL2, LL3, LL4 and LL5 along with RBF kernel function gives the maximum accuracy of 89.0% in predicting obstructive lung disease.
Table 3 illustrates the accuracy of proposed system with feature vector taken as a combination of LL1, LL2, LL3, LL4 and LL5 for subjects with different spirometry test ratio.
| ρ | Number of subjects | Accuracy (in %) |
|---|---|---|
| ≤ 0.7 | 25 | 88 |
| 0.7<ρ<0.8 | 24 | 87.5 |
| ≥ 0.8 | 51 | 90.2 |
Table 3. Accuracy using wavelet features for subjects with different ρ.
Figure 3 depicts that 95.3% of the subjects identified as having obstructive lung disease are from the category of smokers and 97.8% of the subjects identified as healthy are from the category of non-smokers.

Figure 3: Distribution of smokers and non-smokers in subjects identified as healthy and the subjects identified as having OLD using wavelet features.
Results using Gabor filter
In this model, features have been extracted by convolving the segmented lung region with 2D Gabor filter. The maximum accuracy of the proposed method with these features was achieved when RBF kernel function was employed. The accuracy using 10-fold cross validation was 88.0%. Table 4 illustrates the accuracy of the proposed method for subjects with different spirometry test ratio.
| ρ | Number of subjects | Accuracy (in %) |
|---|---|---|
| ≤ 0.7 | 25 | 88 |
| 0.7<ρ<0.8 | 24 | 83.3 |
| ≥ 0.8 | 51 | 90.2 |
Table 4. Accuracy using Gabor filter for subjects with different ρ.
Figure 4 depicts that 95.2% of the subjects identified as having obstructive lung disease were from the category of smokers and 95.7% of the subjects identified as healthy were from the category of non-smokers.

Figure 4: Distribution of smokers and non-smokers in subjects identified as healthy and the subjects identified as having OLD using Gabor filters.
Table 5 shows the comparison of proposed models to predict obstructive lung disease with existing iridodiagnosis models. The obtained accuracy with higher sample size demonstrates the effectiveness of the proposed system.
| Disease | Feature extraction technique | Classifier | No. of samples | Accuracy (in %) |
|---|---|---|---|---|
| Detecting broken tissues in pancreas [5] | Minimum filter | Visual inspection | 34 | 94 |
| Alimentary canal [6] | Gabor filter | SVM | 53 | 84.9 |
| Nerve system [6] | Gabor filter | SVM | 44 | 86.4 |
| Hearing loss [1] | Digital image enhancement | Visual inspection | 53 | 70 |
| Pancreas disorder [7] | GLCM | Neighborhood based modified back propagation (ANMBP) | 50 | 83.3 |
| Pulmonary diseases [28] | Fuzzy C-means clustering | Gray level analysis | 32 | 84.3 |
| Proposed model-1 | Gabor filter | SVM | 100 | 88 |
| Proposed model-2 | Wavelet transform | SVM | 100 | 89 |
Table 5. Comparison of accuracy of proposed obstructive lung disease prediction models with existing techniques.
It has been observed that system’s performance depends upon various factors [5]. The way samples of iris images were collected affects the system performance. External factors such as illumination, rotation of eyes, blinking of eyes and usage of iris scanner needs to be considered while acquiring iris images. Subject’s unwillingness to discuss their habits and health conditions with researchers is another major aspect affecting the system performance.
Conclusion
A system to predict the OLD using iris images has been proposed and implemented using two different approaches, namely, wavelets based and Gabor filter based. The proposed model combines iridology with iris recognition system. SVM based classifier has been implemented for classifying subjects into healthy or one prone to OLD. In comparison to earlier iris diagnosis systems maximum obtained accuracy of 89.0% with a sample size of 100 is encouraging and shows the effectiveness of proposed system. More features and advanced classifiers such as Support Tensor Machines may lead to higher accuracy.
Acknowledgement
The authors would like to acknowledge “GLA University, Mathura” for partially supporting this research. The authors would also like to acknowledge “Dr. Arun Bansal”, “Dr. Poonam Agarwal” and all subjects who helped in developing the database.
References
- Stearn N, Swanepoel DW. Identifying hearing loss by means of iridology. Afr J Trad Compl Alt Med 2007; 4: 205-210.
- Jensen B. The science and practice of iridology. California Bernard Jensen Co. 1985; 1.
- Jensen B. Iridology charts, http: //www.bernardjensen.com/iridology-charts-c-38_42.html, accessed June 2011.
- Daughman J. High confidence visual recognition of persons by a test of statistical independence. IEEE Trans Patt Anal Mac Intel 1993; 15: 1148-1161.
- Wibawa AD, Purnomo MH. Early detection on the condition of pancreas organ as the cause of diabetes mellitus by real time iris image processing. IEEE Asia Pacific Conf Circ Sys 2006; 1008-1010.
- Ma L, Li N. Texture feature extraction and classification for iris diagnosis. International conference on medical biometrics. Lect Notes Comp Sci Springer-Verlag 2007; 168-175.
- Lesmana IPD, Purnama IKE, Purnomo MH. Abnormal condition detection of pancreatic beta-cells as the cause of diabetes mellitus based on iris image. Int Conf Instr Commun Info Technol Biomed Eng 2011; 150-155.
- Kumar A, Anand S. EEG Signal processing for monitoring depth of anesthesia. IETE Tech Rev 2006; 23: 179-186.
- Ali P, Ramezani M, and Ghadimi N. A hybrid neural network-gray wolf optimization algorithm for melanoma detection. Biomed Res 2017; 28; 3408-3411.
- Navid R, Ramezani M, Ghadimi N. Imperialist competitive algorithm-based optimization of neuro-fuzzy system parameters for automatic red-eye removal. Int J Fuzzy Sys 2017; 1-13.
- Smith, E, Stein P, Furst J, Raicu DS. Weak segmentations and ensemble learning to predict semantic ratings of lung nodules. Mac Learn Appl (ICMLA) 12th Int Conf 2013; 2: 519-524.
- Wang J, Valle MD, Goryawala M, Franquiz JM, Mcgoron AJ. Computer-assisted quantification of lung tumors in respiratory gated PET/CT images: phantom study. Med Biol Eng Comput 2010; 48: 49-58.
- Pierce R. Spirometry: an essential clinical measurement. Aus Fam Phys 2005; 37: 535-539.
- Lundback B. Not 15 but 50% of smokers develop COPD?-Report from obstructive lung disease Northern Sweeden studies. Resp Med 2003; 97: 115-122.
- Vestbo J. Definition and overview, global strategy for the diagnosis, management, and prevention of chronic obstructive pulmonary disease. Glob Init Chron Obstruct Lung Dis 2013; 1-7.
- Yuh C, Huang T. A clinical guide to occupational and environmental lung diseases. Humana Press 2012; 266.
- Min JY, Min KB, Cho S, Paek D. Combined effect of cigarette smoking and sulphur dioxide on lung functions in Koreans. J Toxicol Env Health 2008; 71: 301-303.
- Agarwal R, Awasthi A, Singh N, Gupta P K, Mittal S. Epidemiology on healthy people living close to agriculture crop residue burning sites and its relation with their PFTs. Int J Env Health Res 2013; 23: 281-295.
- I-SCAN-2 Dual iris scanner. http: //www. ossmatchcr.com/i-scan-2.php 2011.
- Wildes R, Asmuth J, Green G, Hsu S, Kolczynski R, Matey J, McBride S. A system for automated iris recognition. IEEE Workshop Appl Comp Vis Sarasota FL 1994; 121-128.
- Daughman J. How iris recognition works? IEEE Trans Circ Sys Video Technol 2004; 14: 21-30.
- Zhu Y, Tan T, Wang Y. Biometric personal identification based on iris patterns. Proc IEEE Int Conf Patt Recogn 2000; 2801-2804.
- Cortes C, Vapnik V. Support vector networks-machine learning. Kluwer Acad Publ Boston 1995; 273-297.
- Kim KA, Chai JY, Yoo TK, Kim SK, Chung K, Kim DW. Mortality prediction of rats in acute hemorrhagic shock using machine-learning techniques. Med Biol Eng Comput 2013; 51: 1059-1067.
- Burges CJC. A tutorial on support vector machines for pattern recognition. Kluwer Acad Publ Boston 1998.
- Cristianini N, Shawe TD. An introduction to support vector machines and other kernel-based learning methods. Cambridge Univ Press Cambridge 2001.
- Haykin S. Neural networks-a comprehensive foundation. Pearson Educ (2nd Edn.) 2004.
- Sivasankar K, Sujaritha M, Pasupathi P, Muthukumar S. FCM based iris image analysis for tissue imbalance stage identification. Proc Int Conf Emerg Trends Sci Eng Technol 2012; 210-215.