Research Article - Journal of Biochemistry and Biotechnology (2017) Industrial Biotechnology
Investigation of the optimized dextran-degrading enzyme conditions on the decomposition of different molecular weights of pure dextran using response surface methodology.
Boontiwa Ninchan1, Wirat Vanichsriratana1, Klanarong Sriroth1,2*
1Department of Biotechnology, Faculty of Agro-industry, Kasetsart University, 10900, Thailand
2Mitr Phol Group, Bangkok, Thailand
- Corresponding Author:
- Klanarong Sriroth
Department of Biotechnology
Kasetsart University/ Mitr Phol Group
Thailand
Tel: +66 2 940 5634
E-mail: aapkrs@ku.ac.th
Accepted Date: March 03, 2017
Citation: Ninchan B, Vanichsriratana W, Sriroth K. Investigation of the optimized dextran-degrading enzyme conditions on the decomposition of different molecular weights of pure dextran using response surface methodology. Arch Ind Biotechnol. 2017;1(1):8-19
Abstract
The elimination of various molecular weights of contaminated dextran in sugar processing is quite complicated, especially using enzymatic decomposition. Many factors including enzyme concentration, retention time, pH, temperature, and sucrose concentration affect enzyme hydrolysis. The optimizing conditions of various molecular weights of dextran removal were investigated using response surface methodology. The optimum hydrolyzed conditions of 1,500 ?g/mL of all molecular weights of pure dextran from the one-factor-at-a-time (OFAT) experiments were: dextranase (Amano Enzyme Inc., Japan) at 5-15 ppm total soluble solids for 5-15 min at 50-65?C with pH 4.5-6.5 and sucrose concentration at 15-25%. The results from the OFAT experiments used a Box-Benhken experimental design with four factors and three levels that achieved fit models that predicted the dextran removal under different conditions of various molecular weights of pure dextran. The low molecular weight of pure dextran (LMW) makes it a less complex structure with smaller molecules and it is easily degraded; therefore, it showed the highest percentage of dextran removal under a wide range of conditions of dextran decomposition than the higher molecular forms consisting of medium molecular weight (MMW) and high molecular weight (HMW) under the same conditions as shown using contour plots. The complete hydrolysis conditions that were calculated from the predicted models all of molecular weights of pure dextran were pH 5.5 and sucrose concentration 15-15.2% with slightly different temperatures of 53.2, 52.4, and 51.5?C and dextranase concentration at 12.4, 13.1, and 14.8 ppm total soluble solids for LMW, MMW, and HMW, respectively.
Keywords
Dextranase, Dextran, Response surface methodology, Box-Benhken design
Introduction
Dextran is a bacterial homopolysaccharide with a largely linear structure of 50-97% glucose units linked by α-(1-6) linked glucosidic bonds [1,2] with α-(1-3) branch linkages and may contain other branch linkages such as α-(1-2) or -(1-4) [3-5]. Dextran is synthesized from sucrose by the dextransucrase enzyme (E.C. 2.4.1.5) that is secreted by microorganisms such as Leuconostoc sp., Streptococcus sp., and Lactobacillus sp., which are most commonly found in deteriorated cane. The structure of dextran, its degree of branching and structural properties varies widely depending on the specific dextran-producing microbial strain and the type of dextransucrase enzyme [3-7]. Dextran as a sticky polymer is widely applied in the pharmaceutical, biomedical, chemical, and food industries for uses such as drug delivery, blood plasma volume expansion, cell encapsulation, emulsification, thickening, tissue engineering, and as crosslinked dextran for separation and purification of protein [3,8-10], in contrast with the sugar industry. The presence of dextran in sugarcane or the process streams in a sugar factory not only indicates the low quality of the cane as the raw material and lowers the efficiency of the sugar production system, but it also has a negative impact upon the sugar and results in an economic loss. The processing problems clearly occur due to increased viscosity that leads to poor clarification, a slow filtration process, lower evaporation rates, and crystal elongation [1,4,11-13]. The effect of dextran on viscosity is related directly to the increase in the molecular weight of dextran [12-15]. The molecular weight range of dextran is 1,500 to several million Da [12]. Moreover, high molecular weight dextran detrimentally affects the hardto- boil phenomenon which occurs in massecuite samples [4] and the crystallization of calcium carbonate during the clarification process [14]. Aquino and Franco [6] studied dextran molecular mass distribution (Mw) in Brazilian sugar and classified it into three groups; dextran with Mw>1 million Da (Group 1-high molecular weight), 85,000 Da<Mw <1 million Da (Group 2- medium molecular weight) and Mw<85,000 Da (Group 3-lower molecular weight or clinical dextran).
One of the methods for dextran elimination in sugar processing streams uses dextranase, an enzyme (EC 3.2.1.11; 1,6-α-Dglucan- 6-glucanohydrolase). This enzyme hydrolyzes the α-D-1,6-glucosidic linkage of the linear chain of the dextran structure at random endogenous sites [5] which breaks highmolecular- weight dextran into smaller, more manageable molecular dextran, and eventually into oligosaccharides, with isomaltotriose, isomaltose, and glucose as the final products [16-18]. The enzyme is produced by different microorganisms— fungi (Penicillium sp., Chaetomium sp., Fusarium sp.), bacteria (Streptococcus sp., Thermoanarobacterium sp.), yeast (Lipomyces sp.), and recombinant microorganisms with different optimum conditions including the pH range and temperature, dependent on the source of enzyme production [18,19].
The application of dextranase in sugar manufacture has not yet been optimized because of the confusion over which dextranase to use, and how, and where to add the dextranase [20]. Each step of sugar processing involves different conditions of temperature, pH, and sucrose concentration. These conditions affect enzyme activity and the ability to hydrolyze the molecules of dextran. Consequently, if the optimum conditions of dextranase for dextran decomposition are known, these can be utilized so the enzyme can be most effective in dextran removal. This research focused on the investigation of the effects of temperature, sucrose concentration, pH, retention time, and the concentration of the enzyme on the degradation of various molecular weights of pure dextran by the enzyme, dextranase. To determine the predicted model of dextran removal, the interaction of variables, and optimization of dextranase application for dextran hydrolysis were designed using response surface methodology.
Materials and Methods
Materials
Samples of various molecular weights of pure dextran— low molecular weight (LMW: 40 kDa, Sigma-Aldrich, Denmark), medium molecular weight (MMW: 500 kDa, Serva Electrophoresis GmbH, Germany), and high molecular weight (HMW: 1,500-2,800 kDa, Sigma-Aldrich, Denmark)—were used as substrate in the experiments. Commercial dextranase was obtained from Amano Enzyme Inc., Japan that was produced from Cheotomium sp. (enzyme activity 30,000 U/mL).
Methods
Experimental design of response surface methodology: A one-factor-at-a-time (OFAT) experiment involves changing only one variable parameter while others are fixed at certain values for a selected experimental range of each of the independent variables. The different molecular weights of pure dextran (1,500 μg/mL) were hydrolyzed by dextranase under different conditions: 1) enzyme concentration (2, 5, 10, 15, 20, 40 ppm total soluble solids); 2) retention time (5, 10, 15, 20, 30 min); 3) temperature (35, 45, 50, 55, 60, 65, 70, 75, 80°C); 4) pH (4.5, 5, 5.5, 6, 6.5, 7, 7.5, 8); and 5) sucrose concentration (15, 30, 65, 85%). The hydrolysis reaction was stopped by boiling after 5 min, followed by cooling at room temperature and then the percentage of dextran removal was determined.
The response surface methodology involved a Box-Behnken experimental design that was analyzed from the results of the OFAT experiment. The four independent variables were enzyme concentration (X1), temperature (X2), sucrose concentration (X3), and pH (X4) and the response (Y) was the percentage of dextran removal at three levels that were coded as -1, 0, 1.
Analysis
Determination of dextran content: The Modified Haze Method [17,21-23] was applied. Heat-stable alpha amylase (Novo Termamyl 120 L) was added into the diluted samples (25 mL) and then incubated at 90°C in a water bath for 15 min. After cooling, 10 mL of trichloro acetic (10% w/v) was added to the diluted samples and left for 2 min and then 3 g of celite (Imerys, USA) was added into the diluted samples before filtration through Whatman No. 3 paper. A sample of 3 mL of filtrate was well mixed with 3 mL of absolute ethanol (VWR Chemicals, France) After 2 min of setting, the liquid samples were determined for absorbance at 720 nm using a spectrophotometer (Genesys 10 UV, Thermo Spectronic, USA). The absorbance readings after correction with the blank were plotted with the standard curve for dextran concentration and then the percentage of dextran removal was calculated as:
Dextran removal (%) = [(Dcontrol – Dtreatment)/Dcontrol] × 100
Statistical analysis
The experiments used the Box-Behnken design software in the MINITAB version 17.0 computer packages. The average results of duplicates were calculated using analysis of various (ANOVA) at the 95% confidence level (p<0.05). The regression coefficient, lack of fit, and the coefficient of determination (R2) were used to consider the fit models. In addition, the response surface and contour plots were presented using statistical analysis.
Results and Discussion
OFAT experiments
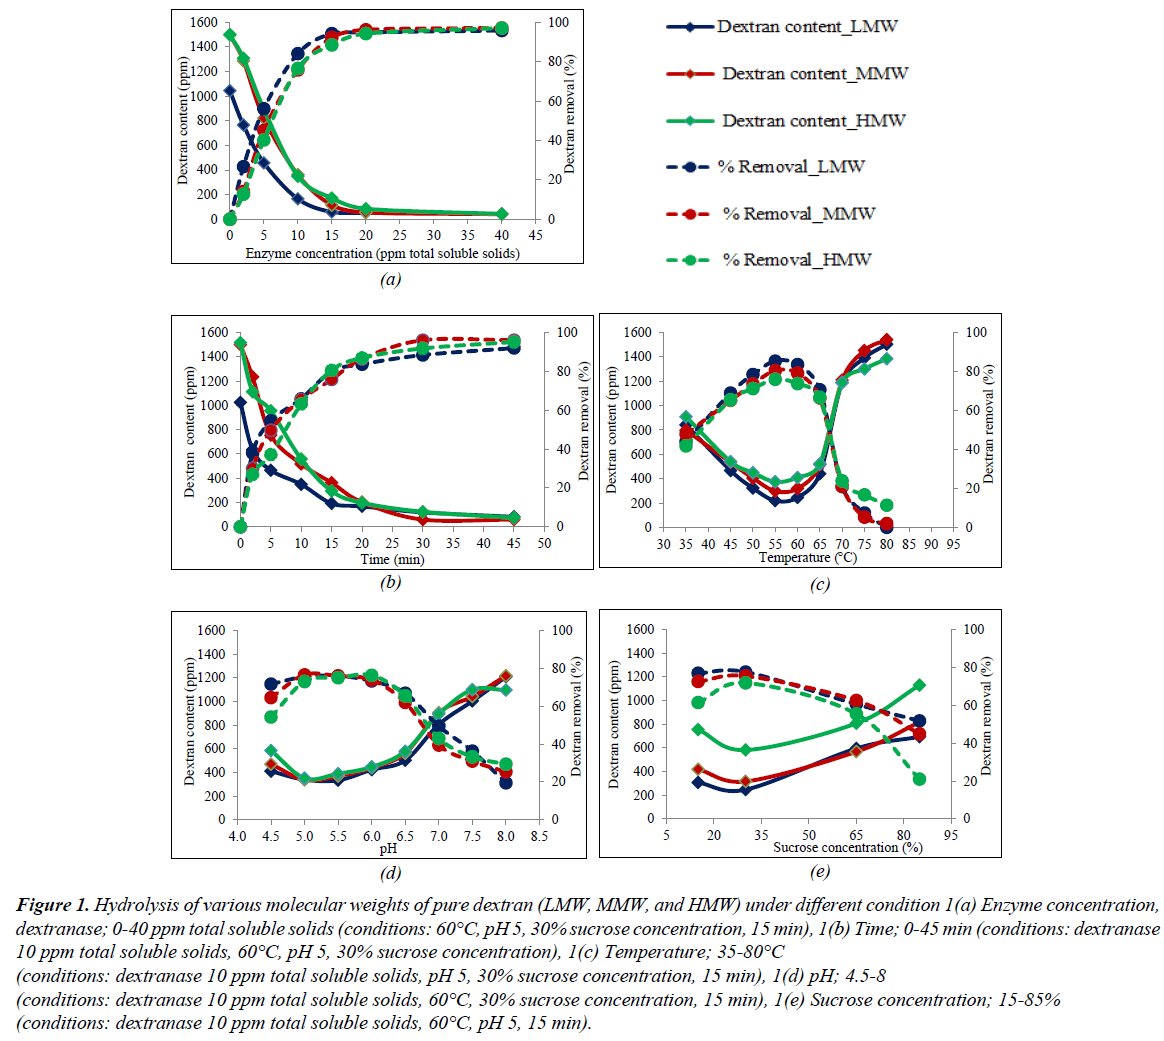
The results of the OFAT experiments on the dextran hydrolysis of the different molecular weights of pure dextran (LMW, MMW, and HMW) are shown in Figure 1a-e. The effect of dextranase concentration (0-40 ppm total soluble solids) is shown in Figure 1a while the other conditions were fixed at 60°C, pH 5, 30% sucrose concentration, and 15 min; the results showed that when the level of dextranase increased from 0 to 10 ppm total soluble solids, the dextran content of LMW, MMW, and HMW continuously decreased from 1,500 μg/mL to 165, 350, and 362 g/mL (dextran removal was 84, 77, and 76%, respectively) within 15 min. Dextranase could hydrolyze high molecular weight dextran into smaller, more manageable molecular dextran, and eventually into oligosaccharides in less time [16,17,24]. The results of LMW showed a higher rate of hydrolysis by the dextranase than did MMW and HMW because LMW is a less complex structure and is easily degraded by the enzyme. Increasing the dextranase from 10 to 40 ppm total soluble solids, resulted in the dextran content decreasing slowly and dextran removal was constant after 20 ppm total soluble solids for all pure dextran samples. Furthermore, the retention time for the hydrolysis of all the pure dextran slowly decreased after 15 min as shown in Figure 1b. The effects of different temperature (35-80°C) on dextran hydrolysis are shown in Figure 1c; the dextran content significantly decreased in the range 35-55°C, with the maximum hydrolysis of LMW, MMW, and HMW being 85, 81, and 76% of dextran removal, respectively, at 55°C and when the temperature was further increased (>55°C), the efficiency of hydrolysis decreased. This commercial dextranase was produced from the fungus, Chaetomium gracile that was capable of hydrolyzing at slightly higher temperature [18], so at 65°C, all of the molecular weights of pure dextran was hydrolyzed (∼70%), but when the temperature was increased to more than 70°C, the dextran removed was less than 20% due to the high temperature denaturing the enzyme which in turn resulted in a decrease in enzyme activity [2,24]. In the optimum temperature range (50-65°C), dextranase showed a high efficiency in degrading the dextran molecules; consequently, LMW showed a higher percentage of dextran removal than MMW and HMW in this range. The enzyme dextranase, derived from C. gracile, can maintain activity over a wide pH range from 5.5 to 11 [18] but the clearly optimum pH value was slightly acid as shown in Figure 1d. From the results, of the pure dextran, dextranase could hydrolyze 55-76% at pH 4.5-6.5 and 20-40% at pH 7.0-8.0. The pH range was the one of parameters affecting enzyme hydrolysis but not significantly for the different molecular weights of pure dextran. The concentration of sucrose in contaminated dextran solution had the main effect on enzyme hydrolysis. The results of sucrose concentration (15, 30, 65, and 85%) on hydrolysis of LMW, MMW, and HMW are shown in Figure 1e. When the sucrose concentration in solution increased, the efficiency of hydrolysis decreased due to the high sucrose concentration having a marked inhibitory effect [25]. The hydrolysis conditions with HMW showed the lowest dextran removal perhaps due to its complex structure and also due to the interference of high sucrose concentration resulting in low efficiency of enzyme degradation.
Figure 1: Hydrolysis of various molecular weights of pure dextran (LMW, MMW, and HMW) under different condition 1(a) Enzyme concentration, dextranase; 0-40 ppm total soluble solids (conditions: 60°C, pH 5, 30% sucrose concentration, 15 min), 1(b) Time; 0-45 min (conditions: dextranase 10 ppm total soluble solids, 60°C, pH 5, 30% sucrose concentration), 1(c) Temperature; 35-80°C
(conditions: dextranase 10 ppm total soluble solids, pH 5, 30% sucrose concentration, 15 min), 1(d) pH; 4.5-8
(conditions: dextranase 10 ppm total soluble solids, 60°C, 30% sucrose concentration, 15 min), 1(e) Sucrose concentration; 15-85%
(conditions: dextranase 10 ppm total soluble solids, 60°C, pH 5, 15 min).
Box-Behnken experimental design
All of the results from OFAT experiments were selected to further analyze the optimization of LMW, MMW, and HMW hydrolysis by dextranase using the Box-Behnken experimental design as shown in Table 1. The 27 experiments were investigated as shown in Table 2.
| Variable | Unit | Code | Level | ||
|---|---|---|---|---|---|
| -1 | 0 | 1 | |||
| Enzyme concentration | ppm total soluble solids | X1 | 5 | 10 | 15 |
| Temperature | °C | X2 | 50 | 60 | 70 |
| Sucrose concentration | % | X3 | 15 | 30 | 65 |
| pH | X4 | 5.5 | 6 | 6.5 | |
Table 1: Experimental Box-Behnken design.
| Experiment | Code | Dextran removal (Y) (%) |
|||||||||||
|---|---|---|---|---|---|---|---|---|---|---|---|---|---|
| X1 | X2 | X3 | X4 | Molecular weight of pure dextran | |||||||||
| LMW | MMW | HMW | |||||||||||
| 1 | -1 | -1 | 0 | 0 | 65.7 | ± | 5.1 | 49.1 | ± | 6.2 | 22.1 | ± | 0.6 |
| 2 | 1 | -1 | 0 | 0 | 92.6 | ± | 0.0 | 94.2 | ± | 0.8 | 88.3 | ± | 1.4 |
| 3 | -1 | 1 | 0 | 0 | 20.2 | ± | 4.4 | 6.2 | ± | 2.9 | 14.9 | ± | 0.6 |
| 4 | 1 | 1 | 0 | 0 | 47.5 | ± | 2.7 | 18.5 | ± | 0.9 | 24.2 | ± | 0.2 |
| 5 | 0 | 0 | -1 | -1 | 86.7 | ± | 0.6 | 73.5 | ± | 1.4 | 67.6 | ± | 1.5 |
| 6 | 0 | 0 | 1 | -1 | 47.1 | ± | 1.0 | 62.5 | ± | 0.1 | 21.6 | ± | 0.9 |
| 7 | 0 | 0 | -1 | 1 | 74.1 | ± | 0.0 | 61.7 | ± | 1.1 | 48.1 | ± | 0.3 |
| 8 | 0 | 0 | 1 | 1 | 46.8 | ± | 3.9 | 27.5 | ± | 1.1 | 25.4 | ± | 0.4 |
| 9 | -1 | 0 | 0 | -1 | 60.5 | ± | 1.4 | 57.8 | ± | 0.0 | 41.7 | ± | 0.6 |
| 10 | 1 | 0 | 0 | -1 | 93.6 | ± | 0.2 | 83.2 | ± | 2.2 | 88.4 | ± | 1.1 |
| 11 | -1 | 0 | 0 | 1 | 52.0 | ± | 0.8 | 48.9 | ± | 1.6 | 37.9 | ± | 0.9 |
| 12 | 1 | 0 | 0 | 1 | 91.9 | ± | 1.3 | 86.2 | ± | 1.1 | 85.5 | ± | 0.9 |
| 13 | 0 | -1 | -1 | 0 | 77.0 | ± | 1.4 | 76.7 | ± | 2.4 | 60.9 | ± | 1.2 |
| 14 | 0 | 1 | -1 | 0 | 9.3 | ± | 0.1 | 9.8 | ± | 0.5 | 9.8 | ± | 0.8 |
| 15 | 0 | -1 | 1 | 0 | 29.3 | ± | 0.5 | 21.8 | ± | 2.6 | 25.4 | ± | 0.6 |
| 16 | 0 | 1 | 1 | 0 | 30.8 | ± | 5.2 | 19.6 | ± | 1.8 | 10.3 | ± | 2.1 |
| 17 | -1 | 0 | -1 | 0 | 44.2 | ± | 4.5 | 42.9 | ± | 3.3 | 27.2 | ± | 0.7 |
| 18 | 1 | 0 | -1 | 0 | 93.4 | ± | 0.5 | 87.3 | ± | 1.6 | 76.6 | ± | 0.4 |
| 19 | -1 | 0 | 1 | 0 | 13.6 | ± | 3.3 | 16.9 | ± | 0.0 | 12.2 | ± | 0.6 |
| 20 | 1 | 0 | 1 | 0 | 60.5 | ± | 2.9 | 55.2 | ± | 0.1 | 49.5 | ± | 0.8 |
| 21 | 0 | -1 | 0 | -1 | 93.0 | ± | 0.4 | 88.4 | ± | 3.8 | 74.0 | ± | 2.3 |
| 22 | 0 | -1 | 0 | -1 | 40.0 | ± | 1.2 | 4.05 | ± | 0.5 | 34.9 | ± | 0.7 |
| 23 | 0 | -1 | 0 | 1 | 87.0 | ± | 0.1 | 74.7 | ± | 0.4 | 66.3 | ± | 0.3 |
| 24 | 0 | -1 | 0 | 1 | 19.0 | ± | 0.7 | 3.7 | ± | 0.4 | 8.0 | ± | 0.1 |
| 25 | 0 | 0 | 0 | 0 | 91.4 | ± | 1.9 | 78.4 | ± | 0.4 | 69.8 | ± | 1.7 |
| 26 | 0 | 0 | 0 | 0 | 88.1 | ± | 1.1 | 77.6 | ± | 0.2 | 63.3 | ± | 0.3 |
| 27 | 0 | 0 | 0 | 0 | 91.4 | ± | 0.7 | 74.9 | ± | 0.2 | 66.5 | ± | 0.5 |
Table 2: Box-Behnken experimental design for the optimization of the hydrolysis of various molecular weights of pure dextran.
Based on the experiments shown in Table 2, quadratic regression models were calculated for the hydrolysis of LMW, MMW, and HMW to predict the dextran removal as shown in equations (1), (2), and (3), respectively.
Y=-913+5.8X1+28.40X2–3.65X3+85X4–0.333X1 2–0.2387X2 2– 0.03518X3 2 – 5.3X4 2 +0.0020X1X2 +0.0115X1X3 + 0.68X1X4 +0.0721X2X3 –0.750X2X4 +0.250X3X4 ……… (1)
Y=-1123+7.1X1+27.04X2+0.37X3+152X4–0.288X1 2– 0.2895X2 2–0.02390X3 2–17.1X4 2–0.1640X1X2+0.0011X1X3 +1.99X1X4+0.0748X2X3 +0.665X2X4 -0.577X3X4 ……......(2)
Y=-1112+25.62X1+30.22X2– 2.38X3+84X4–0.197X1 2–0.2057X2 2– 0.03124X3 2–4.3X4 2–0.2845X1X2 –0.0209X1X3 + 0.06X1X4 + 0.0323X2X3 –0.960X2X4 +0.446X3X4 …….(3)
Where Y is the predicted response variable (the percentage of dextran removal) and X1 , X2, X3, and X4 are the independent variables that were coded.
The coefficients of the models and independent variables, the lack of fit, and the coefficients of determination (R2) were considered to appraise the quality of the models to predict the dextran removal using ANOVA as shown in Table 3. The fit model or the adequate equation should be significant (p-value<0.05) and have a non-significant lack of fit (p-value>0.05). Moreover, the value for R2 should be high. From the results in Table 3, the p-value of models and the lack of fit were less than 0.05 and more than 0.05, respectively. Consequently, all of the equations were suitable to use for further prediction at the 95% confidence level. The values of the regression coefficient (R2) of all models were 95.50, 97.20, and 96.63% for LMW, MMW, and HMW, respectively, with just 4.50, 2.80, and 3.37%, respectively, of the variance in the experiments not explained by these models. Therefore, all models were suitable and could predict the effects of parameters on dextran hydrolysis or the percentage of dextran removal.
| Factor | Molecular weight of pure dextran | |||||
|---|---|---|---|---|---|---|
| LMW | MMW | HMW | ||||
| Coefficient | p-Value | Coefficient | p-Value | Coefficient | p-Value | |
| Model | -913 | 0.000 | -1123 | 0.000 | -1112 | 0.000 |
| X1 | 5.8 | 0.000 | 7.1 | 0.000 | 25.62 | 0.000 |
| X2 | 28.4 | 0.000 | 27.04 | 0.000 | 30.22 | 0.000 |
| X3 | -3.65 | 0.000 | 0.37 | 0.000 | -2.38 | 0.000 |
| X4 | 85 | 0.251 | 152 | 0.075 | 84 | 0.171 |
| X12 | -0.333 | 0.049 | -0.288 | 0.046 | -0.197 | 0.048 |
| X22 | -0.239 | 0.000 | -0.290 | 0.000 | -0.206 | 0.000 |
| X32 | -0.035 | 0.001 | -0.024 | 0.003 | -0.031 | 0.000 |
| X42 | -5.3 | 0.733 | -17.1 | 0.211 | -4.3 | 0.737 |
| X1X2 | 0.002 | 0.982 | -0.164 | 0.049 | -0.285 | 0.002 |
| X1X3 | 0.012 | 0.737 | 0.001 | 0.969 | -0.021 | 0.457 |
| X1X4 | 0.68 | 0.706 | 1.99 | 0.208 | 0.06 | 0.967 |
| X2X3 | 0.072 | 0.001 | 0.075 | 0.000 | 0.032 | 0.035 |
| X2X4 | -0.750 | 0.410 | 0.665 | 0.391 | -0.960 | 0.205 |
| X3X4 | 0.250 | 0.469 | -0.577 | 0.065 | 0.446 | 0.128 |
| Lack of fit | 0.688 | 0.097 | 0.160 | |||
| R2 (%) | 95.50 | 97.20 | 96.63 | |||
Table 3: Analysis of variance of quadratic regression models on hydrolysis of various molecular weights of pure dextran.
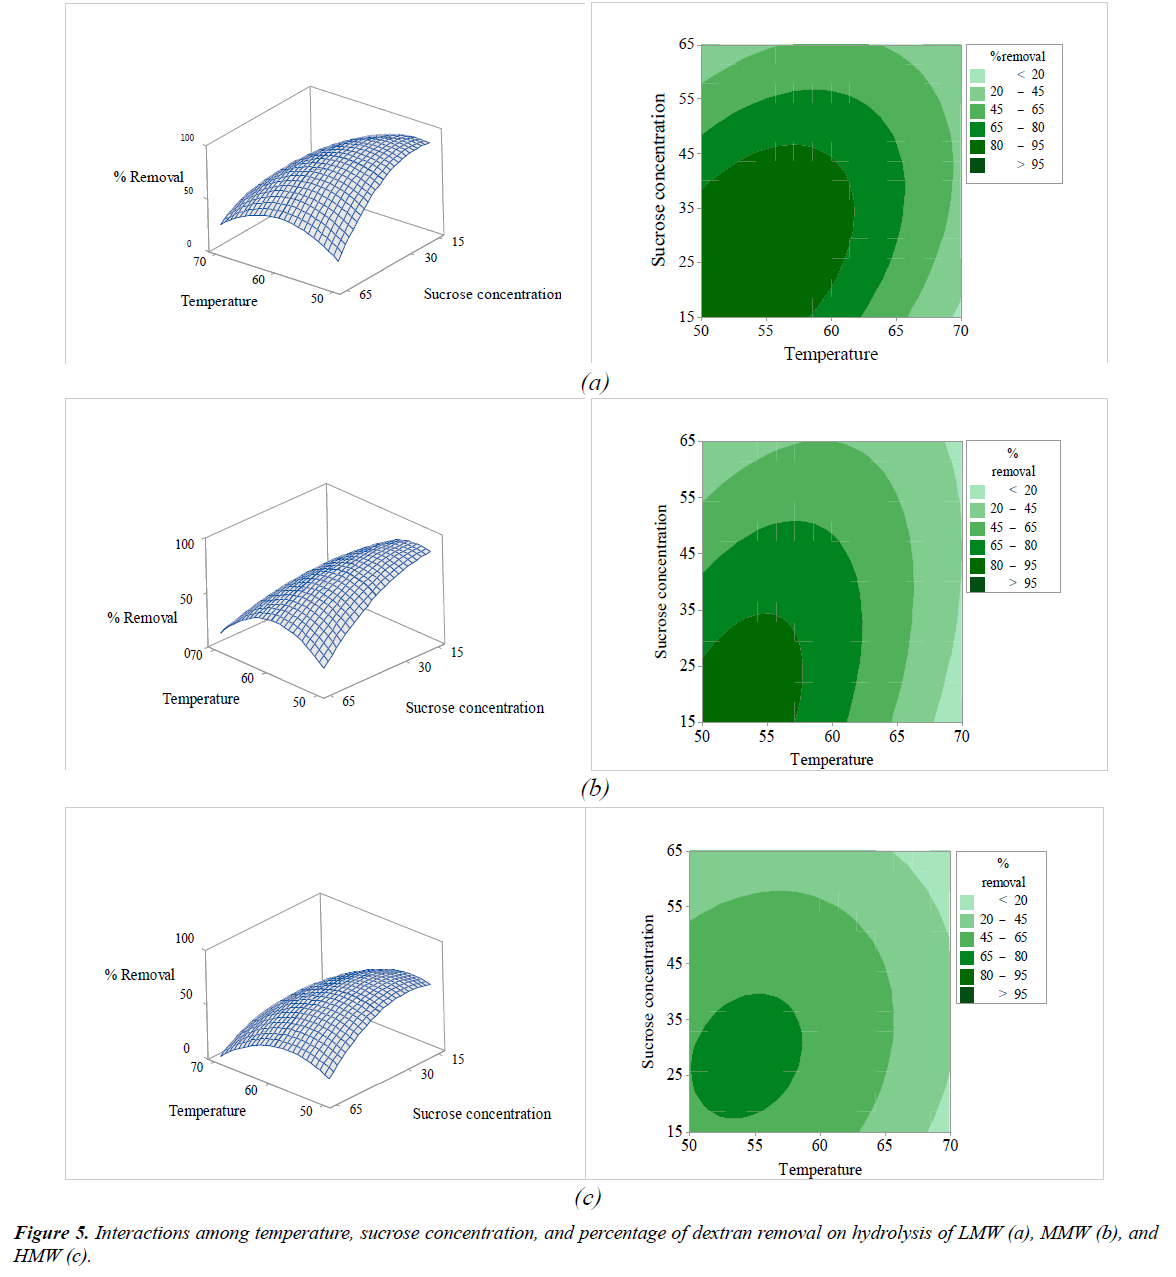
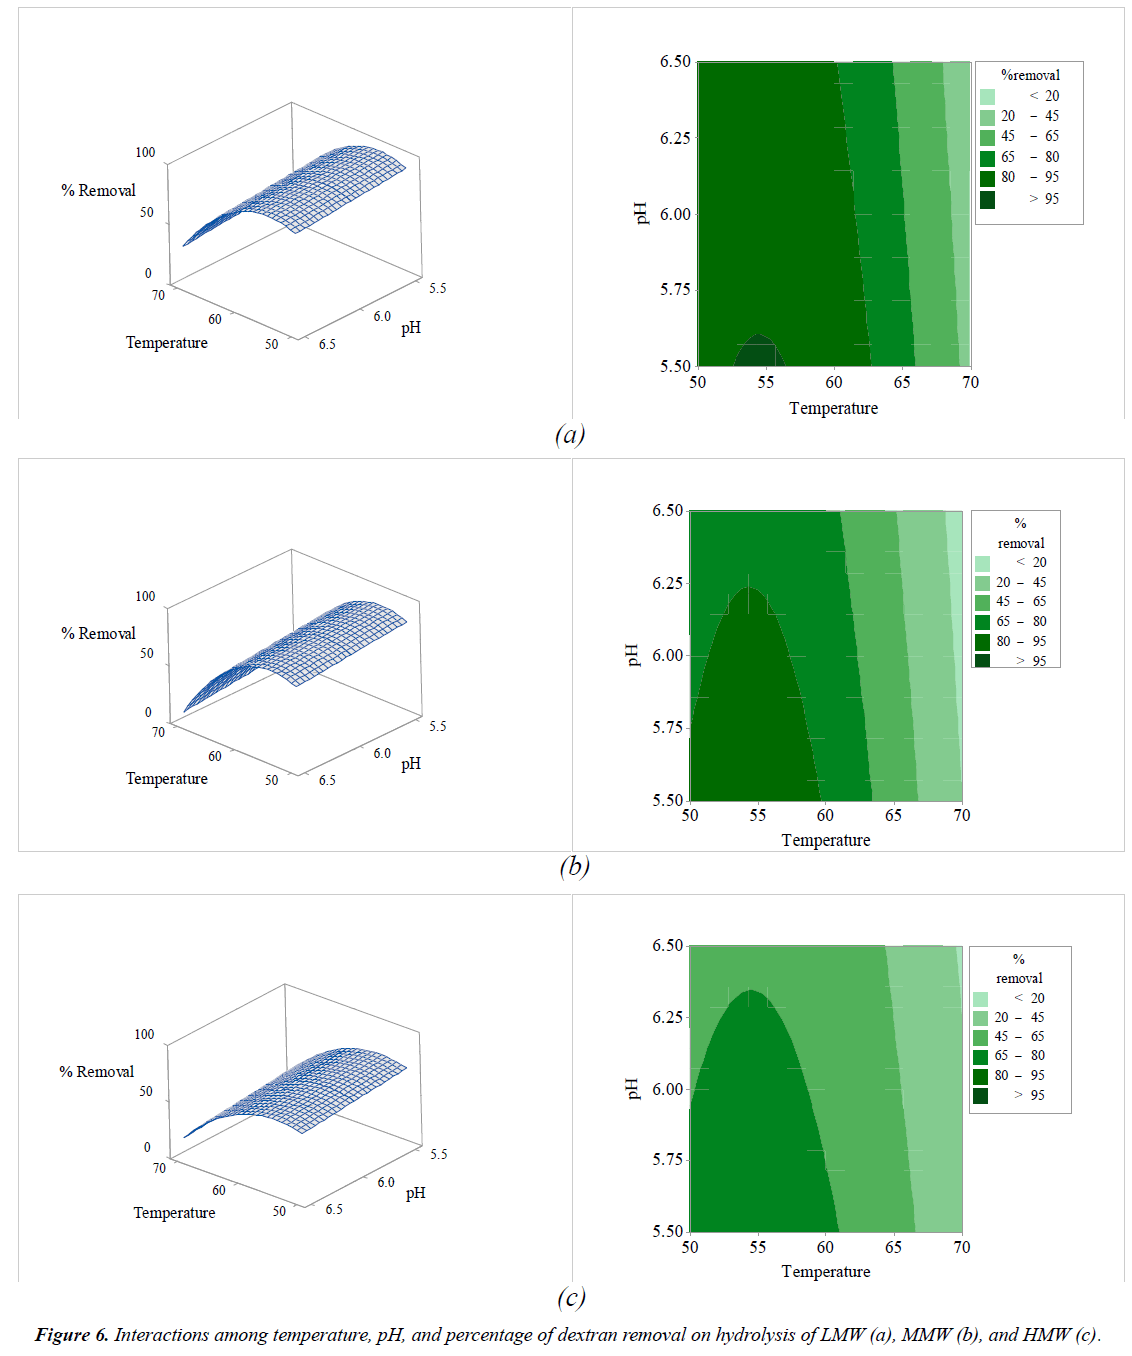
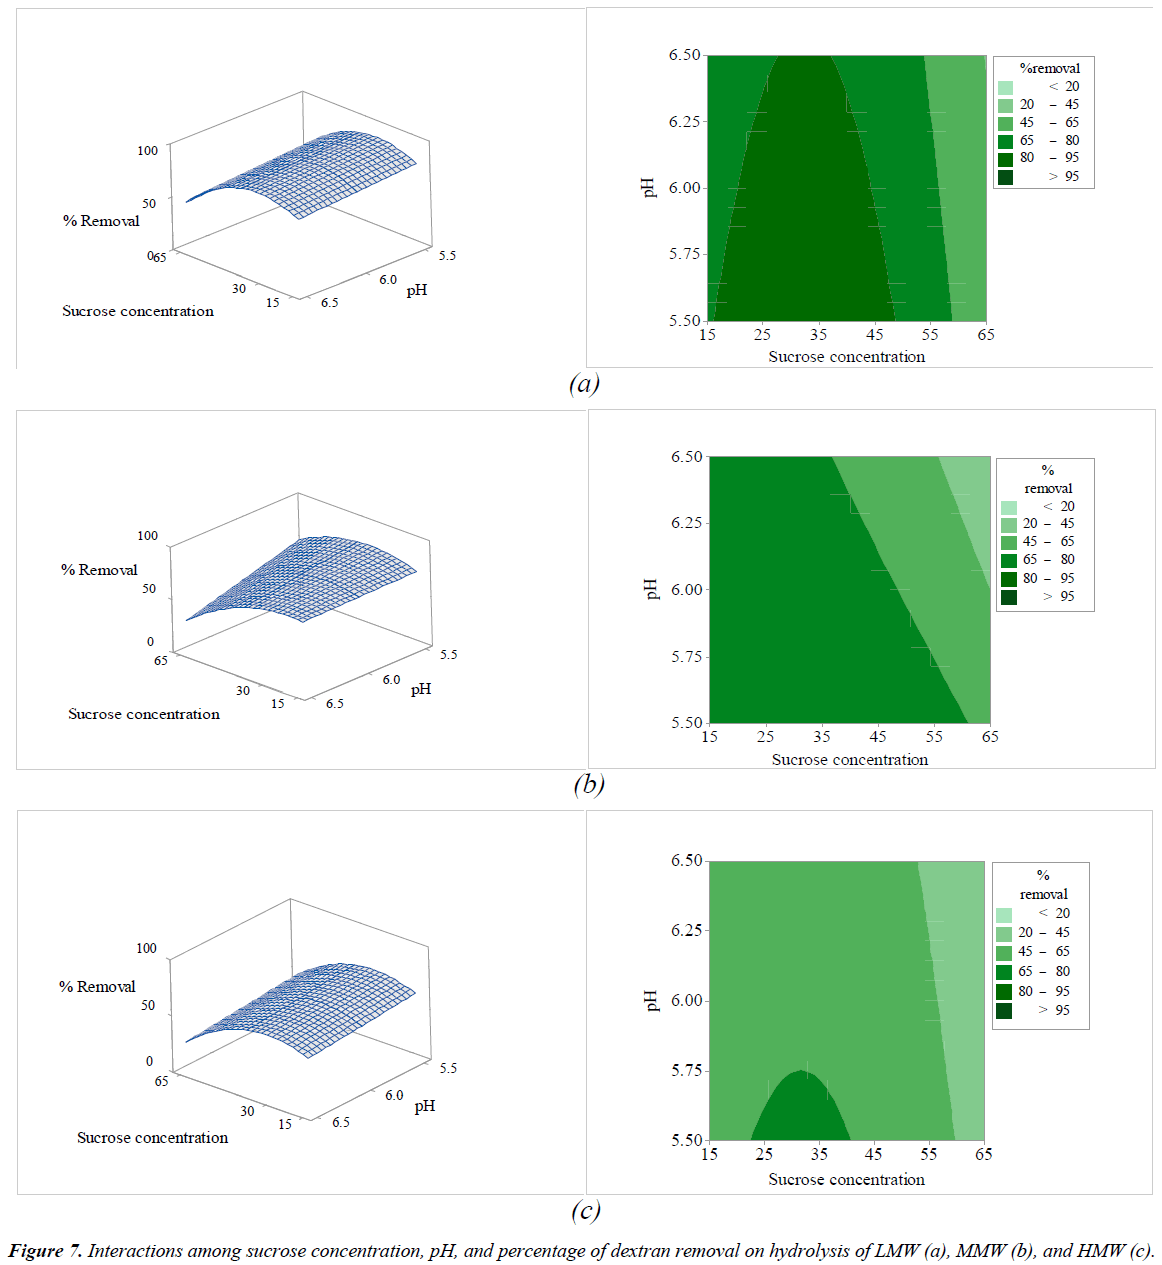
All independent variables that affected the hydrolysis of pure dextran were considered according to their p-value. The linear terms of variables (X1, X2, and X3) and the quadratic terms (X1 2, X2 2, and X3 2) of LMW, MMW, and HMW were significant at the 95% confidence level (p-value<0.05), while X4 (pH) was not significant (p-value>0.05). Almost all of the interactive terms (X1X2, X1X3, X1X4, X2X4, and X3X4) were not significant (p-value>0.05) on dextranase hydrolysis for all molecular weights of pure dextran (Table 3), except for X2X3 (interaction of temperature and sucrose concentration on dextran removal) that did affect dextran hydrolysis.
Response surface and contour plot of variables on dextran hydrolysis of various molecular weight of pure dextran
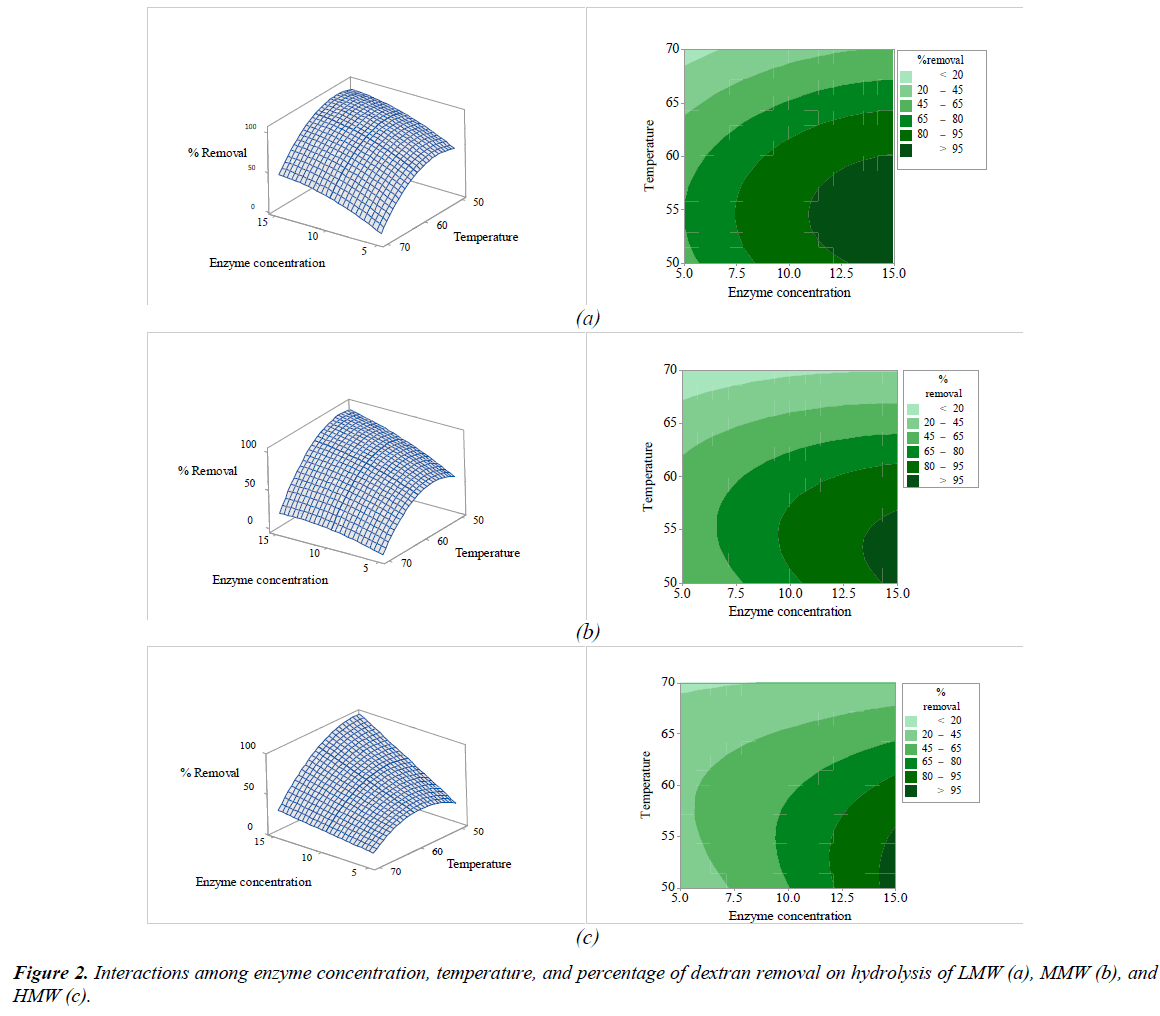
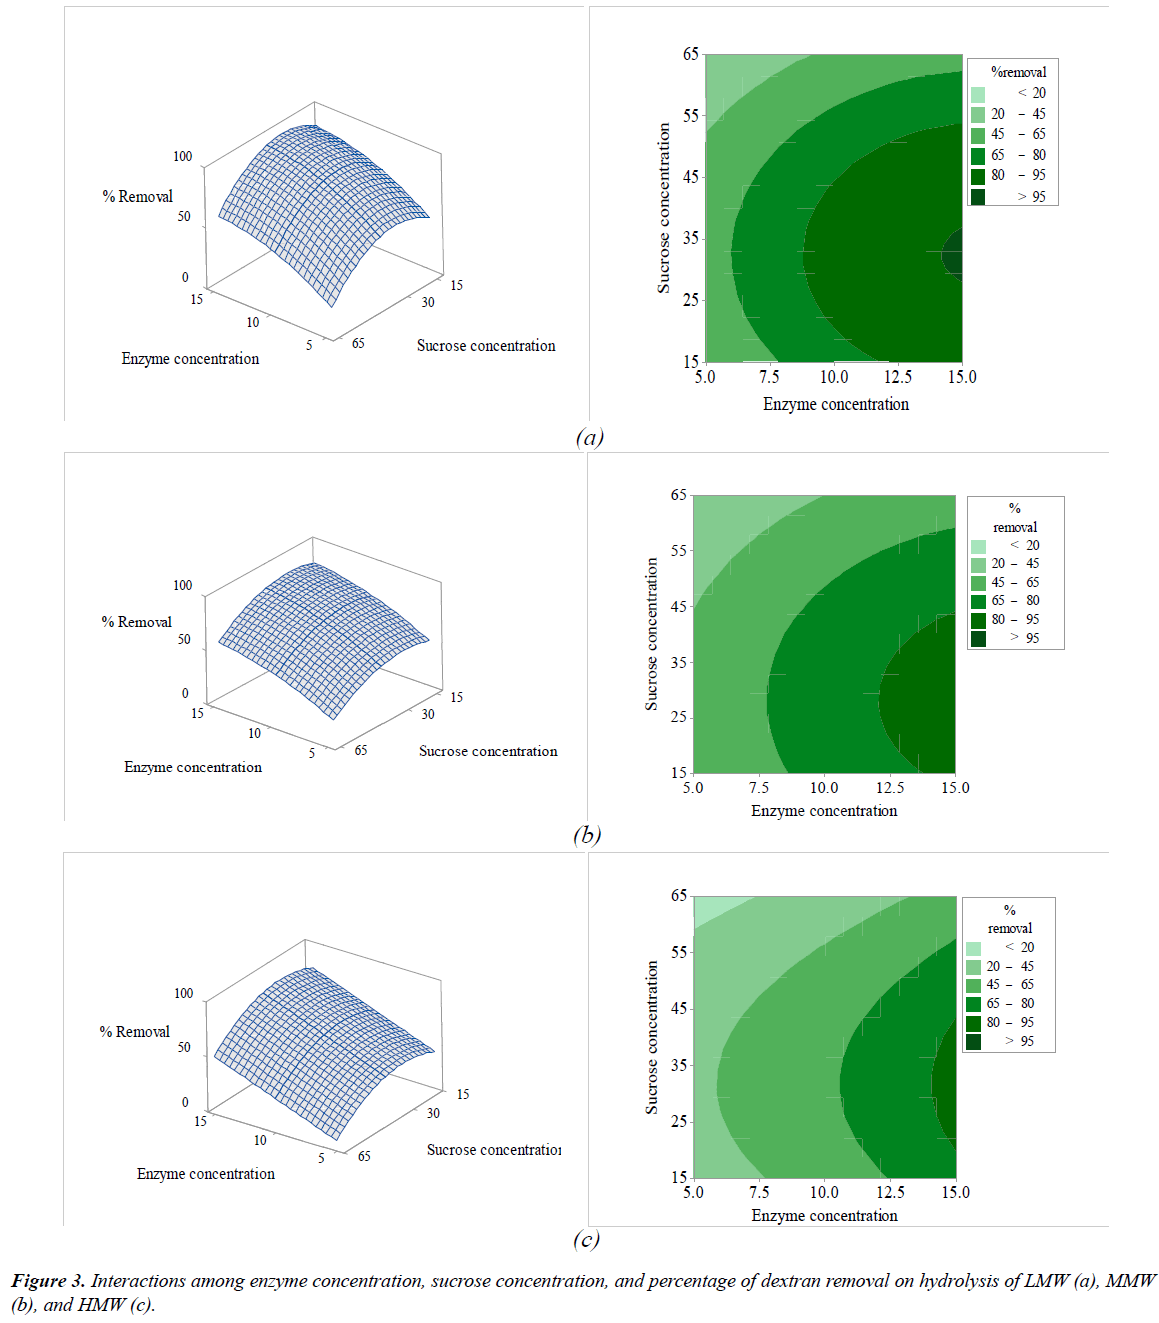
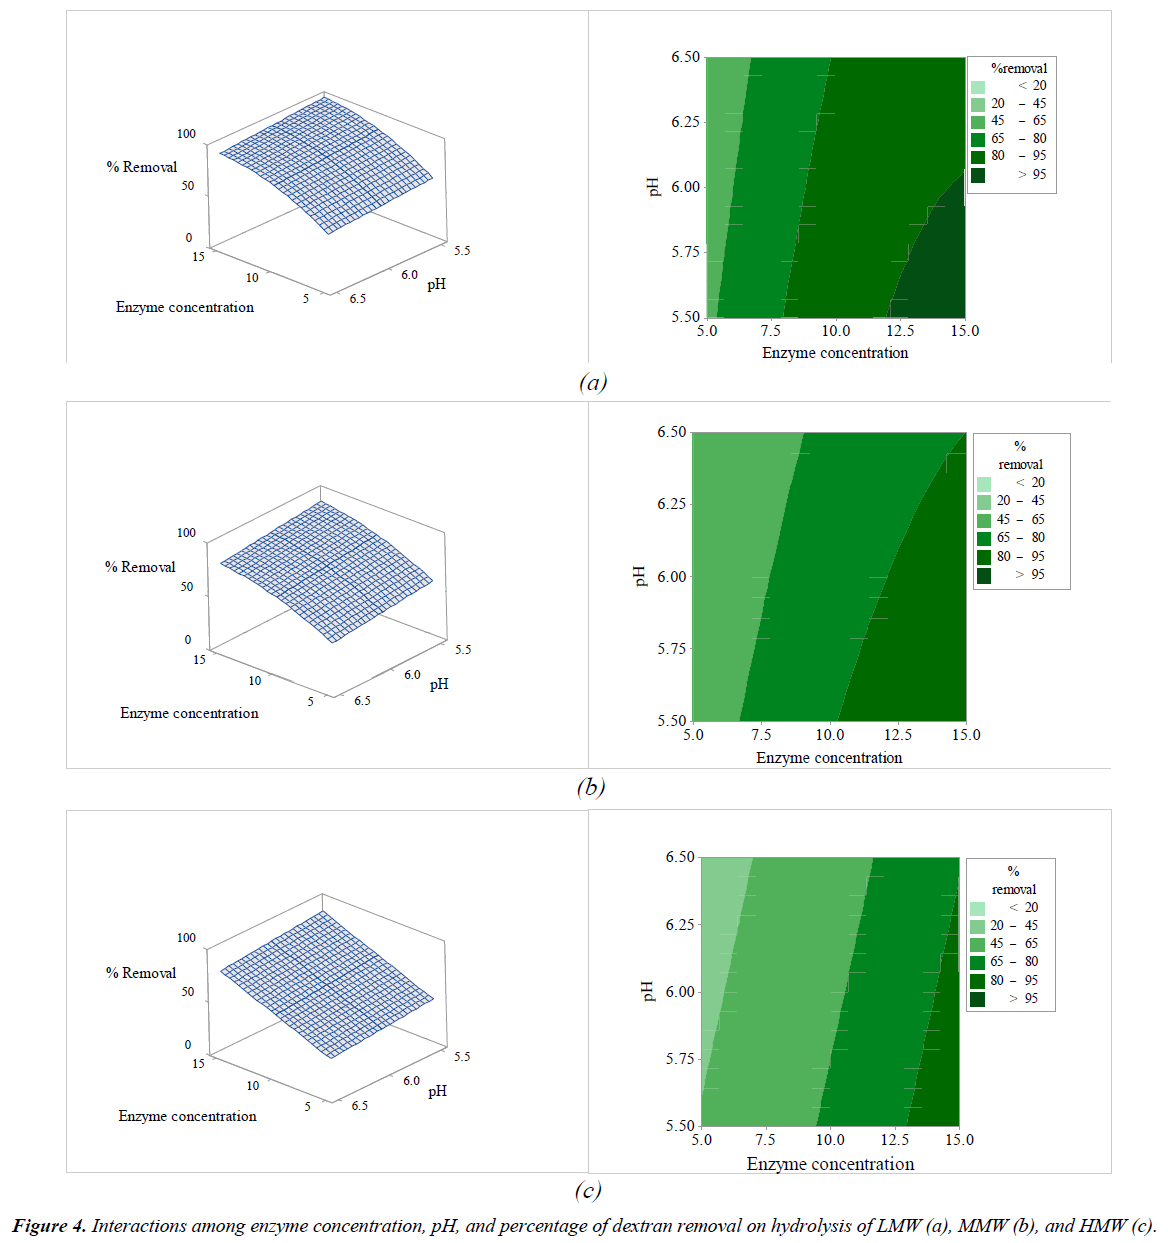
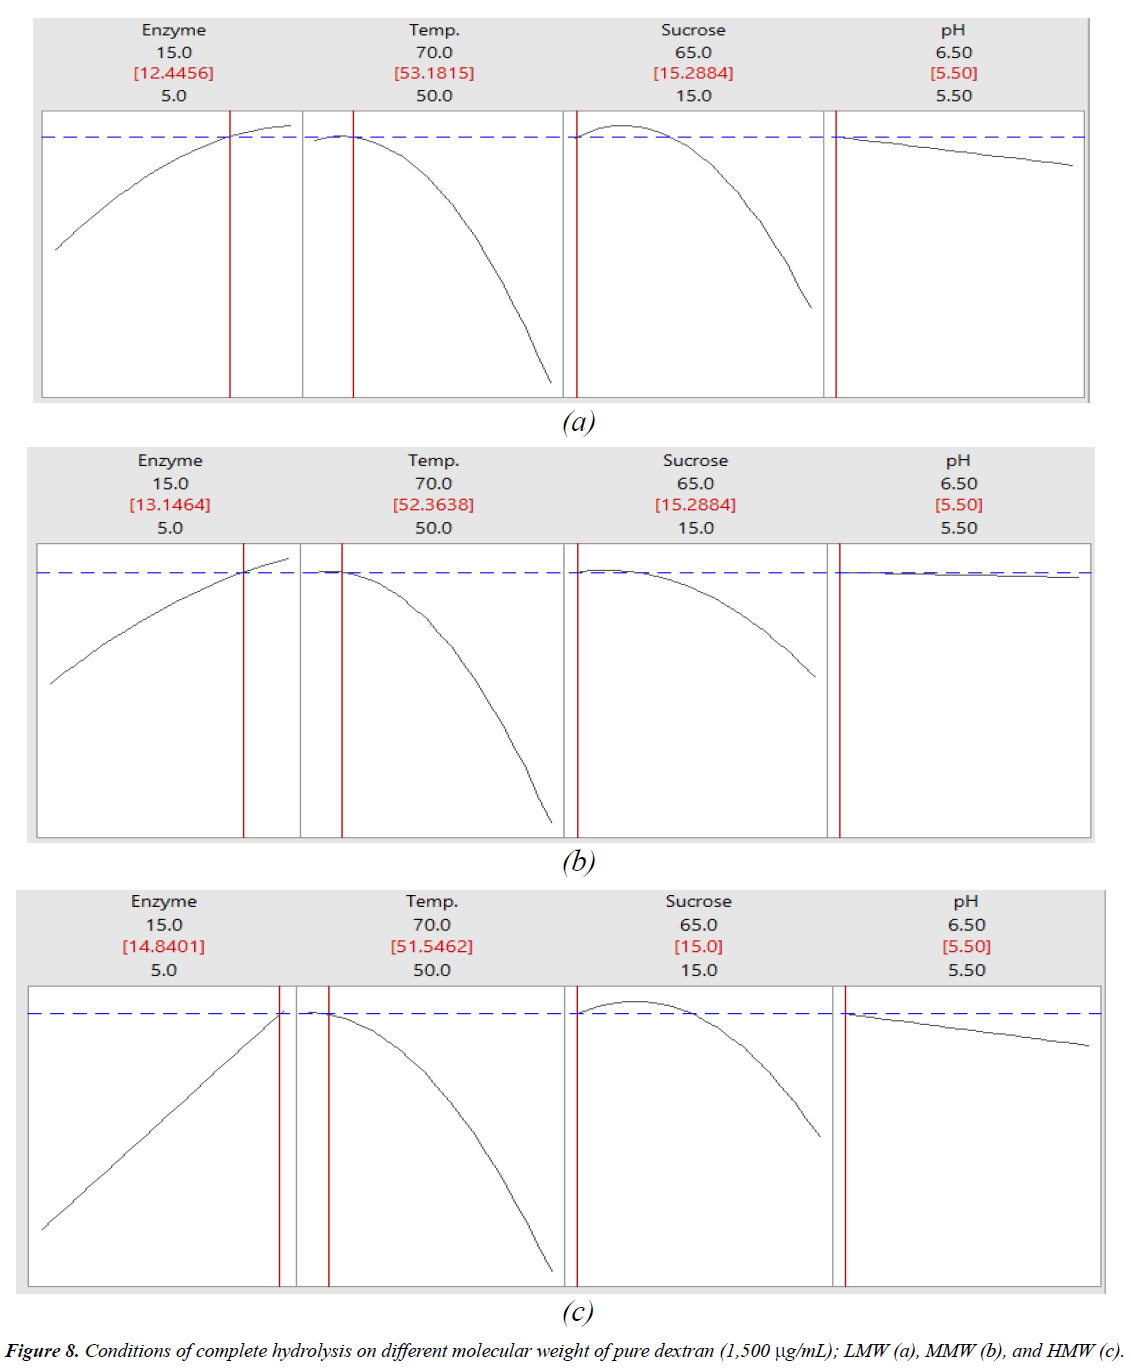
The interactions among the variables (enzyme concentration, temperature, sucrose concentration, and pH) and dextran removal on hydrolysis of various molecular weights of pure dextran were represented using response surface and contour plots by considering two variables while the other variables were fixed at a level of 0 as shown in Figures 2-7. The shapes of the response surfaces for all the molecular weights of pure dextran (LMW, MMW, and HMW) were quite similar, while in the contour plots, LMW showed a larger area of high percentage dextran removal than MMW and HMW that implied a wide range of conditions could hydrolyze the lower molecular weight. The correlation of enzyme concentration and temperature on dextran removal as shown in Figure 2, the range of quite high enzyme concentration (>10 ppm total soluble solids) and low temperature (<60C) achieved the high percentage of dextran removal. As the similar results of response surface and contour plots as shown in Figure 3, high enzyme concentration and low concentration of sucrose resulted to the high dextran removal. According to the results from Table 3, both of temperature and sucrose concentration were significant on dextran removal, then the range of low temperature and low sucrose concentration also achieved the high percentage of dextran removal as shown in Figure 5. On the other hand, the effect of pH (5.5- 6.5) on dextran hydrolysis was not significant (Table 3), so that the result of dextran removal as shown in Figure 4 directly correlated with enzyme concentration but inversely correlated with temperature and sucrose concentration as shown in Figures 6 and 7, respectively. Consequently, the range of high enzyme concentration but low conditions of temperature and sucrose concentration that are shown in Figures 4, 6, and 7, respectively achieved the high percentage of dextran removal. Figure 8 shows the conditions that were calculated using equations (1), (2), and (3) to achieve 100% dextran removal or complete hydrolysis with 1,500 μg/mL of each molecular weight of pure dextran. These optimal conditions were: pH 5.5, sucrose concentration 15-15.2%, dextranase concentration at 12.4, 13.1, and 14.8 ppm total soluble solids and temperature at 53.2, 52.4, and 51.5°C for LMW, MMW, and HMW, respectively.
Conclusions
All of the factors (enzyme concentration, retention time, pH, temperature, and sucrose concentration) affected enzyme hydrolysis, especially the dextranase concentration, temperature, and sucrose concentration which were significant factors for dextran hydrolysis all of molecular weights of pure dextran. The optimum hydrolysis conditions with 1,500 μg/mL for all pure dextran samples from the OFAT experiments were: 5-15 ppm total soluble solids of dextranase, 5-15 min at 50-65°C, pH 4.5-6.5 and less than 30% sucrose concentration. Dextranase could degrade the high molecular weight of dextran into smaller molecules; as a result, the low molecular weight of pure dextran (LMW) with its less complex structure or smaller molecules was easily degraded and therefore, had a higher percentage of dextran removal and a wider range of factors for dextran hydrolysis than did the higher molecules of MMW and HMW under the same conditions. The complete hydrolysis conditions that were calculated from the predicted models for all molecular weights of pure dextran were: pH 5.5 and sucrose concentration 15-15.2% with slightly different temperatures of 53.2, 52.4, and 51.5°C and dextranase concentration of 12.4, 13.1, and 14.8 ppm total soluble solids for LMW, MMW, and HMW, respectively. The fit models could predict dextran removal under the different conditions of various molecular weights of pure dextran. In practice, the elimination of dextran contamination in sugar processing is quite complicated due to contamination with various molecular weights of dextran in the processing stream.
Acknowledgements
The authors wish to thank the Thailand Research Fund (TRF)- Researchers and Research Funds for Industries (RRi) and Mitr Phol Sugar Corporation Ltd for financial support for a Ph.D. scholarship (PHD57I0048).
References
- Abdel-Rahman EA, Smejkal Q, Schick R, et al. Influence of dextran concentrations and molecular fractions on the rate of sucrose crystallization in pure sucrose solutions. J Food Eng. 2008;84:501-8.
- Eggleston G, Monge A, Montes B, et al. Factory trial to optimize the industrial application of dextranase in raw sugar manufacture: Part II. Int Sugar J. 2007;109(1308):757-64.
- Bashari M, Lagnika C, Ocen D, et al. Separation and characterization of dextran extracted from deteriorated sugarcane. Int J BiolMacromol.2013;59:246-54.
- Bashari M, Tounkara F, Abdelhai MH, et al. Impact of Dextranase on Sugar Manufacturing and its Kinetic on the Molecular Weights of Remaining Dextran. Sugar Tech. 2013;15(1):84-93.
- Khalikova E, Susi P, Korpela T. Microbial dextran-hydrolyzing enzymes: Fundamentals and applications. MicrobiolMolBiol Rev.2005;69(2):306-24.
- Aquino FWB, Franco DW. Molecular mass distribution of dextran in Brazilian sugar and insoluble deposits of cachaca. Food Chemistry. 2009;114:1391-95.
- Vettori MHPB, Blanco KC, Cortezi M, et al. Dextran: effect of process parameters on production, purification and molecular weight and recent applications. DialogosCiencia. 2012;31:171-86.
- Goulas AK, Fisher DA, Grimble GK, et al. Synthesis of isomaltooligosaccharides and oligodextrans by the combined use of dextransucrase and dextranase. Enzyme Microb Technol.2004;35:327-38.
- Naessens M, Cerdobbel A, Soetaert W, et al.RewiewLeuconostocdextransucrase and dextran: production, properties and applications. J ChemTechnolBiotechnol.2005;80:845-60.
- Hoffman AS. Hydrogels for biomedical applications. Adv Drug Deliv Rev. 2002;43:3-12.
- Cuddihy JA, Porro ME, Rauh JS. The presence of total polysaccharides in sugar production and methods for reducing their negative effects. J American Soc Sugarcane Tech. 2001;21:73-91.
- Kaur S, Kaler RSS. Dextran and its effect on the flow behavior of molasses and crystallization rate. J Food Eng.2008;86:55-60.
- Ravno AB, Purchase BS. Dealing with dextran in the South Africa sugar industry. Proceedings of the South African Sugar Technologists Association. 2005;79:28-47.
- Eggleston G, Dilks A, Blowers M, et al. Successful application of dextranase in sugar beet factories. In: Proceedings of the American Society of Sugar BeetTechnologists Meeting, March 2-6, 2011. New Mexico:Albuquerque 2011. pp. 1-16.
- Fulcher RP, Inkman PA. The effect of cane dextran on the filterability of sugar. Proceedings Queensland Society Sugar Cane Technologists. 1978;pp. 111-8.
- Eggleston G, Legendre B, Tew T. Indicators of Freeze-damaged sugarcane varieties which can predict processing problems. Food Chemistry. 2004;87:119-33.
- Eggleston G, Monge A. Optimization of sugarcane factory application of commercial dextranses. Process Biochemistry. 2005;40:1881-94.
- Jimenez ER. Dextrananse in sugar industry: A review. Sugar Tech. 2009;11(2):124-34.
- Shamsolahrar M, Kheirolomoom A, FarshbafDadjour M. Kinetic studies of dextranase produced by mutant of Penicilliumlilacinum in batch culture. ScientiaIranica. 2002;9(1):39-46.
- Eggleston G, Monge A, Montes B, et al. Application of dextranases in sugar factory: Overcoming practical problems. Sugar Tech. 2009;11(2):135-41.
- International Commission for Uniform Methods of Sugar Analysis: ICUMSA.1994. Methods Book with First Supplement (1998). Publications Department, c/o British Sugar Technical Centre, Norwich Research Park, Colney, UK.
- Clarke MA, Bergeron J, Cole F. A rapid dextran screening test. Sugar y Azucar. 1987;82(3):23-4.
- Ninchan B, Saothong P, Sirisatesuwan C, et al. Comparison of methods for dextran analysis: Effect of sugar and dextran concentrations. IntSugar J. 2016;118(1408):260-7.
- Zhao ZG, He X, Yu SJ, et al. Optimizing conditions for dextranase application of sugarcane mixed juice using response surface methodology. Int Sugar J. 2014;116(1381):36-41.
- Inkerman PA. An appraisal of the use of dextranase. Proc Intern Soc Sugar Cane Technols. 1980;17:2411-27.
