Research Article - Journal of Agricultural Science and Botany (2021) Volume 5, Issue 7
In vitro studies of salinity stress response in allium sativum.
Aditi Singh*
Department of Biotechnology, Bioinformatics Institute, Uttar Pradesh, India
- *Corresponding Author:
- Dr. Aditi Singh
Department of Biotechnology, Bioinformatics Institute, Uttar Pradesh, India
E-mail: aditisingh.sept26@gmail.com
Accepted on 02 June, 2021
Citation: Singh A. In vitro studies of salinity stress response in allium sativum. J Agric Sci B ot. 2021;5(7):1-7.
Abstract
Salinity is a chief abiotic stress which affects the produce of crops worldwide. Plants of economic and medicinal importance are at a high risk of being affected by salinity stress. It impairs the growth and development and the production of secondary metabolites in the plants. In this study we aimed to study the effect of increasing salt concentrations (0 mM, 50 mM, 100 mM and 150 mM) on the growth of the plant and also examine the effect of varying salt concentrations on different biochemical compounds (protein, proline, flavonoids and IAA) found in the plants. Explants were grown in MS medium, in vitro. Numerous assays were performed on the sample to analyse the consequences of increasing salt concentrations on the protein, proline, flavonoid and IAA content in the plant sample. It was evident that increase in salinity levels decreased the growth of the plant. An increase in proline content was detected and the protein, flavonoids and IAA content decreased with an increase in the salinity levels.
Keywords
Salinity, Photosynthetic, Environmental fact, Flavonoids.
Introduction
Salinity affects around half of all the irrigated lands and one-fifth of total cultivated lands worldwide. It is one of the main abiotic factors which affect the global yield of crops [1].
Approximately 34.6 million hectares of land in China contain salt concentrations high enough to affect growth of plants. Plants with high medicinal value which plays a vital role in prevention and treatment of diseases are also at a risk of being affected by salinity stress. Accumulation of the secondary metabolites in the plants, which are of medicinal importance, is very highly dependent on the salinity levels of soil [2].
Since salt concentration in land plays such a significant function in the growth of plant, large areas of agricultural land become unsuitable for growth of plants. High salinity level creates a negative osmotic potential which makes obtaining water from soil difficult for plants. Also, the chloride and sodium ions are potentially toxic for plant species [3].
There exists an evolved mechanism in plants which permits them to identify the incoming stress and adjust their metabolism and physiology to cope with the stress [4].
Concentration of toxic ions and osmotic adjustments are some of the mechanisms plants employ in order to adapt to the salt stress. Several studies also show that oxidative stress is caused because of high salinity. Hence, to make the plant more resistant to salinity stress, mechanism involving antioxidant resistance could be helpful [5].
The most abundant salt responsible for inducing salt stress is sodium chloride [6]. Hindrances to growth and development, quality, necrosis, impaired metabolism are some of the effects of high salinity stress [7].
Imbalance of nutrients is also a result of salinity stress which is caused because nutrients associated with photosynthesis and synthesis of proteins. Photosynthetic pigments such as chlorophyll a and b can sometimes be degraded under extreme salinity conditions [8].
Studies to enhance the salinity tolerance of plants emphasize chiefly on the physiological and biochemical aspects [9].
Even though genes involved in salinity tolerance in few species have been discovered, stress usually involves a complicated mechanism of numerous environmental factors which causes changes in plant phenotypes as they react to the complicated conditions of growth [10].
Osmotic stress is known to induce oxidative damage. It reduces the osmoprotector’s biosynthesis. Stress response in plants depends on a varying number of factors such as evolution, developmental stages, growth, and degree of stress resistance.
Various macromolecules including Proline are produced when the plants are under salinity stress. Proline is a major compound which is synthesised in response to stress in the plants. It helps plant in protecting and preserving their osmotic stability [11].
Enzymatic reactions are not inhibited by proline and it aids the biochemical reactions when present in higher concentrations. Studies have shown that the in-vitro culture reproduces the greenhouse and field results making it the most appropriate system for salinity stress studies [12].
Allium sativum (Garlic) is a vital vegetable crop belonging to the Liliaceae family and Allium genus. Since ancient times, it has been used for culinary and medicinal purposes. Chinese onion, chive, leek. Onions are some of the close relatives of garlic. Garlic has known antioxidant, anti-fungal, anti-bacterial and anti-viral properties [13].
The objective of this work was to study the changes in different biochemical constituents (such as proteins, Proline, flavonoid and IAA) in garlic plant when subjected to varying concentrations of salt. The effect of different plant growth regulators under varying salt concentrations was also examined.
The plant extract was inoculated in medium under varying conditions of salt and plant growth regulators and several experiments were conducted on the specimen to evaluate the changes induced by salinity stress.
Methods and Materials
Allium sativum was purchased from the local nurseries in Pune, India. The bulbs were inoculated in Murashige and Skoog (MS) media and the leaves and shoot apex of three weeks old plant were used as explants (Tables 1-6).
Constituents |
Amount in mg/lit |
|---|---|
| MgSO4 7H2O | 7400 |
| KH2 PO4 | 3400 |
| KNO3 | 38000 |
| NH4 NO3 | 33000 |
| CaCl2 H2O | 8800 |
Table 1. Stock solution 1(20X): For macronutrients.
| Constituents | Amount in mg/lit |
|---|---|
| H3BO3 | 1240 |
| MnSO4. 4H2O | 4460 |
| ZnSO4 .7H2O | 1720 |
| Na 2 Mo. O4 2H2O | 50 |
| CuSO4.5H2O | 5 |
| CaCl2 .5H2O | 5 |
Table 2. Stock solution 2(200X): For micronutrients.
| Constituents | Amount in mg/lit |
|---|---|
| FeSO4.7 H2O | 5560 |
| Na2EDTA.2 H2O | 7460 |
Table 3. Stock solution3 (200X): Important ions.
Constituents |
Amount in mg/lit |
|---|---|
| Inositol | 20000 |
| Thymine HCl | 1000 |
| Pyridoxine HCl | 100 |
| Nicotinic acid | 100 |
| Glycine | 400 |
Table 4. Stock solution4 (200X): Organic nutrients.
| Constituents | Amount in mg/ml |
|---|---|
| IBA | 1 |
| NAA | 1 |
| 2-4,D | 1 |
| Kinetin | 1 |
Table 5. Stock of hormones.
| Plant growth regulator | Solvents |
|---|---|
| IAA | Ethanol/1N NaOH |
| IBA | Ethanol/1N NaOH |
| NAA | 1N NaOH |
| BAP | 1N NaOH |
| Kinetin | 1N NaOH |
| 2,4-D | D/W |
| Gibberellic Acid(GA3) | Ethanol |
Table 6. Plant growth regulators and their solvents.
Medium preparation
Stock solutions for the medium were prepared according to the following tables:
Plant growth regulators (10 mg) were dissolved in 1ml of their respective solvents (Table 6) the final volume was made to 10 ml by addition of distilled water. The stocks of hormones were refrigerated at 4° C.
MS Medium (1 L) was prepared by addition of Stock solution I (50 ml), Stock solution II (5 ml), Stock solution III (5 ml) and Stock solution IV (5 ml).
Sucrose (3%/30 gm) was added along with agar (1%) and volume was made 1 L by addition of distilled water. The combination of varying concentrations of NaCl and plant growth regulators are summarised in (Table 7). pH of the medium was adjusted to 5.5-5.8 before autoclaving. Autoclaving was carried at 121º C and 15 lbs pressure for 20 mins. Filter sterilized Benzyl Aminopurine (BAP) (5.6 ml) was then added to the medium. Eight explants for each concentration was prepared.
Media |
2,4-D | NAA | KINETI N | BAP | NaCl | Sources | AGAR |
|---|---|---|---|---|---|---|---|
| MS | 2 mg/l | - | - | 2.8mg/l | 0 mM | 0.03 | 0.01 |
| MS | 2 mg/l | - | - | 2.8mg/l | 50 mM | 0.03 | 0.012 |
| MS | 2 mg/l | - | - | 2.8mg/l | 100 mM | 0.03 | 0.012 |
| MS | 2 mg/l | - | - | 2.8mg/l | 150 mM | 0.03 | 0.012 |
| MS | - | 2 mg/l | - | 2.8mg/l | 0 mM | 0.03 | 0.01 |
| MS | - | 2 mg/l | - | 2.8mg/l | 50 mM | 0.03 | 0.012 |
| MS | - | 2 mg/l | - | 2.8mg/l | 100 mM | 0.03 | 0.012 |
| MS | - | 2 mg/l | - | 2.8mg/l | 150 mM | 0.03 | 0.012 |
| MS | 2 mg/l | - | 0.2 mg/l | - | 0 mM | 0.03 | 0.012 |
| MS | 2 mg/l | - | 0.2 mg/l | - | 50 mM | 0.03 | 0.012 |
| MS | 2 mg/l | - | 0.2 mg/l | - | 100 mM | 0.03 | 0.012 |
| MS | 2 mg/l | - | 0.2 mg/l | - | 150 mM | 0.03 | 0.012 |
| MS | - | 2 mg/l | 0.2 mg/l | - | 0 mM | 0.03 | 0.012 |
| MS | - | 2 mg/l | 0.2 mg/l | - | 50 mM | 0.03 | 0.01 |
| MS | - | 2 mg/l | 0.2 mg/l | - | 100 mM | 0.03 | 0.012 |
| MS | - | 2 mg/l | 0.2 mg/l | - | 150 mM | 0.03 | 0.012 |
| MS | - | - | - | 2.8 mg/l | 0 mM | 0.03 | 0.012 |
| MS | - | - | - | 2.8 mg/l | 50 mM | 0.03 | 0.012 |
| MS | - | - | - | 2.8 mg/l | 100 mM | 0.03 | 0.012 |
| MS | - | - | - | 2.8 mg/l | 150 mM | 0.03 | 0.012 |
Table 7. MS media with phytohormones for In vitro studies of Allium sativum.
Analysis of various biochemical constituents of garlic
Proline content: The measurement of total Proline content. Weighted plant material was homogenised in sulfosalicylic acid (3%, 10 ml) and was filtered through Whatman filter paper. The filtrate (2 ml) was mixed with acid- ninhydrin (2 ml) and glacial acetic acid (2 ml) in a test tube for an hour at 100° C. The reaction was terminated in an ice-bath. Toluene (4 ml) was added and was mixed vigorously for 15-20 sec. The chromophore containing toluene was aspirated from aqueous phase, warmed to room temperature and absorbance was read at 520 nm using toluene as the blank.
Protein content: It was used to determine the total protein content. Weighted plant material was boiled in ethanol (80%, 5 mins) to stop the enzymatic reaction and homogenised in ethanol (80%) and centrifuged. The residue was suspended in distilled water (1 ml) and perchloric acid (15%) for 2 mins followed by centrifugation. The residue was them suspended in trichloroacetic acid (10%, 10 mins) and dissolved in 1N NaOH (5ml) after centrifugation. It was then incubated at room temperature (30 mins) and centrifuged to make the definite volume (2 ml) with 0.5N NaOH. Reagent C (0.5 ml) was added. [Reagent A (2% sodium carbonate and 0.2% potassium sodium tartarate in 0.1N sodium hydroxide) was prepared. Reagent B (0.5% copper sulphate) was also prepared. Reagent C was prepared by addition of Reagent A and in the ration of 50:1]. The constituents were mixed thoroughly and incubated at room temperature (30 mins) for the colour to develop. Absorbance was read at 660 nm. Bovine serum albumin (100 mg/100 ml in 0.5 NaOH) was used to set blank and protein content was measured.
Flavonoid content: Quantitative determination of flavonoids was done by method outlined by Lees and Francis. The frozen tissue was macerated with 10 ml of extracting solvent [95% ethanol: 1.5 NHCl (85:15)]. The extract was incubated overnight in a freezer. Sample was then filtered and made to a definite volume and incubated (2 hrs) in dark at room temperature. Absorbance for total anthocyanin content was measured at 535 nm using distilled water as blank. Total flavonoid content was measured at 374 nm.
Indole 3-Acetic Acid (IAA) oxidase content: Enzymatic activity was assayed by estimative residual IAA using Malik and Singh method. Weighted material was homogenised in ice cold distilled water and centrifuged (8000 rpm, 20 mins). The supernatant was collected and used as enzyme sample. Reaction mixture was prepared by mixing 1 ml IAA solution (10 mg in 100 ml of 0.5 mM MnCL2), 0.25 ml 2,4D and 3.5 ml of phosphate buffer (0.05 M, pH-6.5). The tubes were incubated in dark (1 hr at 30° C). Reaction mixture (2 ml) was added to Salkowski reagent (2 ml). Salkowski Reagent - 0.5 M ferric chloride + 35% perchloric acid (1:50). Tubes were incubated for half an hour and absorbance was measured at 530 nm.
Results
Growth of garlic reduced with increase in NaCl concentration
Various plant growth regulators along with varying concentration of NaCl (0 mM, 50 mM, 100 mM and 150 mM) were mixed with MS medium and bulbs of garlic were inoculated in them. The growth of garlic was monitored and the average growth in different conditions after 21 days are summarised in table 8. Entire length of the plant (roots and shoot) was measured. Various plant growth regulators affected the growth differently. Nonetheless, it was seen that for all the cases, with an increase in salt concentration, the growth of garlic decreased. It could also be concluded that the concentration of 150 mM was limiting as growth was not seen in most of the plants. It was also evident that the plant growth regulator BAP had the largest impact on the growth, facilitating the maximum growth in each salt concentration condition.
| Medium | 2,4-D | NAA | KINETIN | BAP | NaCl | Average Groth |
|---|---|---|---|---|---|---|
| MS | 2 mg/l | - | - | 2.8 mg/l | 0 mM | 104 |
| MS | 2 mg/l | - | - | 2.8 mg/l | 50 mM | 52 |
| MS | 2 mg/l | - | - | 2.8 mg/l | 100 mM | 47 |
| MS | 2 mg/l | - | - | 2.8 mg/l | 150 mM | 2 |
| MS | - | 2 mg/l | - | 2.8 mg/l | 0 mM | 98 |
| MS | - | 2 mg/l | - | 2.8 mg/l | 50 mM | 63 |
| MS | - | 2 mg/l | - | 2.8 mg/l | 100 mM | 48 |
| MS | - | 2 mg/l | - | 2.8 mg/l | 150 mM | 3 |
| MS | 2 mg/l | - | 0.2 mg/l | - | 0 mM | 81 |
| MS | 2 mg/l | - | 0.2 mg/l | - | 50 mM | 46 |
Medium |
2,4-D | NAA | KINETIN | BAP | NaCl | Average Groth |
| MS | 2 mg/l | - | - | 2.8 mg/l | 0 mM | 104 |
| MS | 2 mg/l | - | - | 2.8 mg/l | 50 mM | 52 |
| MS | 2 mg/l | - | - | 2.8 mg/l | 100 mM | 47 |
| MS | 2 mg/l | - | - | 2.8 mg/l | 150 mM | 2 |
| MS | - | 2 mg/l | - | 2.8 mg/l | 0 mM | 98 |
| MS | - | 2 mg/l | - | 2.8 mg/l | 50 mM | 63 |
| MS | - | 2 mg/l | - | 2.8 mg/l | 100 mM | 48 |
| MS | - | 2 mg/l | - | 2.8 mg/l | 150 mM | 3 |
| MS | 2 mg/l | - | 0.2 mg/l | - | 0 mM | 81 |
| MS | 2 mg/l | - | 0.2 mg/l | - | 50 mM | 46 |
| MS | 2 mg/l | - | 0.2 mg/l | - | 100 mM | 8 |
| MS | 2 mg/l | - | 0.2 mg/l | - | 150 mM | 4 |
| MS | - | 2 mg/l | 0.2 mg/l | - | 0 mM | 102 |
| MS | - | 2 mg/l | 0.2 mg/l | - | 50 mM | 57 |
| MS | - | 2 mg/l | 0.2 mg/l | - | 100 mM | 3 |
| MS | - | 2 mg/l | 0.2 mg/l | - | 150 mM | 4 |
| MS | - | - | - | 2.8 mg/l | 0 mM | 121 |
| MS | - | - | - | 2.8 mg/l | 50 mM | 109 |
| MS | - | - | - | 2.8 mg/l | 100 mM | 65 |
| MS | - | - | - | 2.8 mg/l | 150 mM | 38 |
Table 8. Concentrations of plant growth regulators and NaCl used for growth of garlic and the average growth of garlic after 21 days.
Decrease in total protein content of the plant with increase in salt concentration
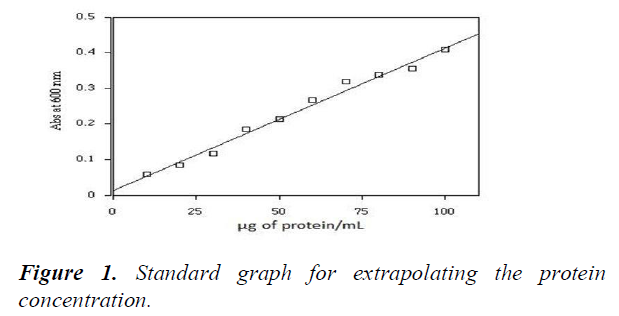
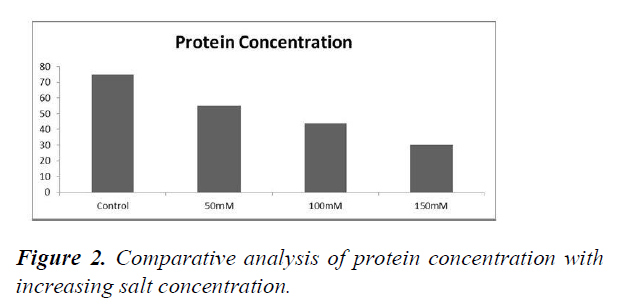
Standard graph was prepared for absorbance (600 nm) against the concentration of protein (in μg/ml) (Figure 1). Protein concentration in different salt concentration was extrapolated from the standard graph (Table 9). It was found that the concentration of total proteins in the plant decreased as the salt concentration increased (Figure 2).
| Salt concentration | Optical density | Concentration of protein |
|---|---|---|
| 0 mM | 0.32 | 75 |
| 50 mM | 0.23 | 55 |
| 100 mM | 0.19 | 44 |
| 150 mM | 0.14 | 30 |
Table 9. O.D. and concentration of proteins with varying salt concentrations.
X-axis represents the protein concentration (in μg/ml) and y-axis represents the absorbance measured at 600 nm. Concentration of standard protein BSA was measured and plotted. A straight fit line was drawn from which the concentration of unknown protein samples was extrapolated.
The concentration of protein was found to decrease with increase in salt concentration. The x-axis represents the salt concentration and y-axis is representative of protein concentration (Figure 3).
Increase in the Proline concentration with an increase in the salt concentration
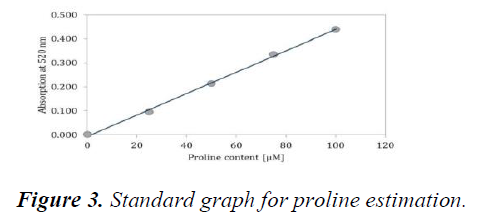
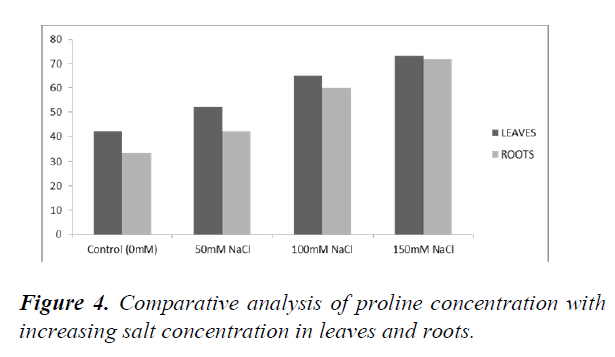
The standard graph was plotted using various concentrations of Proline (25 μM, 50 μM, 75 μM and 100 μM) (Figure 4). Proline content for leaf and root samples were determined by plotting the measured OD and extrapolating the values from the standard graph (Table 10 and Table 11). The Proline concentration increases with an increase in salt concentrations. Both the roots and leaves showed increased accumulation of Proline as the salt concentration increased (Figure 5).
Leaf sample |
|||
|---|---|---|---|
| Salt concentration | Optical density | Proline Conc (μM/g) from graph |
Proline Conc in μg/ml |
| Control (0 mM) | 0.04 | 14.5 | 42 |
| 50 Mm NaCl | 0.08 | 18 | 52 |
| 100 mM NaCl | 0.11 | 22.5 | 65 |
| 150 mM NaCl | 0.13 | 25.28 | 73 |
| Root sample | |||
| Control (0 mM) | 0.03 | 11.42 | 33 |
| 50 Mm NaCl | 0.04 | 14.5 | 42 |
| 100 mM NaCl | 0.09 | 20.77 | 60 |
| 150 mM NaCl | 0.12 | 24.93 | 72 |
Table 10. Measurement of O.D. and proline concentration in different salt concentrations in the leaf and root sample.
| SAMPLE | ||
|---|---|---|
| Sample | OD | Concentration of IAA (μM/g) |
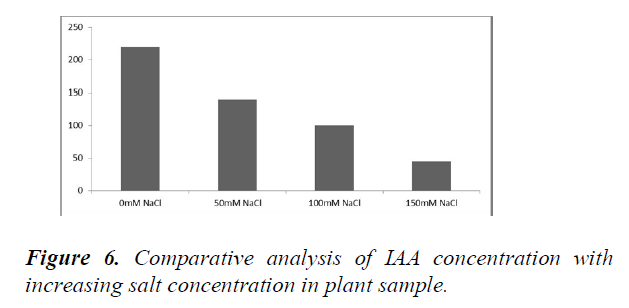
| CONTROL (0 mM) | 0.13 | 220 |
| 50 mM NaCl | 0.08 | 140 |
| 100 mM NaCl | 0.06 | 100 |
| 150 mM NaCl | 0.03 | 45 |
Table 11. Measurement of O.D. and IAA concentration at different salt concentrations in the plant.
X-axis represents the increasing concentrations of Proline whereas Y-axis represents the absorbance measured at 520 nm. A straight fit line was plotted which was then used to extrapolate the concentrations of Proline in leaf and root sample.
X-axis represents the increasing salt concentration and Y-axis represents the proline concentration in μg/ml. The blue bars are indicative of leaf samples and orange are for the roots sample.
Decrease in IAA content with increasing salinity stress
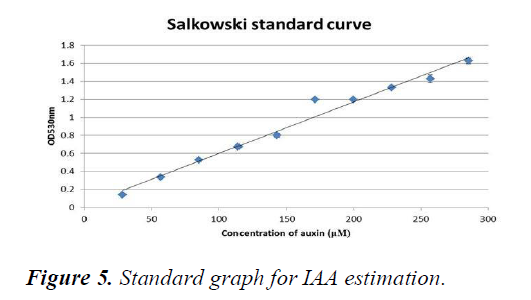
A standard graph for measuring the IAA content was plotted using different concentrations of auxins (Figure 6). The O.D. of the samples were then measured and concentrations were extrapolated from the graph (Table 11). The obtained concentrations were then converted into a graph and it was seen that the concentrations of IAA rapidly decreased as the concentration of salt increased (Figure 7).
X-axis represents the increasing concentrations of auxins in μM whereas Y-axis represents the absorbance measured at 530 nm. A straight fit line was plotted which was then used to extrapolate the concentrations of IAA in the plant sample.
X-axis represents the increasing salt concentration and Y-axis represents the IAA concentration in μM/g.
Changes in the flavonoid content with an increase in the salt concentration
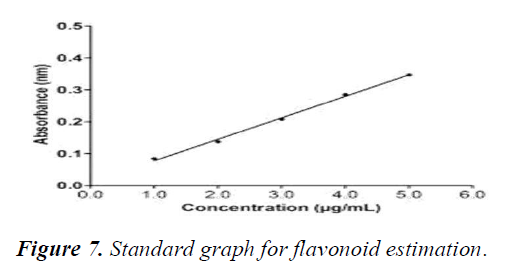
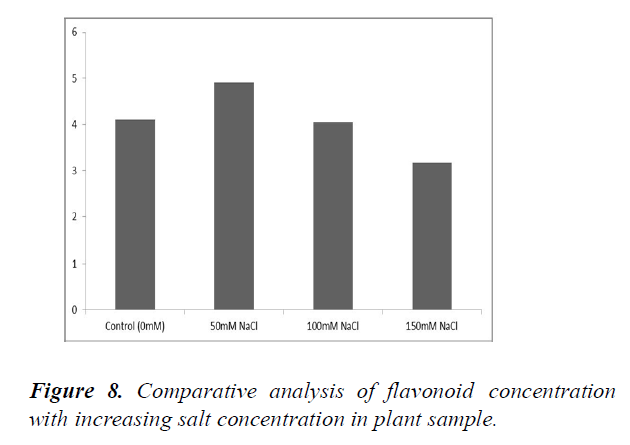
The standard graph was plotted using various concentrations of flavonoid (1-5 μM) (Figure 7). Flavonoid content for the plant samples were determined by plotting the measured OD and extrapolating the values from the standard graph (Table 12). The flavonoid concentration initially increases with an increase in salt concentrations (at 50 mM). The flavonoid concentration decreases with further increase in salt concentrations (at 100 and 150 mM) (Figure 8 and Table 12).
| Sample | OD | Concentration from Graph |
Concentration by Formula |
|---|---|---|---|
| 0 mM | 0.31 | 4.1 | 4.08 |
| 50 mM | 0.37 | 4.917 | 4.9 |
| 100 mM | 0.309 | 4.05 | 4.03 |
| 150 mM | 0.242 | 3.165 | 3.02 |
Table 12. Measurement of O.D. and flavonoid concentration (from graph and by formula) at different salt concentrations in the plant sample.
X-axis represents the increasing concentrations of flavonoids in μg/ml whereas Y-axis represents the absorbance measured at 374 nm. A straight fit line was plotted which was then used to extrapolate the concentrations of flavonoids in the plant sample.
Discussion
The study revealed that salinity stress causes decrease in growth of the plant. Growth seemed to be negligible at higher salt concentrations (150 mM). BAP, a plant growth regulator, when present along with the medium resulted in maximum growth in all conditions of salt concentrations. This indicates that out of all the other plant growth regulators used, BAP was the most efficient.
The increasing salt concentration caused a decline in protein content in the plant sample. Salinity stress causes elimination of potassium ions by the roots. Potassium is a vital ion responsible for synthesis of protein and its elimination triggers a physiological imbalance [14]. Loss of potassium also hinders growth and development of plants. Hence the decreased growth of plants as seen in this experiment could be possibly because of loss of potassium ions. Protein synthesis could eventually be affected and decline if the stress is prolonged [15].
In our study, it was found that with increasing salinity stress, the concentration of Prolines increased. This might be attributed to the fact that Prolines functions as compatible osmoprotectants in many plant species. As a result of increasing salinity stress, accumulation of Proline in high concentrations have been seen [16]. Also, choice of salinity stress tolerant genotypes is co-related with the capacity to accrue proline [17]. Glutamate is the main precursor for production of proline in plant cells. Proline carboxylic acid reductase and synthetase are two main enzymes involved in synthesis of glutamate. When subjected to high salinity level, the transcripts for synthesis of the two enzymes accumulate in the DNA which results in increase in concentration of proline under salinity stress [18].
The flavonoid content was seen to initially increase at 50 mM concentration but decreased at higher salt concentrations (100 mM and 150 mM) [19]. This result was in accordance with another study which showed the same fluctuations in flavonoid content. Reactive Oxygen Species (ROS) are generated under salinity stress which causes oxidative damages. These ROS target the carbohydrates, DNA, proteins and lipids. ROS constitutes of a free radical and non-radical form [20]. Under salinity stress conditions, biosynthesis of flavonoids takes place to detoxify ROS. However, under extreme salinity stress conditions, detoxification of ROS becomes unfeasible because of the imbalance between the levels of ROS and anti-oxidants. The decrease in the concentration of flavonoids at higher salinity stress could be attributed to this fact. IAA content in the plant sample decreased as a result of increasing salinity stress. The free radicals generated by ROS catalyses the oxidation of IAA by porphyrin (a prosthetic group). Increase in salinity leads to increase in production of free radical which in turn increasingly oxidises the IAA present in the cell resulting in a marked decrease. Furthermore, it was also suggested that depletion of IAA is seen in cells of the plant where IAA serve as a signal to their neighbouring cells of the stress. This allows those cells to shift their mechanisms from a normal function to self-protective and healing functions [21].
Conclusion
This study showed that plant growth was markedly reduced when exposed to increasing salt concentrations. It also showed that the concentration of Proline increases in response to salinity stress which prepares the plant to cope with the stress. Flavonoids can function to protect the plant from salinity stress when subjected to low levels of salt concentrations. The other compounds such as protein and IAA are decreased as the normal functions are hindered by increase in salinity levels.
References
- Zhu JK. Plant salt tolerance. Trends Plant Sci. 2001;6:66–71.
- Selmar D, Kleinwachter M. Influencing the product quality by deliberately applying drought stress during the cultivation of medicinal plants. Ind Crop Prod. 2013;42:558–66.
- Cushman JC. Osmoregulation in plants: Implications for agriculture. Amer Zool. 2001;41:758-69.
- Fahad S, Bajwa AA, Nazir U, et al. Crop production under drought and heat stress: Plant responses and management options. Front Plant Sci. 2017;8:1147.
- AbdElgawad H, Zinta G, Hegab MM, et al. High salinity induces different oxidative stress and antioxidant responses in maize seedlings organs. Front Plant Sci. 2016;7:276.
- Koca H, Bor M, Özdemir F, et al. The effect of salt stress on lipid peroxidation, antioxidative enzymes and proline content of sesame cultivars. Envir Expl Bot. 2007;60:344-51.
- Sivritepe N, Eris A. Determination of salt tolerance in some grapevine cultivars (Vitis viniferaL.) under in vitro conditions. Tr J Biol. 1999;23:473-85.
- Di Martino C, Sebastiano D, Pizzuto R, et al. Free amino acid and glycine betaine in leaf osmoregulation of spinach responding to increasing salt stress. New Phytol. 2003;158:455-63.
- Schleiff U. Analysis of water supply of plants under saline soil conditions and conclusions for research on crop salt tolerance. J Agron Crop Sci. 2008;194:1-8.
- Shao H, Jiang S, Li F, et al. Some advances in plant stress physiology and their implication in the system biology era. Colloids Surf B Biointerfaces. 2007;54:33-6.
- Bartels D, Sunkar R. Drought and salt tolerance in plants. Crit Re Plan Sci. 2005;24:23-58.
- Cavagnaro JB, Ponce MT, Guzman J, et al. Argentinean of cultivars of vitis vinifera grow better than european ones when cultured in vitro under salinity. Biocell. 2006;30:1-7.
- Bongiorno PB, Fratellone PM, LoGiudice P. Potential health benefits of garlic (Allium sativum): A narrative review. J Comp Int Med. 2008;5.
- Chen Z, Cuin TA, Zhou M, et al. Compatible solute accumulation and stress-mitigating effects in barley genotypes contrasting in their salt tolerance. J Exp Bot. 2007;58:4245-255.
- Caplan AB, Dekeyser CR, Van Montagu M. Salinity and drought stress in rice. In: SANGWAN, R.S. and SANGWAN-NORREL, B. eds. The Impact of Bio Agr. 1990;8:391-402.
- Hayat S, Hayat Q, Alyemeni MN, et al. Role of proline under changing environments: A review. Plant Signal Behav. 2012;7:1456-66.
- Liang X, Zhang L, Natarajan SK, et al. Proline mechanisms of stress survival. Antioxid Redox Signal. 2013;19:998-1011.
- Zhou Y, Tang N, Huang L, et al. Effects of salt stress on plant growth, antioxidant capacity, glandular trichome density, and volatile exudates of schizonepeta tenuifolia Briq. Int J Mol Sci. 2018;19:252.
- Gill SS, Tuteja N. Reactive oxygen species and antioxidant machinery in abiotic stress tolerance in crop plants. Plant Physiol Biochem. 2010;48:909–30.
- Tattini M, Remorini D, Pinelli P, et al. Morpho-anatomical, physiological and biochemical adjustments in response to root zone salinity stress and high solar radiation in two Mediterranean evergreen shrubs, Myrtus communis and Pistacia lentiscus. New Phytol. 2006;170:779–94.
- Pressey R. Anions activate the oxidation of indoleacetic acid by peroxidase from tomato and other sources. Plant Physiol. 1990;93:798–804.
