Review Article - Journal of Food Nutrition and Health (2022) Volume 5, Issue 6
Impact of elemental chemistry on water quality in Missouri reservoir
Pauline Onema1,4*, Abua Ikem1,2, Katrina Knott3, Onema Adojoh51Department of Agriculture and Environmental Sciences, Lincoln University, Jefferson, Missouri
2Department of Cooperative Research Programs, Lincoln University, Jefferson, Missouri
3Department of Conservation, Ecological Health University, Columbia, Missouri
4Department of Civil and Environmental Engineering, Case Western Reserve University, OH, USA
5Department of Earth, Environmental, and Planetary Sciences, Case Western Reserve University, OH, USA
- *Corresponding Author:
- Pauline Onema
Department of Agriculture and Environmental Sciences
Lincoln University, Jefferson, Missouri
E-mail: pao31@case.edu
Received: 26-Oct-2022, Manuscript No. AAJFNH-22-82709; Editor assigned: 28-Oct-2022, PreQC No. AAJFNH-22-82709 (PQ); Reviewed: 14-Nov-2022, QC No. AAJFN-22-82709; Revised: 21-Nov-2022, Manuscript No. AAJFNH-22-82709 (R); Published: 28-Nov-2022, DOI: 10.35841/aajfnh-5.6.131
Citation: Onema P, Bhutada SA, Girase MS. Impact of elemental chemistry on water quality in missouri reservoir. J Food Nutr Health.2022;5(6):131
Keywords
Trace element, Largemouth bass, Water quality, Lake, Reservoir, Heavy metal.
Introduction
Freshwater quality and quantity are essential to the global population [1]. The World’s twenty-one largest lakes hold approximately two-thirds of all global surface freshwater [2]. Natural lakes and reservoirs (synthetic) provideseveral services such as recreation, economic benefits [3,4] and support biodiversity, flow regulation, water supply, and energy production [5].
Natural (weathering) and anthropogenic sources (e.g., sewage discharges, agricultural activities/fertilizers, mining, atmospheric deposition) contribute to the pollution of freshwater ecosystems [6,7]. Reservoirs are part of the global carbon cycling and are potential sinks of nitrogen (N), phosphorus (P), silicon (Si) [8], and inorganic and organic contaminants [7].
As global reservoir and dam construction intensifies to meet growing water demands, it may become increasingly important that we understand the processes of both lakes and reservoirs, predominantly as they relate to climate change and eutrophication [9]. Lakes are often categorized by their nutrient levels into what are known as ‘trophic states’ (e.g., sediment release rates of water quality constituents into the water column, temperature effects, etc.). The three trophic states are known as eutrophic, mesotrophic, and oligotrophic. Eutrophic lakes have high nutrient (e.g., P and N) concentrations and in turn, have abundant algae populations and poor visibility. Oligotrophic lakes have low levels of nutrients in their waters and support little algal growth. The water is typically clear and blue, and the visibility is exceptionally good. Mesotrophic lakes have medium levels of nutrients and sit between eutrophic and oligotrophic lakes in terms of their trophic state. The relative importance of P and N as controls in freshwater ecosystems, however, has been contested for decades [9]. However, it is shown that even though lakes and reservoirs possess many shared characteristics, reservoir processes sometimes differ from those of natural lakes [10]. Each lake's chemistry is unique to that lake. The watershed, atmosphere, and Lake Bottom all affect the chemistry of a lake due to the presence of trace elements transported from the catchment or deposited in an insitu. Therefore, the chemical makeup of a lake is affected by its climate and its basin geology. [11].
Trace elements such as Co, Cu, Zn, Fe, Se, Hg, and Mn are essential and occur in minute concentrations in biological systems. They may exert beneficial or harmful effects on plant, animal, and human life depending upon the concentration [12]. Non-essential elements such as Cd, As, Hg, and Pb are toxic and pose harm to organisms and humans. [12]. Due to the bioaccumulation and biomagnification effects of MeHg, elevated Hg concentration in fish has been found in some lakes and new impoundment reservoirs [13]. Fish have become the main Hg exposure route to people because they usually contain more MeHg than other food sources [13].
Site description
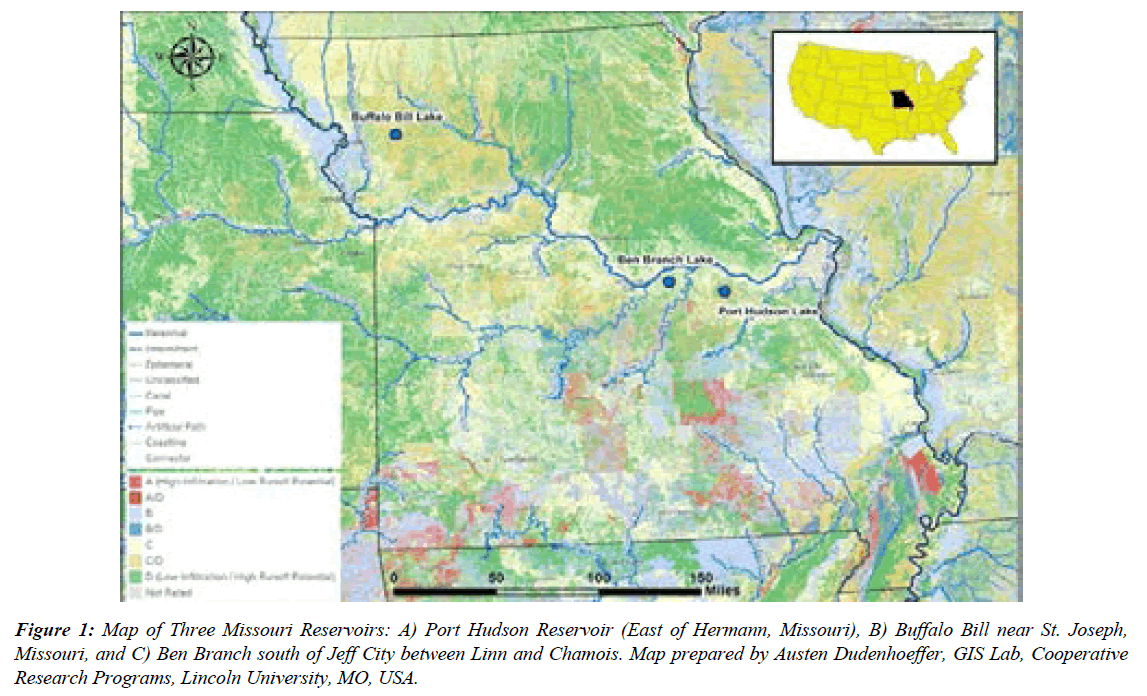
This study was carried out in three lake locations (Port Hudson, Buffalo Bill, and Ben Branch Lakes). Port Hudson Lake is a 55-acre lake located in Franklin County approximately 6 miles northeast of Gerald (T 43N, R 3W, S 16) (Figure 1). Construction of the lake and its facilities began in May 1992 and was completed in December 1993. It is owned by the Missouri Department of Conservation with the Fisheries Division serving as the administering unit, with maintenance support from the Forestry Division. Port Hudson was created by impounding unnamed tributaries of the Middle Fork of Cedar Fork (Missouri River Basin – Boeuf Cr. watershed). The lake regularly produces several stands of various aquatic macrophytes (sedges, rushes, cattails, naiads, pondweeds, contrails), but filamentous algae have not been a problem. Secchi disk readings have rarely exceeded 60 inches, and the conductivity of the lake is regularly below 200 μS [14].
Figure 1: Map of Three Missouri Reservoirs: A) Port Hudson Reservoir (East of Hermann, Missouri), B) Buffalo Bill near St. Joseph, Missouri, and C) Ben Branch south of Jeff City between Linn and Chamois. Map prepared by Austen Dudenhoeffer, GIS Lab, Cooperative Research Programs, Lincoln University, MO, USA.
Buffalo Bill Lake is approximately 45 acres, and it provides quality sportfish populations for anglers to harvest fish. Ben Branch Lake Conservation Area is in Osage County, 10 miles north of Linn and west of Missouri Highway 89. The Department purchased 512 acres in 1978. Since then, additional land was purchased, and the area is now 563 acres. In 1983, 39-acre Ben Branch Lake was constructed. The lake began filling in October of that year and was opened to fishing in 1985. Approximately 478 acres (83 percent) of the area is heavily wooded. On the better soils of the area, white and black oak are supported (MDC, 2014).
The present study compared the inorganic composition of three Missouri reservoirs (Lakes) to understand the water quality stressors and most importantly, the levels of potentially toxic elements (As, Cd, Hg, Pb, and Sn) and their significance to fish and human health. The objectives of this study are to i) Evaluate the water quality characteristics of Port Hudson, Buffalo Bill, and Ben Branch reservoirs and compare them with reference freshwater values, ii) Determine the concentration of 26 elements (Ca, Cd, Co, Cr, Cu, Fe, K, Mg, Mn, Mo, Na, Ni, Se, V, Zn, B, Hg, Pb, P, Tl, Be, Ba, Sb, Ag, Al, and As) in largemouth bass (LMB; skin-off fillet) from the Missouri reservoirs.
Materials and Methods
Lake water sampling and field measurements
Lake water samples were collected from the deepest area of the lake near the dam and from 2 arms where the lake was shallower. Samples were collected in pre-cleaned amber bottles (1 L) and transported to the laboratory in a cooler containing ice. One container was for the analysis of elements and the other was for general parameters (pH, electrical conductivity, anions, and alkalinity).
Water analyses
The pH and electrical conductivity (EC) of the samples were measured using a multi-parameter probe pH/ORP/ conductivity meter (Orion, Model 555A). Total alkalinity was by potentiometric titration (HI 901, Hanna Instruments), and anions by ion chromatography (Dionex ICS-5000+). Dissolved organic carbon (DOC) and total dissolved nitrogen (TDN) concentrations in samples were quantified using the nondispersive infrared (NDIR) and chemiluminescence detection techniques, respectively (Shimadzu Scientific Instruments).
The analytical procedure for metals/metalloids was described by following [15]. The elemental content of unfiltered water samples was determined using the Agilent 5110 ICP–OES synchronous vertical dual view (SVDV) ICP-OES coupled to an SPS 3 auto sampler (Agilent Technologies, California, USA). An instrument tune was performed using the tune solution. External calibrations were conducted using the working calibration standards (prepared from a 100 mg L-1 solution). The elements were measured using their characteristic atomic emission lines. Samples were analyzed under the axial mode for maximum sensitivity.
Blanks, ICV (independent calibration verification), QCS-26 (quality control sample), and SRM 1640 reference samples were analyzed along with each batch of 15 samples [16]. Background correction was performed through the fastautomated curve fitting technique (FACT) to achieve the detection limits [17]. The analytical concentrations were calculated using ICP Expert software (Version 7.4.1. 10449; Agilent Technologies). The instrument's optimum operating parameters were as programmed by Agilent [18], and the conditions were modified following appropriate validation experiments. The ICP parameter settings were: power (1.20 KW); radiofrequency generator (27 MHz); detector: Vistachip II charge-coupled device (CCD), stabilization time (15s); nebulizer flow (0.7 l min-1); plasma flow (12 L min-1); auxiliary flow (1 L min-1); makeup flow (1 L min-1); use multiple conditions (synchronous vertical dual view (SVDV); viewing height (8 mm); SPS 4 autosampler rinse pump (control speed: fast); replicate read time (3s); pump speed (12 rpm); sample uptake delay (15 s; fast pump); rinse time (30s, fast pump); and read time (5s). Yttrium was aspirated along with a sample (ratio 1:1) into the plasma as part of the quality control process. The limit of detection (LOD) and limit of quantitation (LOQ) values were calculated as three times the standard deviation (3.3σ) and ten times the standard deviation (10σ) of results obtained from the analysis of twenty spiked (5 ppb) samples. The LOD (μg L-1) and LOQ (μg L-1) are reported in Table 1.
| Element | LOD | LOQ | ICV | QCS | ||||
|---|---|---|---|---|---|---|---|---|
| Average | SD | %Recovery | Average | SD | %Recovery | |||
| AgAxial 328.068 | 0.006 | 0.018 | 0.98 | 0.01 | 98 | 0.96 | 0.04 | 96.1 |
| Al Axial 167.019 | 0.006 | 0.018 | 1.07 | 0.11 | 107 | 1.07 | 0.14 | 106.5 |
| As Axial 188.980 | 0.01 | 0.029 | 0.97 | 0.01 | 97 | 0.95 | 0.03 | 95.5 |
| B Axial 249.772 | 0.002 | 0.005 | 0.96 | 0.01 | 96 | 0.96 | 0.04 | 95.7 |
| Ba Axial 455.403 | 0.006 | 0.019 | 0.97 | 0.01 | 97 | 0.96 | 0.03 | 95.7 |
| Be Axial 313.042 | 0.008 | 0.024 | 0.97 | 0.02 | 97 | 0.97 | 0.03 | 96.9 |
| Ca Axial 315.887 | 0.007 | 0.021 | 0.99 | 0.01 | 99 | 0.97 | 0.02 | 96.8 |
| Cd Axial 214.439 | 0.006 | 0.019 | 0.96 | 0.02 | 96 | 0.96 | 0.03 | 95.8 |
| Co Axial 238.892 | 0.006 | 0.018 | 0.96 | 0.01 | 96 | 0.95 | 0.03 | 95.2 |
| Cr Axial 267.716 | 0.006 | 0.017 | 0.97 | 0.01 | 97 | 0.96 | 0.03 | 96.2 |
| Cu Axial 327.395 | 0.006 | 0.018 | 0.99 | 0.01 | 99 | 0.98 | 0.03 | 97.9 |
| Fe Axial 238.204 | 0.005 | 0.014 | 0.96 | 0.01 | 96 | 0.95 | 0.03 | 95.4 |
| K Axial 766.491 | 0.006 | 0.019 | 10.1 | 0.15 | 101 | 9.97 | 0.39 | 99.7 |
| Mg Axial 280.270 | 0.006 | 0.019 | 0.97 | 0.01 | 97 | 0.96 | 0.03 | 96 |
| Mn Axial 257.610 | 0.006 | 0.019 | 0.97 | 0.01 | 97 | 0.96 | 0.03 | 96.1 |
| Mo Axial 202.032 | 0.006 | 0.019 | 0.98 | 0.01 | 98 | 0.98 | 0.03 | 97.5 |
| Na Axial 588.995 | 0.006 | 0.018 | 1.03 | 0.01 | 103 | 1.02 | 0.03 | 101.5 |
| Ni Axial 231.604 | 0.006 | 0.017 | 0.96 | 0.01 | 96 | 0.95 | 0.03 | 95.5 |
| Pb Axial 220.353 | 0.011 | 0.033 | 0.96 | 0.02 | 96 | 0.96 | 0.03 | 95.6 |
| Sb Axial 206.834 | 0.012 | 0.036 | 0.98 | 0.02 | 98 | 0.98 | 0.04 | 97.6 |
| Se Axial 196.026 | 0.018 | 0.055 | 0.99 | 0.02 | 99 | 0.97 | 0.04 | 96.9 |
| Tl Axial 190.794 | 0.016 | 0.049 | 0.93 | 0.01 | 93 | 0.92 | 0.03 | 91.6 |
| V Axial 292.401 | 0.006 | 0.017 | 0.96 | 0.01 | 96 | 0.96 | 0.03 | 95.8 |
| Zn Axial 213.857 | 0.006 | 0.02 | 0.98 | 0.02 | 98 | 0.96 | 0.03 | 96.4 |
Table 1: Recovery values from independent calibration verification (ICV; mg/L) and QCS-26 standard (mg/L) solutions. LOD (estimated from the average of 20 replicates of 5 ppb solution; µg/L); and LOQ (estimated from the average of 20 replicates of 5 ppb solution µg/L); SD is the standard deviation.
The recoveries of ICV and QCS-26 were within ± 10% of the certified values (Table 1). Accuracy rates and precision were from the results of the analysis of ICV, QCS – 26, and certified reference materials (SRM 1640a, DORM-4, and DOLT-5) samples (Tables 2,3). The recovery rates of SRM 1640a were ± 22% of the certified values. The water quality results are expressed in mg L-1 and analysis was in triplicates.
| Element and wavelength | SRM 1640a | |||
|---|---|---|---|---|
| Found Average | Stdev | Certified Average | %Recovery | |
| Ag Axial 328.068 nm ppm | 0.007 | 0 | 0.008 | 87 |
| Al Axial 167.019 nm ppm | 0.06 | 0 | 0.053 | 103 |
| As Axial 188.980 nm ppm | 0.009 | 0.003 | 0.008 | 113 |
| B Axial 249.772 nm ppm | 0.289 | 0.007 | 0.303 | 95 |
| Ba Axial 455.403 nm ppm | 0.149 | 0.002 | 0.152 | 98 |
| Be Axial 313.042 nm ppm | 0.004 | 0.001 | 0.003 | 91 |
| Ca Axial 315.887 nm ppm | 5.41 | 0.048 | 5.615 | 96 |
| Cd Axial 214.439 nm ppm | 0.004 | 0 | 0.004 | 100 |
| Co Axial 238.892 nm ppm | 0.019 | 0.001 | 0.02 | 95 |
| Cr Axial 267.716 nm ppm | 0.039 | 0.001 | 0.041 | 97 |
| Cu Axial 327.395 nm ppm | 0.086 | 0.001 | 0.086 | 101 |
| Fe Axial 238.204 nm ppm | 0.037 | 0.001 | 0.037 | 100 |
| K Axial 766.491 nm ppm | 0.581 | 0.006 | 0.58 | 100 |
| Mg Axial 280.270 nm ppm | 1.013 | 0.01 | 1.059 | 96 |
| Mn Axial 257.610 nm ppm | 0.039 | 0.001 | 0.04 | 97 |
| Mo Axial 202.032 nm ppm | 0.045 | 0.002 | 0.046 | 99 |
| Na Axial 588.995 nm ppm | 3.035 | 0.031 | 3.137 | 97 |
| Ni Axial 231.604 nm ppm | 0.025 | 0.001 | 0.025 | 97 |
| Pb Axial 220.353 nm ppm | 0.014 | 0.005 | 0.012 | 117 |
| Sb Axial 206.834 nm ppm | 0.006 | 0.006 | 0.005 | 112 |
| Se Axial 196.026 nm ppm | 0.015 | 0.001 | 0.02 | 75 |
| Si Axial 251.611 nm ppm | 4.453 | 0.05 | 5.21 | 85 |
| Sr Axial 407.771 nm ppm | 0.125 | 0.002 | 0.126 | 99 |
| U Axial 385.957 nm ppm | 0.021 | 0.002 | 0.025 | 84 |
| V Axial 292.401 nm ppm | 0.015 | 0 | 0.015 | 100 |
| Zn Axial 213.857 nm ppm | 0.052 | 0.001 | 0.056 | 94 |
Table 2: Recovery results of elements in SRM 1640a certified reference.
| Element | DORM-4 | DOLT-5 | ||||||||
|---|---|---|---|---|---|---|---|---|---|---|
| Average | Stdev | Count | Certified value | % Rec | Average | Stdev | Count | Certified value | % Rec | |
| As | 5.85 | 1.22 | 5 | 6.87 | 85 | 31.5 | 1.02 | 5 | 34.6 | 91 |
| Ca | 2135 | 235 | 5 | 2360 | 90 | 530.44 | 27 | 5 | 550 | 96 |
| Ca | 2056 | 224 | 5 | 2360 | 87 | 515.8 | 27.2 | 5 | 550 | 94 |
| Cd | 0.32 | 0.07 | 5 | 0.3 | 108 | 12.28 | 0.3 | 5 | 14.5 | 85 |
| Co | 0.23 | 0.09 | 5 | 0.25 | 92 | 0 | 0 | 5 | 0.3 | - |
| Cr | 1.75 | 0.14 | 5 | 1.87 | 94 | 1.84 | 0.11 | 5 | 2.4 | 78 |
| Cu | 14.74 | 1.49 | 5 | 15.7 | 94 | 34.89 | 0.4 | 5 | 35 | 100 |
| Fe | 299 | 33.5 | 5 | 343 | 87 | 985.21 | 18.8 | 5 | 1070 | 92 |
| K | 17262 | 1767 | 5 | 15500 | 111 | 19894 | 645 | 5 | 14400 | 138 |
| Li | 1.24 | 0.21 | 5 | 1.21 | 103 | 0 | 0 | 5 | ||
| Mg | 723 | 64.7 | 5 | 910 | 79 | 786.75 | 42.5 | 5 | 940 | 84 |
| Mn | 2.81 | 0.53 | 5 | 3.17 | 89 | 7.98 | 0.16 | 5 | 8.9 | 90 |
| Mo | 0.28 | 0.12 | 5 | 0.29 | 97 | 1.4 | 0.14 | 5 | 1.4 | 99 |
| Na | 15809 | 1613 | 5 | 14000 | 113 | 12551 | 95.7 | 5 | 9900 | 127 |
| Ni | 1.61 | 0.4 | 5 | 1.34 | 120 | 1.43 | 0.29 | 5 | 1.7 | 84 |
| P | 7121 | 674 | 5 | 8000 | 89 | 10638 | 379 | 5 | 11500 | 93 |
| Se | 3.03 | 1.45 | 5 | 3.45 | 88 | 8.56 | 1.28 | 5 | 8.3 | 103 |
| Sr | 8.12 | 0.85 | 5 | 10.1 | 80 | 3.54 | 0.23 | 5 | 3.7 | 95 |
| V | 1.44 | 0.19 | 5 | 1.57 | 91 | 0.54 | 0.05 | 5 | 0.5 | 105 |
| Zn | 44 | 4.66 | 5 | 51.6 | 85 | 92.19 | 1.79 | 5 | 105.3 | 88 |
DOLT-5: Dogfish liver-certified reference material for trace metals and other constituents.
Table 3: Recoveries (%) of elements from analysis of DORM-4 and DOLT-5 b reference materials.
Hg content of water samples was determined using the Direct Mercury Analyzer (DMA; Milestone Inc., CT, USA) according to the U.S. EPA method 7473 [19]. Water samples were weighed into pre-cleaned analytical boats (blanks) and subject to the analytical cycle. All Hg concentrations are determined as total Hg. The method involved thermal decomposition of the sample, catalytic conversion, amalgamation, and mercury detection by atomic absorption spectrophotometry at 253.65 nm. The analysis conditions as described by [20,21] were followed. The detection limit was 0.0002 ng Hg and the Easy Control software controlled the equipment’s operation. DORM – 4 and DOLT – 5 were used for calibration and method validation, respectively. Excel 2016 was utilized to prepare the summary statistics of the water quality parameters. Piper and Durov diagram diagrams were prepared using AqQA 1.5.0 (The spreadsheet for water analysis). Stat graphics 18 was utilized to model the water quality parameters.
Results
Quality assurance and quality control (QA/QC)
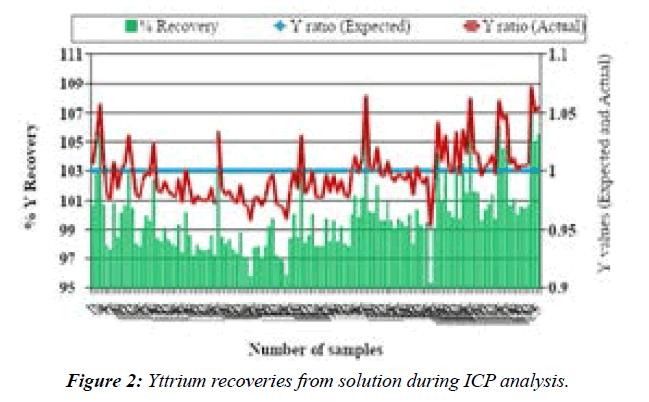
Table 2 reports the recovery values of analyzed elements in SRM 1640a. The recovery results, for most elements, were in the satisfactory range (75% –113%). Repeatability results from the analysis of ICV and QCS–26 solutions, expressed as relative standard deviations (RSDs), ranged from 1% to 1.5% and 1% to 4%, respectively. The recovery rates of elements from the ICV and QCS-26 solutions table 1 were within the ranges of 93% to 107% and 92% to 107%, respectively Table 1. Moreover, the recovery rates of the internal standard (Y) ranged from 95% to 107% (Figure 2). The recoveries of ICV and QCS-26 were within ± 10% of the certified values Table 1. Table 3 presents the accuracy rates and precision of the results of DORM-4, and DOLT-5 analysis. DORM-4 recovery rates were within ± 21% of the certified values Table 3.
Lake water chemistry and implication of the study
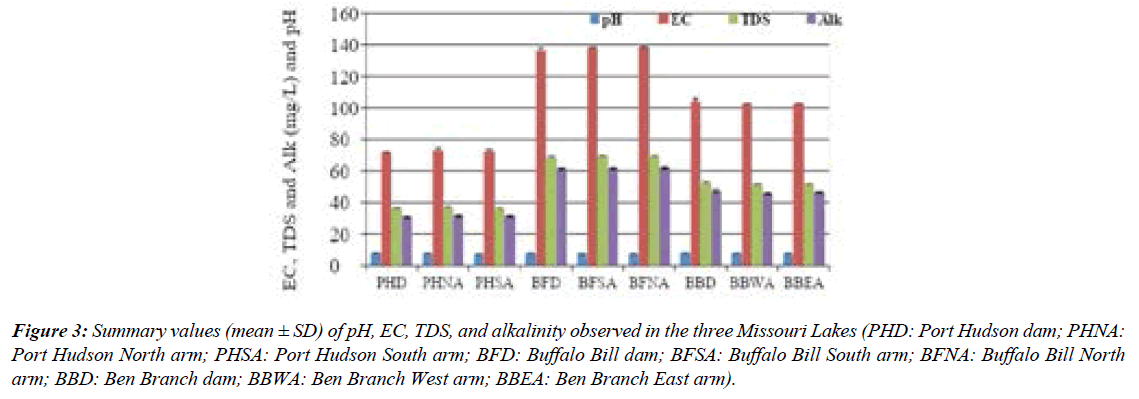
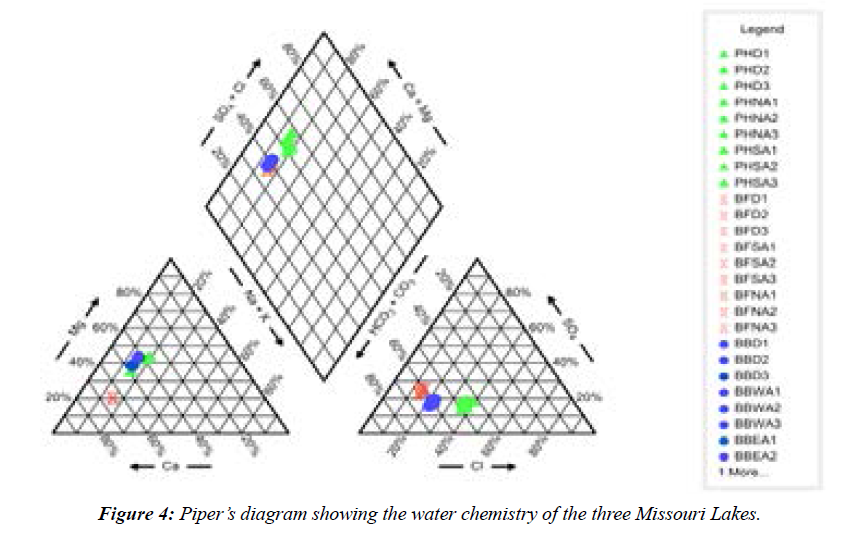
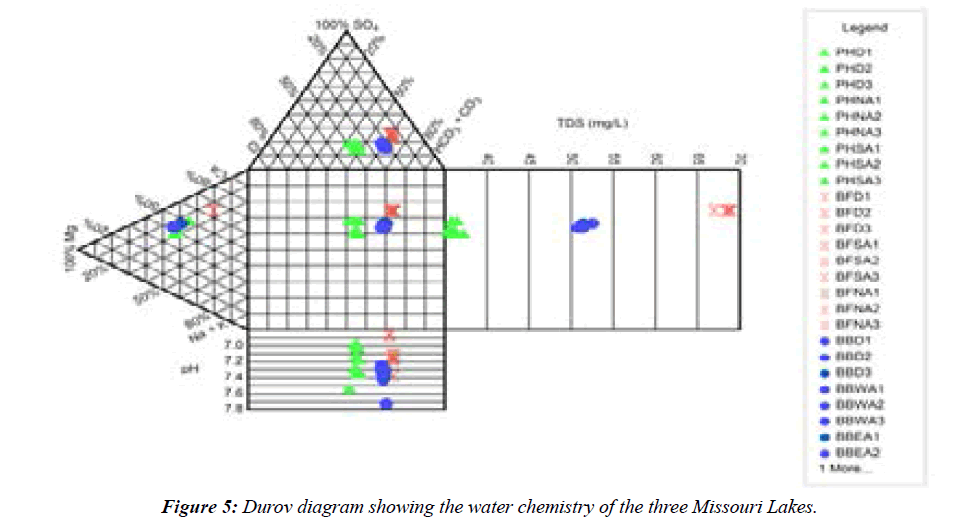
Across the study sites, pH ranged from 6.85–7.73, thus the lakes are characterized as neutral. Total alkalinity values were comparable across the three lakes (Figure 3). The total dissolved solids (TDS) values among the lakes varied from <40 mg L-1 to<70 mg L-1 (Figure 4), which indicated a slight difference in the total dissolved salt content, especially between Port Hudson and Buffalo Bill lakes. Concerning the three lakes, the abundance of the ions followed the order: CA>HCO3->Mg>K>Fe>SO43->Cl->Na>Si>NO3- >Mn>Al>F->P. The lakes are characterized largely as Ca2+- Mg2+- HCO3- type systems (Figure 5; Piper diagram shows the facies of the three reservoirs). Ca and Mg were the most dominant cations while bicarbonate was the most abundant anionic species in the reservoirs. Additional water quality characteristics of the reservoirs are summarized in the Durov diagram (Figure 5).
Figure 3: Summary values (mean ± SD) of pH, EC, TDS, and alkalinity observed in the three Missouri Lakes (PHD: Port Hudson dam; PHNA: Port Hudson North arm; PHSA: Port Hudson South arm; BFD: Buffalo Bill dam; BFSA: Buffalo Bill South arm; BFNA: Buffalo Bill North arm; BBD: Ben Branch dam; BBWA: Ben Branch West arm; BBEA: Ben Branch East arm).
Zn values ranged from <LOD–34 ppb with 56% of samples exceeding the freshwater reference [22]. Ca values ranged from 5.33–18.15 ppm with 100% exceedance relative to the freshwater reference (2 ppm). Mg values ranged from 3.13–5.9 ppm with 56% exceedance relative to the freshwater reference (4 ppm). Na values ranged from 1.63–2.43 ppm with 0% exceedance relative to the freshwater reference (5 ppm). Fe values ranged from 0.13–12.00 ppm with 22.2% exceedance relative to the freshwater reference (5 ppm). From the DMA results, mercury was undetectable in water samples (Figure 6).
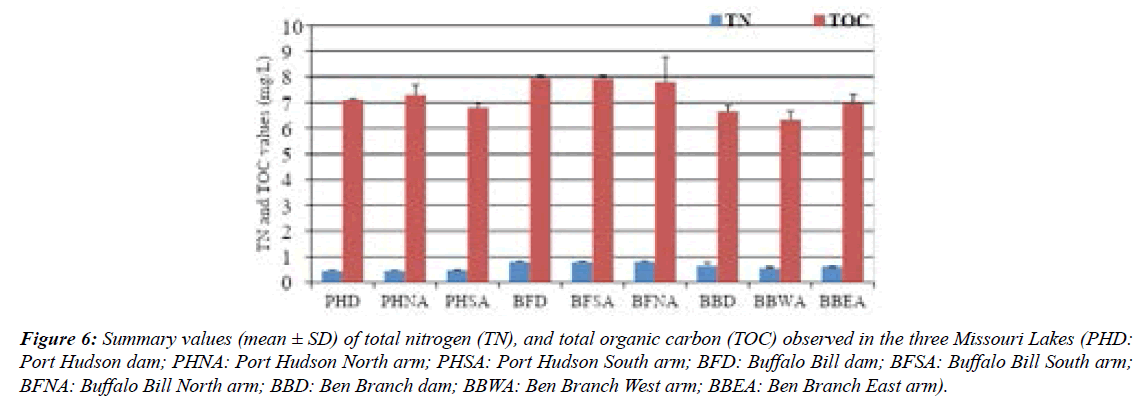
Figure 6: Summary values (mean ± SD) of total nitrogen (TN), and total organic carbon (TOC) observed in the three Missouri Lakes (PHD: Port Hudson dam; PHNA: Port Hudson North arm; PHSA: Port Hudson South arm; BFD: Buffalo Bill dam; BFSA: Buffalo Bill South arm; BFNA: Buffalo Bill North arm; BBD: Ben Branch dam; BBWA: Ben Branch West arm; BBEA: Ben Branch East arm).
Bar charts of TN and TOC; pH, EC, TDS, total alkalinity; and P are shown in Fig. 4A–C, respectively. In the present work, total nitrogen (TN) levels recorded for the three reservoirs were in the range of 0.44 to 0.79 mg/L (Mean: 0.61 mg/L). According to [23] reported criteria, the Port Hudson reservoir was mesotrophic (TN > 300 – 500 μg/L) while Buffalo Bill and Ben Branch were eutrophic (TN > 500–1200μg/L). Hypereutrophic waters have TN levels > 1200 μg/L while waters with TN ≤ 300 μg/L are oligotrophic. The highest TN in this study was below the maximal concentration in 94 Missouri reservoirs (Jones and Knowlton, 1993).
Total phosphorus (TP) levels in this current work ranged from 0.01 – 0.61 mg/L while the median levels for 94 Missouri reservoirs ranged from 6–187 μg/L. The criterions used for TP (μg/L) levels in this study are as follows: oligotrophic ≤ 10; mesotrophic >10–25; eutrophic >25–100; and hypereutrophic >100 (Jones and Knowlton, 1993). Port Hudson and Ben Branch dams and Port Hudson south arm samples were hypereutrophic while PHSA, BBWA, and BBEA were mesotrophic. Nonetheless, All Buffalo Bill samples were eutrophic (Figure 7).
Figure 7: Summary values (mean ± SD) of total phosphorus (P) observed in the three Missouri Lakes (PHD: Port Hudson dam; PHNA: Port Hudson North arm; PHSA: Port Hudson South arm; BFD: Buffalo Bill dam; BFSA: Buffalo Bill South arm; BFNA: Buffalo Bill North arm; BBD: Ben Branch dam; BBWA: Ben Branch West arm; BBEA: Ben Branch East arm).
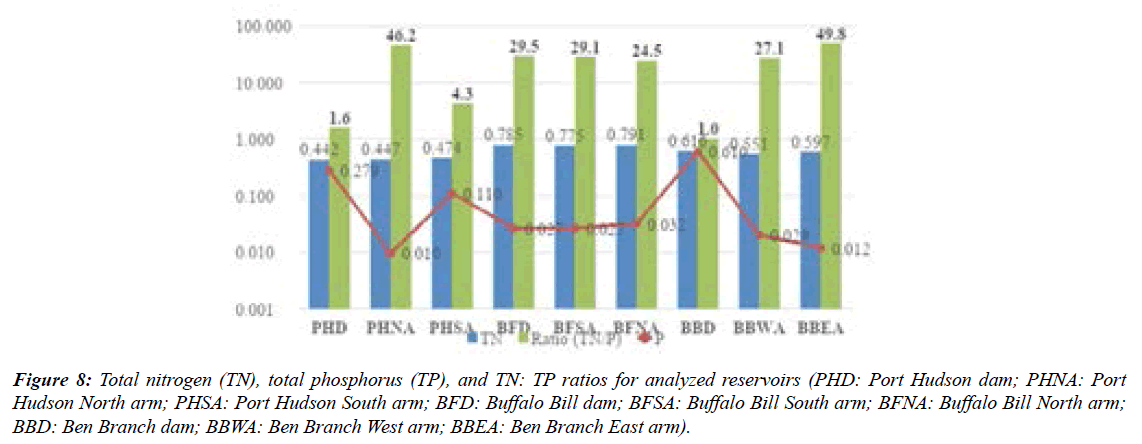
TN:TP distribution in the three reservoirs Figure 8 may suggest N or P limitations (Figure 8). The PHD and PHSA samples were thought to be N limited (TN: TP<10; Forsberg and Ryding, 1980) while other samples (Figure 9) in the present work were P limited (TN: TP >17; Forsberg and Ryding, 1980). Eutrophication is driven by the presence of nutrients (N, P) in waters due to anthropogenic pressures [24].
Figure 8: Total nitrogen (TN), total phosphorus (TP), and TN: TP ratios for analyzed reservoirs (PHD: Port Hudson dam; PHNA: Port Hudson North arm; PHSA: Port Hudson South arm; BFD: Buffalo Bill dam; BFSA: Buffalo Bill South arm; BFNA: Buffalo Bill North arm; BBD: Ben Branch dam; BBWA: Ben Branch West arm; BBEA: Ben Branch East arm).
Predicting total alkalinity and total nitrogen levels in the lakes
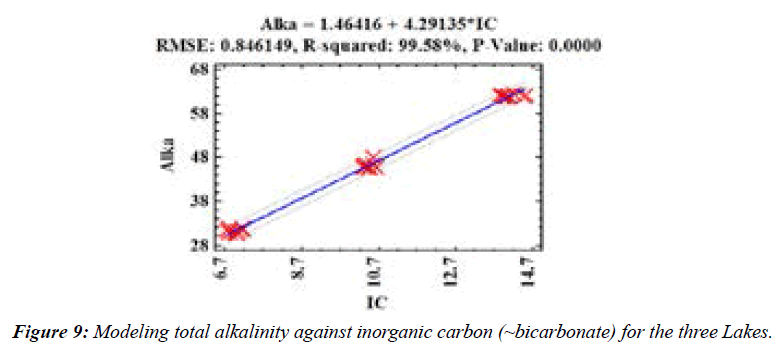
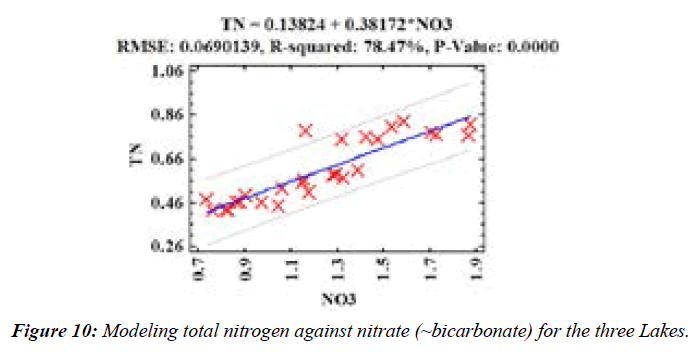
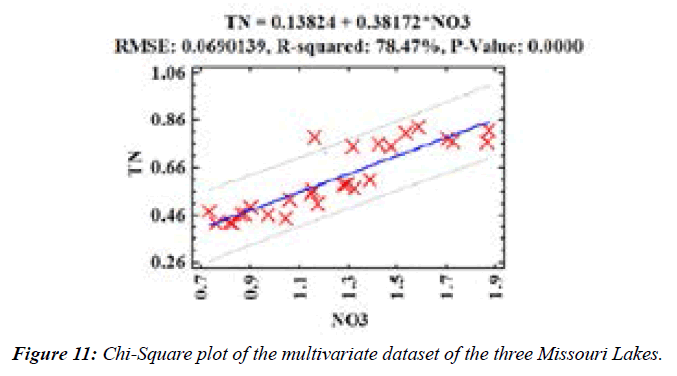
The total alkalinity of the Lakes was predicted using inorganic carbon (IC) values (p =0.0000;) (Figure 10). IC was mostly bicarbonate species in the lakes [25,26]. Further, (Figure 11) showed that NO3- levels could be used to predict TN concentrations in the Lakes (p =0.0000; RMSE: Root mean square error is the difference between the observed and predicted values while R-square is the coefficient of determination).
Spearman’s Rank Correlation
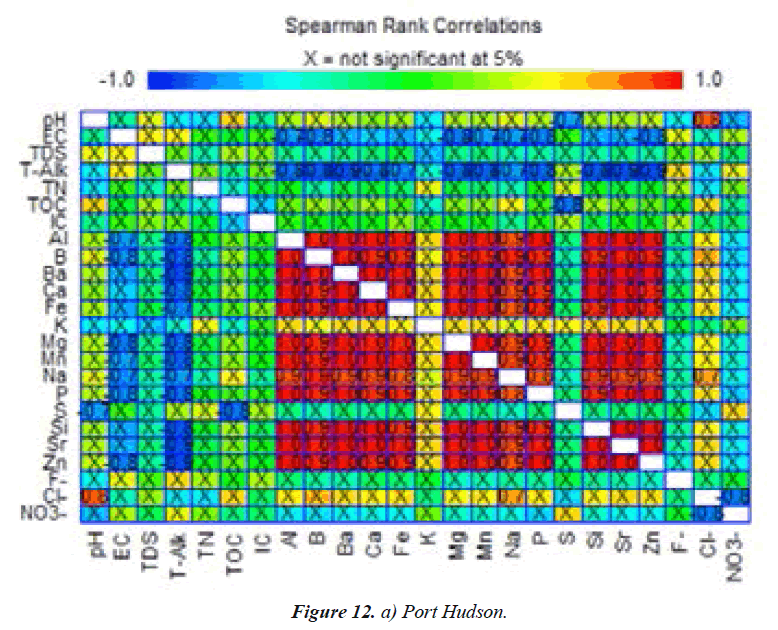
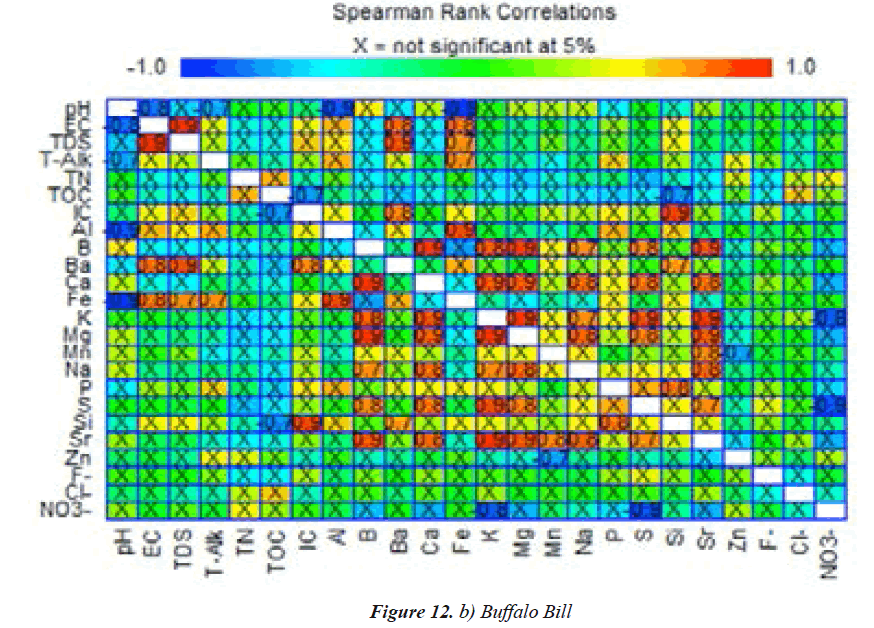
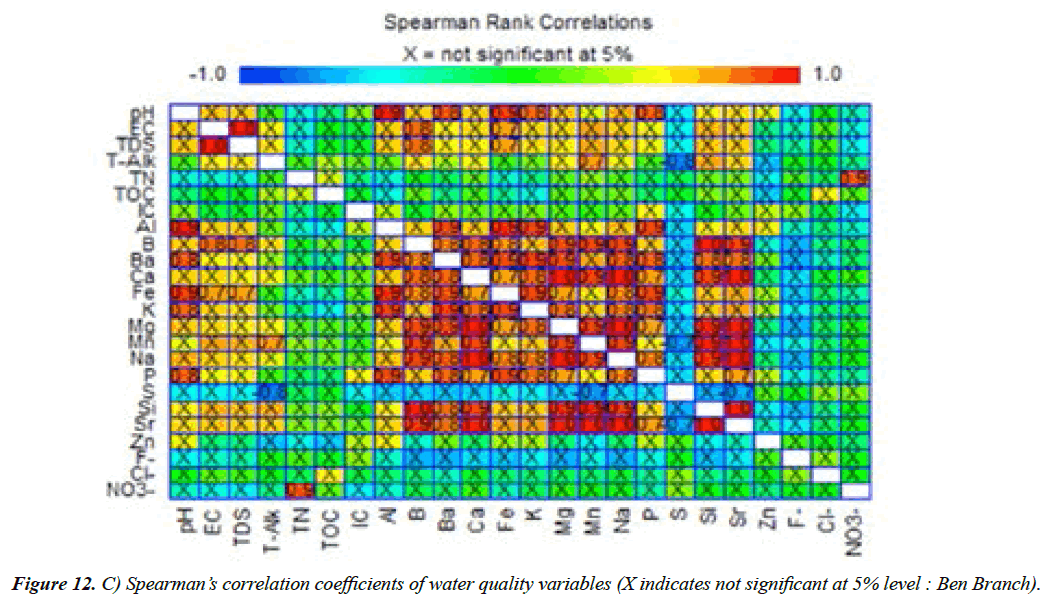
Based on Royston's H test, the Chi-Square plot revealed the normality of the data distribution (K-S= 0.101;p>0.25; Figure 12) for most of the data [27-29]. However, Spearman’s rank correlation adjudged to be a highly accurate technique was performed to understand the interrelationships between the variables. Spearman’s rank coefficients among the water quality variables (Figure 12) were very strong (TDS vs. IC, TN, Ca, Tot, Alk, NO3−,PO43−, SO42 (0.8-0.9); B vs. Sr, Na, K, Ca (0.8–0.9); and Ba vs. Si, Fe (0.8-0.9).
Spearman’s rank correlation - Port Hudson Lake
Figure 12a shows Spearman’s correlation coefficients for Port Hudson Lake water constituents [30,31]. pH correlated strongly with Cl-(0.8)but negatively with S(-0.7). EC was very strongly associated with Al, B, Ba, Ca, Fe, Mg, Mn, Na, P, Sr, and Zn (0.9–1.0).Si correlated exceptionally with several cations: Al, B, Mg, Mn, Na, P, and Zn (-0.7to -1.0),which implied the significant interrelationships of the elements in the dissolved minerals. Total alkalinity is also strongly but negatively correlated with Al, B, Ba, Ca, Fe, Mg, Mn, Na, P, Si, Sr, and Zn (-0.7 to - 0.9). Nitrate vs. Cl-(-0.8) and TOC vs. S (-0.8) were strongly but negatively associated with each other (Figure 12a). Cl- vs. Na (0.7) and Cl- vs. pH (0.8) were very strongly correlated species [32].
Spearman’s rank correlation - Buffalo Bill Lake
Figure 12b shows Spearman’s correlation coefficients for Buffalo Bill Lake water quality variables. pH correlated very strongly but negatively with EC(-0.8),total alkalinity(- 0.7),and Fe and Al (-0.9).EC was excellently influenced by TDS, Ba, and Fe (0.8–0.9; Figure 3b). B vs. Sr, S, Na, Mg, K, and Ca (0.8–0.9) were excellently associated due to potentially dissolved ores Figure 12b . Ca was exceptionally correlated (0.8–0.9) with Sr, S, Na, Mg, B, and K. Also, nitrate vs. S and K were very strong but in negative associations with one another. P vs. Si was also very strong (0.8) and may be associated with silicate minerals. Si vs. P, Ba, and IC were highly correlated [33].
Spearman’s rank correlation - Ben Branch Lake
Figure 12c shows Spearman’s correlation coefficients for Ben Branch Lake water quality variables. pH correlated very strongly with Al (0.9),Ba(0.8),Fe, K, and P (0.8-0.9). EC was excellently influenced by TDS (1.0) followed by B, and Fe (0.7–0.9; Figure 12c). B vs. Sr, Si, Na, Mn, Mg, Ba, and Ca (0.8–0.9) were excellently associated with one another. This may be due to their presence in dissolved ores or from the same origins. Ca was exceptionally correlated (0.8–0.9) with Sr, B, Ba, Fe, K, Mg, Mn, Na, P, and Si (0.7–0.9). S is associated strongly and negatively with total alkalinity (-0.8), Mn (-0.7), and Sr (-0.7). Also, nitrate correlated exceptionally with TN (0.9), and TOC, F, and Cl did not have significant (p>0.05) with one another (Figure 12c).
Conclusion
This study investigated the water quality status of three Missouri reservoirs. The pH of the three reservoirs was neutral, and the reservoir systems were characterized as Ca2+ -Mg2+- HCO3- type. Zn and Fe levels exceeded the freshwater reference values (Markert, 1996). The most abundant ions were Ca, HCO3-, Mg, and K in the water column. Significant strong interrelationships of some water quality variables were due to similarities in the chemical characteristics and or origins. Based on the three reservoirs, some of the metal levels in this study were below the maximum limits. However, Hg posed the greatest risks from exposure to metals.
Acknowledgement
I would like to take this opportunity to thank those who have significantly contributed. My profound gratitude to Prof. Abua Ikem, Head of the Department of Agriculture and Environmental Sciences, Lincoln University of Missouri for his support throughout the project work and Dr. Katrina Knott for her immeasurable support and the Missouri Department of Conservation for their collaboration on this project with Lincoln University, I would also like to thank Dr. Onema Adojoh for his support. In addition, USDA-NIFA are (Evans-Allen grant: accession number #MOLU-IKEM5 and CBG grant Award #:2015-38821-24386) for supporting this research.
References
- Jenny P, Orlane A, Fabien A, et al. Scientists Warning to Humanity: Rapid degradation of the world’s large lakes. J Great Lak Res. 2020;46:686-92.
- Sterner RW, Reinl KL, Lafrancois BM, et al. The first assessment of cyanobacterial blooms in oligotrophic Lake Superior. Limno and Oceano. 2020;65:2984–98.
- Weng W, Kevin JB, Kaitlin JF, et al. Coupling natural and human models in the context of a lake ecosystem: Lake Mendota, Wisconsin, USA. Ecol Econ. 2020;169-56.
- Oseke F, Anunu GK, Kwaku A. et al. Assessment of water quality using GIS techniques and water quality index in reservoirs affected by water diversion. Water-Energy Nexus. 2021;4:25–34.
- Fleischmann S, Breda JPF, Passaia OA, etal. Regional scale hydrodynamic modeling of the river-floodplain-reservoir continuum. Journal of Hydrol. 2021;596:14.
- Aguirrezabala-Campano T, Rodrigo Gonzalez-V, Francisco J, et al. Overall spatiotemporal dynamics of greenhouse gasses and oxygen in two subtropical reservoirs with contrasting trophic states. Water Resea. 2021;196:56.
- Meyer-Jacob C, Andrew L, Andrew M, et al. Re-browning of sudbury (Ontario, Canada) lakes now approaches pre-acid deposition lake-water dissolved organic carbon levels. Scie of the Total Envir. 2020;725:47.
- Yan X, Vincent T, Josette G. Long-term assessment of nutrient budgets for the four reservoirs of the Seine Basin (France). Scie Total Envi. 2021;778-12.
- Paerl HW, Scott JT, McCarthy MJ, et al. It takes two to tango: when and where dual nutrient (N & P) reductions are needed to protect lakes and downstream ecosystems. Environ Sci Technol. 2016;50:10805-13.
- Hayes NM, Deemer BR, Corman JR, et al. Key differences between lakes and reservoirs modify climate signals: a case for a new conceptual model. Limnolo Oceanog Lett. 2017;2:47–62.
- Larsen AS, O’Donnell JA, Schmidt JH, et al. Physical and chemical characteristics of lakes across heterogeneous landscapes in arctic and subarctic Alaska. JGR Biogeoscie. 2017;989-08.
- Kupper H. Lead toxicity in plants. J Plant Physiol. 2017;491-500.
- Hylander LD, Gronhn J, Tropp M, et al. Fish mercury increases in Lago Manso, a new hydroelectric reservoir in tropical Brazil. J Environ Manage. 2006;81:155-66.
- Missouri Department of Conservation. Missouri watershed protection practice recommended practices for Missouri forests: management guidelines for maintaining forested watersheds to protect streams. Jefferson City MO: Conservation Commission of the State of Missouri. 2014.
- Ikem A, Egiebor NO. Assessment of trace elements in canned Fishes (Mackerel, Tuna, Salmon, Sardines and Herrings) marketed in georgia and alabama (United State of America). J Food Comp Anal. 2005;18:771-87.
- Ikem A, Egilla J. The trace element content of fish feed and bluegill sunfish (Lepomis macrochirus) from aquaculture and wild source in Missouri. Food Chemi.2008;110, 301-09.
- Ikem A, Ayodeji OJ, Wetzel J, et al. Human health risk assessment of selected metal (loid)s via crayfish (Faxonius virilis; Procambarus acutus acutus) consumption in missouri. Heliyon Journal. 2021;e07194.
- Cauduro J, Ryan A. Ultra-fast ICP-OES determination of trace elements in water, as per USEPA 200.7. Agilent Techno. 2017;1-6.
- USEPA. Method 7473: Mercury in solids and solutions by thermal decomposition, amalgamation, and atomic absorption spectrophotometry. Evisa. 1998.
- Ikem A, Shank B, Caldwell J, et al. Estimating the daily intake of essential and nonessential elements from lamb m. longissimus thoracis et lumborum consumed by the population in missouri (United States). J Food Compos Anal. 2015;4:126-35.
- Health effects of exposure to mercury. US EPA. 2017.
- Markert B, Pedrozo F, Geller W, et al. A contribution to the study of the heavy-metal and nutritional element status of some lakes in the southern Andes of Patagonia (Argentina). Sci The Total Envi. 1997;1-15.
- Jones JR and Knowlton MF. Limnology of missouri reservoirs: an analysis of regional patterns. Lake Rese Man. 1993;8:17–30.
- Vigouroux G, Kari E, Beltrán-Abaunza JM, et al. Trend correlations for coastal eutrophication and its main local and whole-sea drivers Application to the Baltic Sea. Sci Total Environ. 2021;779:146367.
- EFSA: European Food Safety Authority. Scientific opinion on the risks to public health related to the presence of chromium in food and drinking water. EFSA Journal. 2014;12:95.
- EFSA: European Food Safety Authority. Scientific opinion on the risks to public health related to the presence of nickel in food and drinking water. EFSA Journal. 2015;13:02.
- JECFA: Joint FAO/WHO Expert Committee on Food Additives. Safety evaluation of certain food additives and contaminants. WHO Food Additi Seri. 2000;44:273-12.
- JECFA: Joint FAO/WHO Expert Committee on Food Additives. Safety evaluation of certain food additives and contaminants. WHO Food Addi Ser 48. 2011;1-7.
- Seventy-third report of the Joint FAO/WHO Expert Committee on Food Additives. WHO Food Addit Ser. 2011;960:1-37.
- Means B. Risk Assessment guidance for superfund volume I: human health evaluation manual part F, supplemental guidance for inhalation risk assessment. US EPA: U.S. Environ Protec Age. 2009.
- Minamata convention on mercury. United Natio Envir. 2017.
- Regional screening level (RSL)- generic tables. US EPA: United States Environ Protect Agen. 2019.
- Guidelines for human exposure assessment. US EPA: US Envir Prot Age. 2019.
