- Biomedical Research (2009) Volume 20, Issue 3
Gene Expression Profile in Leucocytes of Type 2 Diabetic Subjects
S Kaviarasan1, S Muniandy2*, R Qvist1, IS Ismail11Department of Medicine, Faculty of Medicine, University of Malaya, 50603 Kuala Lumpur, Malaysia
2Department of Molecular Medicine, Faculty of Medicine, University of Malaya, 50603 Kuala Lumpur, Malaysia
- *Corresponding Author:
- Sekaran Muniandy
Department of Molecular Medicine
Faculty of Medicine
University of Malaya
Kuala Lumpur-506 03, Malaysia
E-mail: sekaran@um.edu.my
Accepted date: April 17 2009
Abstract
Communication between insulin target tissues and beta-cells initiate compensatory responses which increase insulin production. Correlated changes, in gene expression between tissues, can provide evidence for such intercellular communication. We profiled gene expression studies in Type 2 diabetic subjects to unveil the mechanistic factors involved. Our results showed that genes involved in carbohydrate, lipid and amino acid metabolism pathways, glycan of biosynthesis, metabolism of cofactors and vitamin pathways, ubiquitin-mediated proteolysis, signal transduction pathways, neuroactive ligand receptor interaction were upregulated in diabetes compared to healthy subjects. In contrast, genes involved in cell adhesion, cytokine-cytokine receptor interaction, insulin signaling, PPAR signaling pathways were downregulated in subjects with type 2 diabetes mellitus (T2DM). β2-microglobulin, a MHC class I molecule was strongly downregulated in diabetic subjects. Further, genes involved in inflammatory pathway are differentially expressed in subjects with T2DM. Hence, it was evident that genes concerned with pathways of carbohydrate, lipid and amino acid metabolism, neuronal function and inflammation play a significant role in the pathobiology of T2DM.
Keywords
Gene expression profile, leucocytes, PCR array, Type 2 diabetes mellitus
Introduction
Type 2 diabetes mellitus (T2DM) is a disorder that involves an increased demand for insulin brought about by insulin resistance, together with a failure to compensate with sufficient insulin production. Although insulin resistance occurs in most obese individuals, diabetes is generally forestalled through compensation with increased insulin. This increase in insulin occurs through an expansion of betacell mass and/or increased insulin secretion by individual beta-cells. Failure to compensate for insulin resistance leads to T2DM.
T2DM is one of the most challenging health problems in many developing and industrialized countries [1]. The exact cause of T2DM, which affects millions of people all over the world, is not known. One of the foremost challenges we face is to account mechanistically for not only the definition of hyperglycemia, but also for the myriad of other biochemical and physiological abnormalities, which are characteristics of this disease. The abnormalities include central obesity, hypertension, accelerated atherosclerosis, hypertriglyceridemia and low serum concentrations of high density lipoproteins [2,3].
One way to understand the pathophysiology of diabetes is to examine the coordinated changes in gene expression in T2DM. In each case, there are groups of genes that undergo changes in expression in a highly correlated fashion. Genomic approaches to determine differential expression profiles utilizing serial analysis of gene expression (SAGE) [4] and DNA microarrays [5] are now providing global views of the potential genes and pathways that are associated with diabetes. Utilizing these approaches, tissuespecific gene expressions in human pancreas, muscle and fat demonstrated differential regulation of approximately 800 genes in diabetes [5].
Systemically circulating peripheral blood mononuclear cells (PBMCs) are considered unique tissue affected by the host condition and may reflect oxidative stress caused by high levels of glucose, insulin, free fatty acids, and tissue-derived circulating bioactive mediators. To verify the hypothesis that the gene expression of PBMCs changes in response to diabetic circumstances, we comprehensively compared global gene expression profiles of PBMCs between patients with and without T2DM by using Reverse Transcription Quantitative Real Time PCR array technology. Even though there is extensive literature relating peripheral blood cells to diabetic complications, the association of gene expression changes in PBMCs in T2DM is largely unknown. In this study, we examined gene expression profiles of peripheral blood cells in T2DM to identify potential gene signatures.
Material and Methods
Study subjects
The study population was composed of six type 2 diabetics and three normal subjects from the mixed races of Malaysian population. Patients were in the age group 30-65 years. .The clinical characteristics of the study subjects were recorded.
Anthropometric measurements
Anthropometric measurements, like weight and height, were obtained using standardized techniques as detailed elsewhere [6]. Height was measured with a tape to the nearest cm. Weight was measured with traditional spring balance that was kept on a firm horizontal surface. The body mass index (BMI) was calculated using the formula

Laboratory studies
After an overnight fast, venous blood samples were withdrawn from each patient in sterile EDTA tubes. Serum samples were assayed for plasma glucose, HbA1C, total cholesterol, triglycerides and HDL cholesterol.
Processing of blood samples
Blood was collected in EDTA tubes. PBMCs were isolated using Ficoll gradients within 4h of each blood draw; if not processed immediately, cells were lysed in RLT buffer containing β-mercaptoethanol and stored at minus 80◦C.
Isolation of RNA from PBMCs
Mononuclear cells were isolated by the Ficoll densitygradient method as previously described [7]. Total RNA was extracted using an RNA isolation kit as per the manufacturer’s protocol (SuperArray, catalog number PA- 001). RNA integrity was assessed using an Agilent 2100 bio-analyzer (Agilent, Palo Alto, Ca).
PCR arrays
From 0.5–1.0 μg of total RNA, double-stranded cDNA was generated using a cDNA synthesis kit (SA Bioscience, Catalog. Number C-03) that eliminated genomic DNA contamination. cDNA was used as a template for SYBRgreen based RT2-qPCR array using the diabetes array plate (SA Biosciences).
Statistical analysis
All data is expressed as means plus/minus SD. Statistical analysis of the results was performed by student‘t’ test. Values were considered significant when p was less than 0.0001.
Results and Discussion
In this study, we demonstrate the possibility that gene expression profile in PBMCs reflects the pathophysiology of T2DM. As T2DM is a multifactorial disorder [8], a comprehensive approach identifying biological pathways or co-regulated gene sets associated with the diseases is required to understand the molecular signature of T2DM [9]. Thus, we screened known human pathways and extracted information on the metabolic pathways that were significantly altered in the PBMCs of the diabetic subjects.
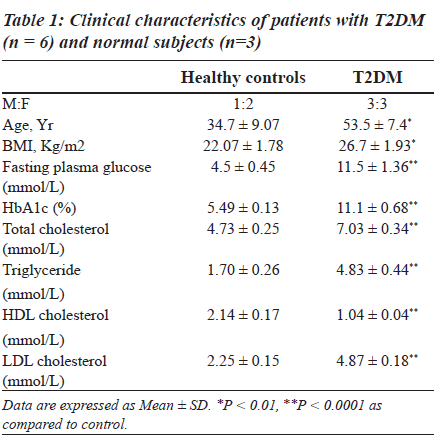
Clinical characteristics of control subjects and patients with diabetes are shown in Table 1. Age, BMI, and levels of fasting plasma glucose, HbA1c, total cholesterol, triglyceride and LDL-cholesterol were significantly increased while HDLcholesterol was found to be decreased in patients with T2DM.
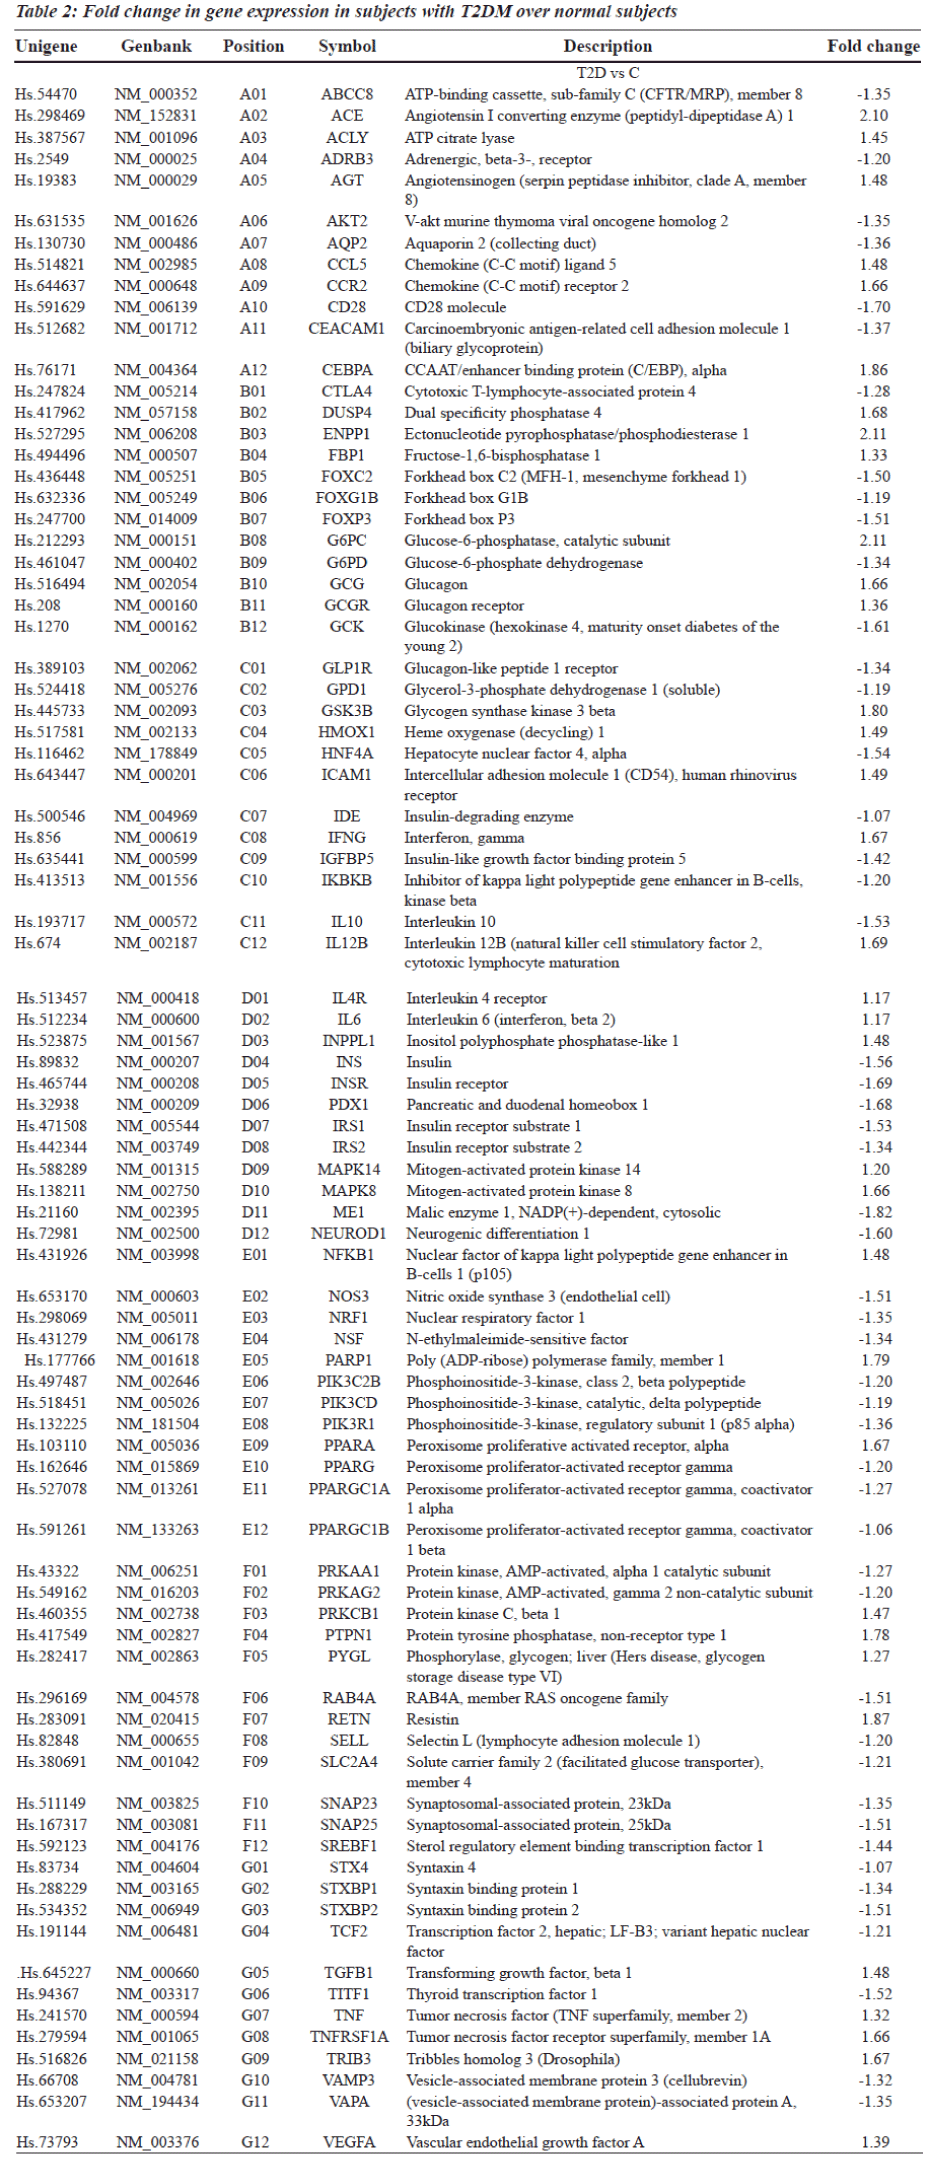
Gene expression profiling is a powerful alternative strategy to test for differences in expression of pre-defined clusters or networks of genes rather than individual genes, thus reducing the number of tested hypotheses. Gene expression analysis using RNA extracted from peripheral blood cells of subjects with T2DM showed significant alterations in the expression of 84 candidate genes (Table 2). For the purpose of analysis, genes were clustered functionally into
1. Receptors, transporters and channels
2. Nuclear receptors
3. Metabolic enzymes
4. Secreted factors
5. Signal Transduction molecules
6. Transcription factors.
It is possible to predict and understand pathological conditions by studying gene expression in blood cells [10,11]. Hence, we used such an approach to delineate similarities and differences in gene expression between normal and type 2 diabetic patients.
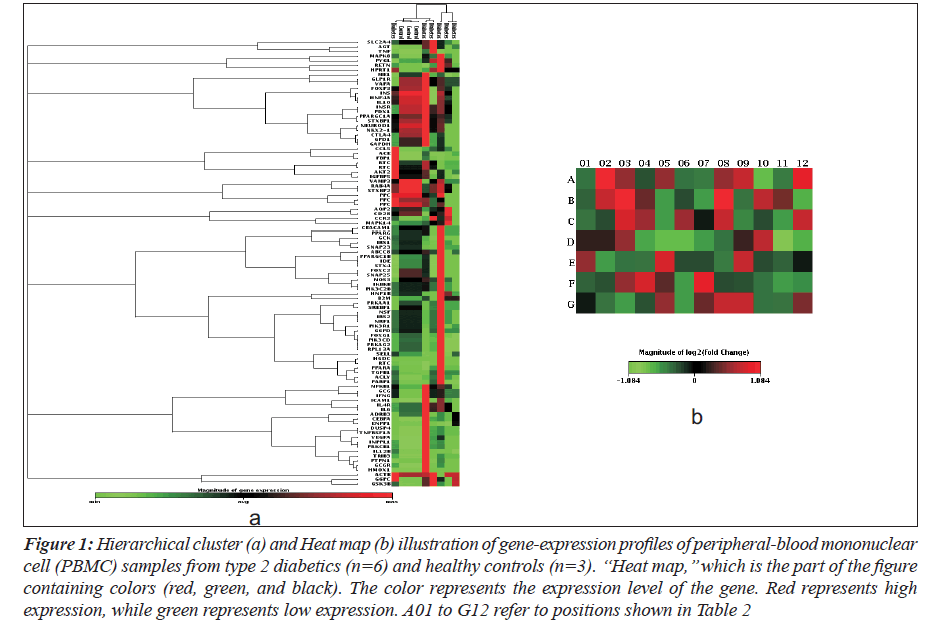
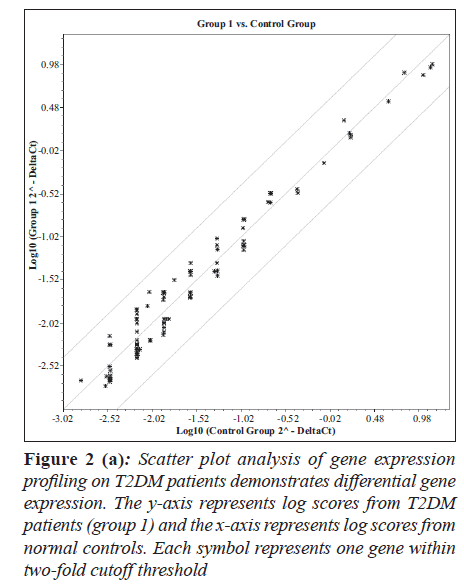
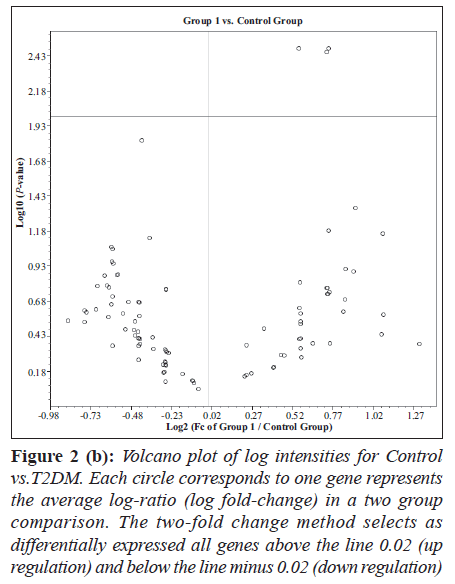
Hierarchical clustering and heat map of the genes significantly regulated in diabetes showed distinct gene clusters that are unique to T2DM (Figure 1a and b). This demonstrates that gene expression signatures in PBMCs could potentially provide a mechanism to distinguish diabetic state from the normal state or to explain the pathophysiology of diabetes. Sixty per cent of significantly altered genes in the diabetic group were down regulated while 40% were up regulated when compared with the non-diabetic groups (Figure 2a and b). This relationship emphasizes how strikingly different the pattern of expression is between these two groups.
Figure 1: Hierarchical cluster (a) and Heat map (b) illustration of gene-expression profiles of peripheral-blood mononuclear cell (PBMC) samples from type 2 diabetics (n=6) and healthy controls (n=3). ‘‘Heat map,’’ which is the part of the figure containing colors (red, green, and black). The color represents the expression level of the gene. Red represents high expression, while green represents low expression. A01 to G12 refer to positions shown in Table 2
Figure 2 (a): Scatter plot analysis of gene expression profiling on T2DM patients demonstrates differential gene expression. The y-axis represents log scores from T2DM patients (group 1) and the x-axis represents log scores from normal controls. Each symbol represents one gene within two-fold cutoff threshold
Figure 2 (b): Volcano plot of log intensities for Control vs.T2DM. Each circle corresponds to one gene represents the average log-ratio (log fold-change) in a two group comparison. The two-fold change method selects as differentially expressed all genes above the line 0.02 (up regulation) and below the line minus 0.02 (down regulation)
We found that distinct pathophysiology of patients with type 2 diabetes was reflected in coordinate alterations in the gene expression levels of pathways involving carbohydrate, lipid and amino acid metabolism, insulin biosynthesis, secretion and its signaling mechanisms in the liver, pancreas, skeletal muscle and adipocytes and its co-factors.
Metabolic homeostasis has long been considered a major component in the pathophysiology of diabetes. In PBMCs, the genes encoding enzymes regulating carbohydrate and fat metabolism showed significant differential expression in diabetes.
This shows that insulin regulation of energy homeostasis in PBMCs is distinctly different from other target tissue such as skeletal muscle and pancreas [12].
Genes encoding metabolic enzymes, receptors, substrates and signaling molecules (ENPP1, IDE, NEUROD1, INSR, ABCC8, IRS1, IRS2, INS, PXD-1, SNARE protein complex) that showed significant differential expression (Table 2) are known to play a role in insulin signaling and homeostasis. Protein kinases such as mitogen activated protein kinases (MAPK) were found to be up regulated and AMP-activated protein kinases (AMPK) were down regulated in T2DM but their association with the pathogenesis of diabetes is unclear.
The liver is regarded as one of the central metabolic organs in the body, regulating and maintaining homeostasis. It performs most of the reactions involved in the synthesis and utilization of glucose. Diabetes results in a decrease in glucose utilization, an increase in glucose production, increased angiogenesis, a reduced stress-defence system, and altered mitochondrial oxidative phosphorylation (OXPHOS) in insulin-dependent tissues such as liver [13,9,14]. A marked increase in the hepatic lipid concentration has been observed during diabetes [15-17]. In contrast, the rate of hepatic lipogenesis and related enzymes is decreased. Decreased glycolysis, impeded glycogenesis and increased gluconeogenesis are some of the changes of glucose metabolism in the diabetic liver [18]. Patti et al. [19] in their study showed decreased expression of PGC1α coupled with reduced expression of NRF1 and PPARγ eventually result in decreased oxidative phosphorylation and lipid oxidation, accumulation of lipid in skeletal muscle and ultimately diabetes. In our studies on PBMCs, NRF1 and PPARγ were down regulated 1.35- and 1.20-fold, respectively.
Immunoregulation plays a significant role in diabetes and its pathogenesis. Enhanced expression and activation of transcription factor, nuclear factor κB and degradation of IκB triggers activation of genes involved in immune responses such as the pro-inflammaory cytokines (IL-4, TNF-α, IFN-γ). IL-4, TNF-α and IFN-γ expression was up regulated in our experiments, an indication of activation of the pathways of inflammation. An imbalance between Th1 and Th2 cells has been shown to results in decreased activity of CD28 and CTLA4-mediated immunosuppressant and activation of macrophage-mediated inflammation involved in the process of β-cell destruction [20]. In PBMC both CD28 and CTL4 are downregulated and may be indicative of similar processes.
In human eosinophils, intracellular signaling molecules ERK, p38 MAPK and c-Jun N-terminal protein kinase (JNK), together with proinflammatory cytokines IL-6, IL-10, chemokines MCP-1/C-C chemokine receptor-2 (CCR2), CXCL9/monokine induced by interferon-γ (MIG), CCL5/regulated upon activation normal T cell expressed and secreted (RANTES) and CXCL10/IFN-γ inducible protein-10 (IP-10) form a network in orchestrating inflammation in diabetes [21,22]. Our results show upregulation of CCL2, CCL5, IL-6 and MAPKs 8 and 14 in diabetes indicating triggering of proinflammatory pathways.
Regulation of cell adhesion molecules plays an important role in vascular complications in T2DM. Intracellular adhesion molecule-1 (ICAM1) is a member of the immunoglobulin super-family of adhesion molecules. This type I membrane protein mediates leukocyte-endothelial cell adhesion and signal transduction, may play a role in the development of atherosclerosis. In the retina, its increased expression contributes to the microcirculation dysfunction by increasing leucocyte adhesion, aggregation and migration in retinal vasculature [23]. In PBMC, ICAM1 expression is markedly elevated and this would enhance leucocyte adhesion. Plasma concentrations of ICAM1, in patients with T2DM are more reflective of hyperglycemia than hyperinsulinemia or insulin resistance [24].
In summary, the current study demonstrates that 84 gene transcripts, involved in a variety of functions, were altered in PBMCs of people with T2DM. Results of this study suggest that there are significant differences in the expression of various genes concerned with carbohydrate, lipid, and protein metabolism, ubiquitin-mediated proteolysis, signal transduction pathways, neuroactive ligand-receptor interaction, cell adhesion molecules, cytokine-cytokine receptor interaction, insulin signaling and immune system pathways, oxidative phosphorylation, and PPAR signaling pathways in subjects with T2DM compared to normal.
These alterations in gene transcripts may represent the response to increased circulating insulin levels necessary to maintain normal glucose levels in these patients. Further, studies on important known and novel targets regulated in T2DM in peripheral blood cells identified in this study will provide new insights in the role of peripheral blood cells in insulin action, insulin resistance and interactions with key target tissues such as skeletal muscle and endocrine pancreas.
References
- Amos AF, McCarty DJ, Zimmet P. The rising global burden of diabetes and its complications: estimates and projections to the year 2010. Diabet Med 1997;14:S1-85.
- Cras-Meneur C, Inoue H, Zhou Y, Ohsugi M, Bernal- Mizrachi E, Pape D, et al. An expression profile of human pancreatic islet mRNAs by Serial Analysis of Gene Expression (SAGE). Diabetologia 2004;47:284-99.
- Haffner SM, Lehto S, Ronnemaa T, Pyorala K, Laakso M. Mortality from coronary heart disease in subjects with type 2 diabetes and in nondiabetic subjects with and without prior myocardial infarction. N Engl J Med 1998;339:229-34.
- Kannel WB, McGee DL. Diabetes and cardiovascular risk factors: the Framingham study. Circulation 1979;59:8-13.
- Rome S, Clement K, Rabasa-Lhoret R, Loizon E, Poitou C, Barsh GS, et al. Microarray profiling of human skeletal muscle reveals that insulin regulates approximately 800 genes during a hyperinsulinemic clamp J Biol Chem 2003;278:18063-8.
- Alberti KG, Zimmet PZ. Definition, diagnosis and classification of diabetes mellitus and its complications. Part 1: diagnosis and classification of diabetes mellitus provisional report of a WHO consultation. Diabet Med 1998;15:539-53.
- Tateno M, Honda M, Kawamura T, Honda H, Kaneko S. Expression profiling of peripheral-blood mononuclear cells from patients with chronic hepatitis C undergoing interferon therapy. J Infect Dis 2007;195:255-67.
- O’Rahilly S, Barroso I, Wareham NJ. Genetic factors in type 2 diabetes: the end of the beginning? Science 2005;307:370-3.
- Misu H, Takamura T, Matsuzawa N, Shimizu A, Ota T, Sakurai M, et al. Genes involved in oxidative phosphorrylation are coordinately upregulated with fasting hyperglycaemia in livers of patients with type 2 diabetes. Diabetologia 2007;50:268-77.
- Sharp FR, Xu H, Lit L, Walker W, Apperson M, Gilbert DL, et al. The future of genomic profiling of neurological diseases using blood. Arch Neurol 2006;63:1529-36.
- Borovecki F, Lovrecic L, Zhou J, Jeong H, Then F, Rosas HD, et al. Genome-wide expression profiling of human blood reveals biomarkers for Huntington’s disease. Proc Natl Acad Sci U S A. 2005;102:11023-8.
- Rao PV, Lu X, Patrick P, Turner M, Suguna N, Srinivasa RN. Gene expression profiles of peripheral blood cells in type 2diabetes and nephropathy in Asian Indians. Genome Biology 2004;5:P9.
- Takamura T, Sakurai M, Ota T, Ando H, Honda M, Kaneko S. Genes for systemic vascular complications are differentially expressed in the livers of type 2 diabetic patients. Diabetologia 2004;47:638-47.
- Seifter S, England S. Energy metabolism. In: Arias IH, Popper D, Schacter, et al. editors. The Liver: Biology and Pathobiology. Raven Press; New York: 1982. p. 219-49.
- Arky RA. Clinical correlates of metabolic derangements of diabetes mellitus. In: Kozak GP, editor. Complications of Diabetes Mellitus. Philadelphia, PA: W.B. Saunders; 1982. p. 16-20.
- Sochor M, Baquer NZ, McLean P. Glucose over- and underutilization in diabetes: comparative studies on the change in activities of enzymes of glucose metabolism in rat kidney and liver. Mol Physiol 1985;7:51–68.
- Greenbaum AL, Gumaa KA, McLean P. The distribution of hepatic metabolites and the control of the pathways of carbohydrate metabolism in animals of different dietary and hormonal status. Arch Biochem Biophys 1971;143:617-63.
- Baquer NZ. Glucose overutilization and underutilization in diabetes and effects of antidiabetic compounds. Ann Real Acad Farm 1998;64:147-80.
- Patti ME, Butte AJ, Crunkhorn S, Cusi K, Berria R, Kashyap S, et al. Coordinated reduction of genes of oxidative metabolism in humans with insulin resistance and diabetes: Potential role of PGC1 and NRF1. Proc Natl Acad Sci U SA 2003;100:8466-71.
- Kaneto H, Matsuoka TA, Katakami N, Kawamori D, Miyatsuka T, Yoshiuchi K, et al. Oxidative stress and the JNK pathway are involved in the development of type 1 and type 2 diabetes. Curr Mol Med 2007;7:674-86.
- Wong CK, Wang CB, Ip WK, Tian YP, Lam CW. Role of p38 MAPK and NF-kB for chemokine release in coculture of human eosinophils and bronchial epithelial cells. Clin Exp Immunol 2005;139:90-100.
- Wong CK, Cheung PF, Ip WK, Lam CW. Interleukin- 25-induced chemokines and interleukin-6 release from eosinophils is mediated by p38 mitogen-activated protein kinase, c-Jun N-terminal kinase, and nuclear factorkappaB. Am J Respir Cell Mol Biol 2005;33:186-94.
- Bai N, Tang S, Ma J, Luo Y, Lin S. Increased expression of intercellular adhesion molecule-1, vascular cellular adhesion molecule-1 and leukocyte common antigen in diabetic rat retina. Yan Ke Xue Bao 2003;19: 176-83.
- Bluher M, Unger R, Rassoul F, Richter V, Paschke R. Relation between glycaemic control, hyperinsulinaemia and plasma concentrations of soluble adhesion molecules in patients with impaired glucose tolerance or Type II diabetes. Diabetologia 2002;45:210-6.
