Research Article - Asian Journal of Biomedical and Pharmaceutical Sciences (2024) Volume 14, Issue 103
Enhancement of solubility of fluvoxamine by solid liquid compacts
Kiran Laxman Biradar1*, Dr. J. Ramesh21Department of pharmaceutics, Osmania University, Hydreabad Telangana, India
2Department of Pharmaceutical, Omega college of pharmacy, Ghatkasar, India
- *Corresponding Author:
- Kiran Laxman Biradar
Department of pharmaceutics
Osmania University
Hydreabad Telangana, India
E-mail: birdark12@gmail.com
Received: 26-Dec-2023, Manuscript No. AABPS-23- 123843; Editor assigned: 29-Dec-2023, PreQC No. AABPS-23-123843(PQ); Reviewed: 12-Jan-2024, QC No. AABPS-23-123843; Revised: 17-Jan-2024, Manuscript No. AABPS-23-123843(R); Published: 23-Jan-2024, DOI:10.35841/aabps-14.103.215
Citation: Biradar LK. Formulation and evaluation of orally disintegrating fluvoxamine tablets. Asian J Biomed Pharm Sci. 2024;14(103):215
Abstract
Fluvoxamine degradation is a current area of focus, and this includes identifying fluids with the potential to improve the drug's solubility and bioavailability. Crospovidone was employed as a centrally soluble substance next to MCC and aerosolas carrier and covering materials in R=2 extent, and direct tension was applied to separate the compacts. We constructed 12 different complexity levels by changing the carrier to covering material and superdisintegrant ratios. Comparative risk assessments between active pharmaceutical ingredients and inactive pharmaceutical ingredients (excipients) revealed no safety concerns. Before and after compression, the limits of the Liquid solid compacts were evaluated, and both were determined to be within acceptable range. The findings of the invitro studies allow us to infer that, when utilizing definition F12, the drug is most effectively delivered within 40 minutes, whereas the great majority of the other techniques require around an hour. It was expected, based on the regressed findings, that F12's top-level definition would be comparable to First's in terms of energy.
Keywords
Aerosol, Multicomponent chloroform, Crospovidone, Fourier transform infrared, and Fluvoxamine are some of the terms used in this article.
Aim and Objective
Fluvoxamine dissolution rate is being modeled continuously utilizing liquid strength regions. In the same manner that a suspension, a smooth liquid treatment, or a response of water-insoluble particles may be turned into a powder that streams well and packs well, so can most other pharmaceuticals. In order to create a dry-design, nonadherent, free-streaming, compressible powder, a liquid prescription is mixed with a powder excipient, also known as a carrier substance.
PEG400, a nonvolatile dissolvable, was employed in an ice/splash/carrier/covering material configuration to generate a liquid strength region with a R=2 extent.
Objectivesof thestudy
The efficacy and safety of fluvoxamine in suspension form have been assessed. Examine the changes in state of liquid solids after being compressed.
There's a need for this study so that we can: Select the best possible carrier in terms of liquid's coverage area and strength areas.
To ensure that your fluvoxamine oral capsules dissolve quickly, it is important that you use the correct superdisintegrant core.
Research on the release of liquid and solid drugs should be summarized.
Materials and Methods
Methodology
Preformulation studies
Solubility studies of pure drug
In order to determine which delivery systems would work, dissolvability experiments were conducted. Five milliliters of a variety of solvents were added to glass test tubes with covers and used to dilute the surplus medicine. All packaging was sealed with cellophane films and lids to avoid leaks and spills during the 24-hour shake in 37°C water. Once equilibrium was reached, the models were centrifuged in a Hermle Z 200 A (Germany) for 5 minutes at 3000 rpm. A 0.45-meter-wide film tube was used to drain the supernatant. UV spectrophotometer (PG Instruments, T60) readings were taken at 271 nm from a 1 ml sample of the flooded plan using the required solvents [1].
IR Spectra
IR Spectra without Prescription Fluvoxamine and excipients were compressed into a 1:1 ratio in potassium bromide pellets using a separation speed in the range of 400 to 4000 cm1.
Determination of UV spectrum of Fluvoxamine
Dissolving 10 mg of fluvoxamine in 3 ml of methanol, and then filling the remaining 7 ml with cushion, yields a 1000 g/ml fixation stock. This setup was reduced from 100g/ml (SS-II) to 10g/ml (SS-I) by increasing the volume from 1 ml to 10 ml. After adjusting the concentration by adding water till the final amount was 10 ml, the UV spectroscopic analysis was performed between 200 and 400 nm.
Preparation of Standard Calibration Curve for using 6.8pH buffer
To accurately dose out 10 milligrams of medication, we utilized a volumetric carafe that held 10 milliliters. By reducing the volume using a support that has a pH of 6.8, we were able to achieve a concentration of 1000 g/ml. This solution was concentrated to 100 g/ml by placing 1 ml in a 10 ml volumetric cup and adding distilled water until the concentration read 100 g/ml. The concentrations of 2 g/ml, 4 g/ml, 6 g/ml, 8 g/ml, 10 g/ml, and 12 g/ml were all achieved by pipetting out 0.2 ml, 0.4 ml, 1 ml, 1.2 ml, and up to 10 ml of a 6.8pH buffer. A UV Spectrophotometer was used with a clear at 271 nm to determine the absorbance of this scheme.
Preparation of liquid-solid compacts
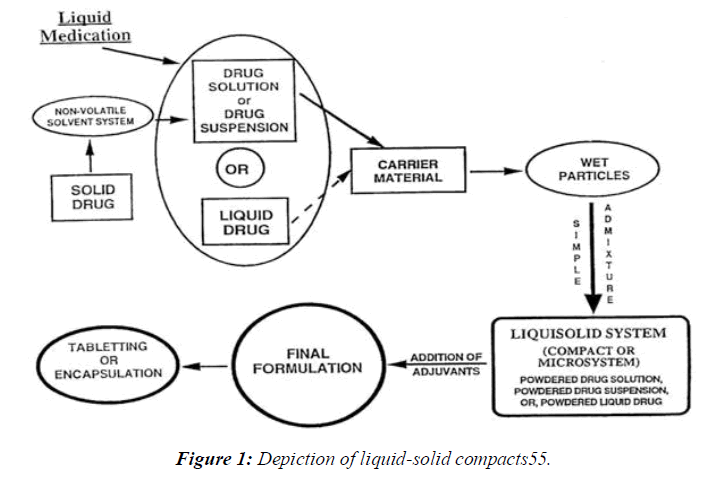
The general method of preparation of liquid-solid
Nonvolatile dissolvable plan (Stake 400) was first used to deliver a medicine that was mistakenly believed to be transported by liquid.
Second, the preceding liquid was successfully mixed with a carrier or other polymers and excipients using a mortar. These carriers and excipients work together to counteract the harmful effects of stress and motion.
Third, the equal mix is crushed in a mortar for 10-20 minutes with a disintegrant and a few additional compounds formed by their varied uses.
The tableting machine was used to compress the finished mixture into tablets. Specifically, show how the granules dissolve in the liquid, how they break down in the liquid, how they flow, and how they behave under strain. (Figure 1)
Calculation of load factor:
The mathematical model has the potential to enhance liquid-solid structures. Stake 400 (a liquid vehicle), Avicel PH 102 (microcrystalline cellulose), and Aerosil 200 (a covering) were used in this experiment. The pharmacological hub of the liquid vehicle was adjusted, but the carrier: covering extent (R=1:1&1:3) was left unaltered in order to put these tactics into action [2, 3]. Using the ''new itemizing mathematical model of zones of strength for liqui,'' the quantity of each excipient required to construct a liquid solid system with optimum flowability and compressibility was calculated. For this mathematical model to work, the component powders (transporter and covering materials) have to have a certain flowable fluid maintenance potential (- respect) and compressible liquid support potential (- number). Logic suggests that, at present, it is feasible to control just certain liquid percentages in the transporter and covering powder materials while still being aware of appropriate stream and strain quality. Where R=Q/q... (1) R is the difference between Q, the total weight of the arrangement, and q, the total weight of the covering, where Q is the total weight of the arrangement and q is the total weight of the covering. The liquid weight factor (Lf) is the ratio of the mass of the liquid remedy (W) to the mass of the carrier powder (Q) in the system, and it is necessary for the preparation of a liquid solid structure that streams and packs well without outperforming a particular most outrageous liquid on the carrier material. Lf=W/Q is correct. The Lf of definitions are linked as follows because Spireas et al. drew their projected part aggregates using the Flowable liquid maintenance prospects (- values) of powder excipients [4].
The carrying capacity and liquid-maintenance capabilities of the covering and supporting material, respectively. Lf = + (1/R). Since and are constants and the expected concentration of the excipients is based on the quantity of carrier/coat materials (R), the direct relationship between Lf and 1/R was first calculated using Eq. (3). Once the concentration of the liquid transport medium is known, the pharmaceutical stacking strategy (W) may be determined. To transform a given volume of liquid medicine into a suitable streaming and compressible liquid solid structure, one has to know Lf and W in order to determine the quantity of transporter (Qo) and covering (qo) powder required [5].
Flow properties
Due to the powder's poor flowability, a strong feed and repeated filling of tablet kicks the container are required if critical component changes occur during the collection of pharmaceutical portion structures. Using evaluations of the site of rest, the Carr's record, and the Hausner's extents, we were able to ensure the stream characteristics of the liquid solid structures chosen for compacting into tablets and further study.
Angle of repose
The residual powder combination was sent through the channels for further processing. The powder combination was put to the ultimate test in the conduit. The peak of the powder mixture was no longer in line with the channel's end because the channel's height had been changed. A portion of the powder mixture should be dumped onto the counter once the line is broken [6, 7]. Using the powder cone's calculated diameter and its smooth motion, we may have identified its ultimate resting place.
tan-1= h/r
The powder cone's height (h) and length (r) are each measured in centimeters.
Bulk density
The thickness was calculated arbitrarily and by tapping, which is reflected in the use of LBD and yet to be determined. Each batch's powder combination (2 gm total) was placed into a 10 ml measuring chamber and shaken to break up any clumps. The chamber was dropped from a height of 2.5 cm onto a hard surface at a continuous rate of one per second after the starting volume was measured. The tapping went on for so long that at this point, there probably isn't even a difference anymore. The formulae for LBD and TDB were used to get their values.
Powder Yield vs. Wasted Weight = LBD. Powder Mix Weight / Tapped Pressing Volume = Unknown Pressing Volume
Compaction: A Descriptive Account
The powder mixture's Compressibility Document was finalized with the help of Carr's numbers. The LBD and squeeze rate of a powder may be determined analytically. Let's take a look at where Carr's Record now stands:
Carr's Index (%) = [(TBD-LBD) x100]/TBD
Hausner’s Ratio
The formula for determining Hausner's ratio is as follows:
Hausner's ratio = Tapped density / Bulk density. (Table 1)
| Ingredients | Formulation code | ||||||||||||
|---|---|---|---|---|---|---|---|---|---|---|---|---|---|
| F1 | F2 | F3 | F4 | F5 | F6 | F7 | F8 | F9 | F10 | F11 | F12 | ||
| Fluvoxamine | 100 | 100 | 100 | 100 | 100 | 100 | 100 | 100 | 100 | 100 | 100 | 100 | |
| MCC | 433 | 425 | 417 | 409 | 433 | 425 | 417 | 409 | 433 | 425 | 417 | 409 | |
| Aerosil | 45 | 45 | 45 | 45 | 45 | 45 | 45 | 45 | 45 | 45 | 45 | 45 | |
| SSG | 8 | 16 | 24 | 32 | -- | -- | -- | -- | -- | -- | -- | -- | |
| CCS | -- | -- | -- | -- | 8 | 16 | 24 | 32 | -- | -- | -- | -- | |
| Crospovidone | -- | -- | -- | -- | -- | -- | -- | -- | 8 | 16 | 24 | 32 | |
| Mg.sterate | 7 | 7 | 7 | 7 | 7 | 7 | 7 | 7 | 7 | 7 | 7 | 7 | |
| Talc | 7 | 7 | 7 | 7 | 7 | 7 | 7 | 7 | 7 | 7 | 7 | 7 | |
| Total | 600 | 600 | 600 | 600 | 600 | 600 | 600 | 600 | 600 | 600 | 600 | 600 | |
Table 1: Formulation of Fluvoxamine Hydrochloride Based LiquisolidTablets (R=2)
Post compression parameters:
Weight variation Test
The test was driven according to USP by weighing 20 tablets one by one on an electric balance, processing the typical, and checking the results out.
Friability Test
Evaluation was done utilizing the Roche friability test. After 100 rotations, the gadget was turning at a pace of 25 times per second. The following formula was used to ascertain the crispiness.
%F = 100(1-W0/W)
Tablet Weight at Time Zero = W0
Hardness
The tablet's hardness indicates its resilience to sudden impacts. A Monsanto hardness analyzer was used to ascertain the tablet's level of abrasiveness. The unit of measure is kg/cm2. The tablets' levels of randomness were picked at random, without any specific goal in mind.
Drug content estimation
After being dissolved in methanol, each arrangement was then weakened in a 6.8-pH phosphate support. UV-visible spectrophotometer readings for fluvoxamine were not consistently maintained at 271 nm.
In-vitro Drug Release Study
We used a USP II device (LAB INDIA DS8000) to create a malfunctioning environment. Phosphate support at pH 6.8 and 37.5 degrees Celsius was used as the solubilization medium (900 ml).A gadget with a paddle that revolved 50 times per second dissolved a batch of Fluvoxamine Tablets. Five-milliliter samples were analyzed at 271 nm using the Shimadzu 1700 UV-perceptible spectrophotometer, and the results were discarded and a new set of processes applied at regular intervals. We iterated each change multiple times to ensure a reliable median [8, 9].
Release kinetics:
As part of a comprehensive analysis, the efficacy of Fluvoxamine tablet administration was determined by adjusting in vitro release data to various situations and dynamic models. In addition to the no-demand scenario, we also included the first-demand dynamic model.
Zero-order model
Qt = Q0 + K0t describes the rate of drug release from sustained release segment structures.
Qt is the amount of drug isolated at time t, and K0 is the constant for zero-request release, represented as a concentration per unit time. In the beginning of a process, the dosage fraction is denoted by Q0 (occasionally Q0 = 0). In in vitro drug release tests, the transport energy was studied by plotting the total quantity of medicine carried against time.
First Order Model
In structures with a central decay rate, the major solicitation condition is what ultimately decides how long transports take.
The following example shows how a car might act in a typical first-contact solicitation situation:
The logarithm may be found at: For the logarithmic form, see: Log C = Log Co kt
We use the initial solicitation rate consistent k as the baseline measure of medication separation at time t=0 instead of Co.When the logarithm of the cumulative rate of extra medication is plotted against time, a straight line is formed.A slow release of the drugs is envisioned in portion structures that follow this crumbling profile, such as those containing water-soluble prescriptions in permeable cross sections. The rate of delivery decreases as the amount of medicine held in the portion structure decreases [10].
Results and Discussion
Pre formulation studies
Saturation Solubility
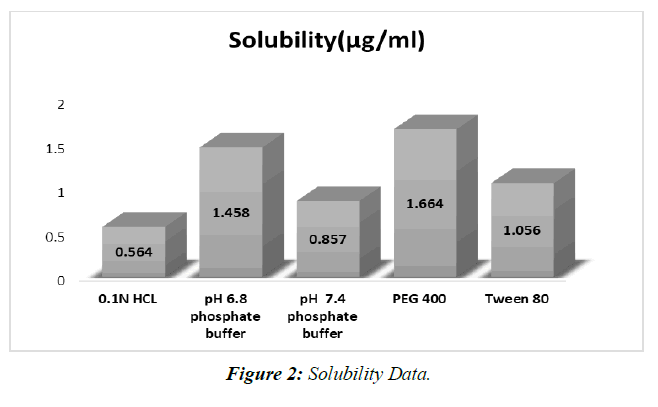
Saturation solubility was achieved at 250 degrees Celsius using 0.1N HCL, 6.8 phosphate buffer, Propylene glycol, Polyethylene glycol 400, and Tween 80. (Table 2, Figure 2).
| Media | Solubility(µg/ml) |
|---|---|
| 0.1N HCL | 0.564 |
| pH 6.8 phosphate buffer | 1.458 |
| pH 7.4 phosphate buffer | 0.857 |
| PEG 400 | 1.664 |
| Tween 80 | 1.056 |
Table 2: Solubility data
Examinations of dissolvability in different backings have shown that a phosphate pad with a pH of 6.8 is awesome. Deterioration is achieved in a pH 6.8 support.
Determination of absorption maximum (λmax)
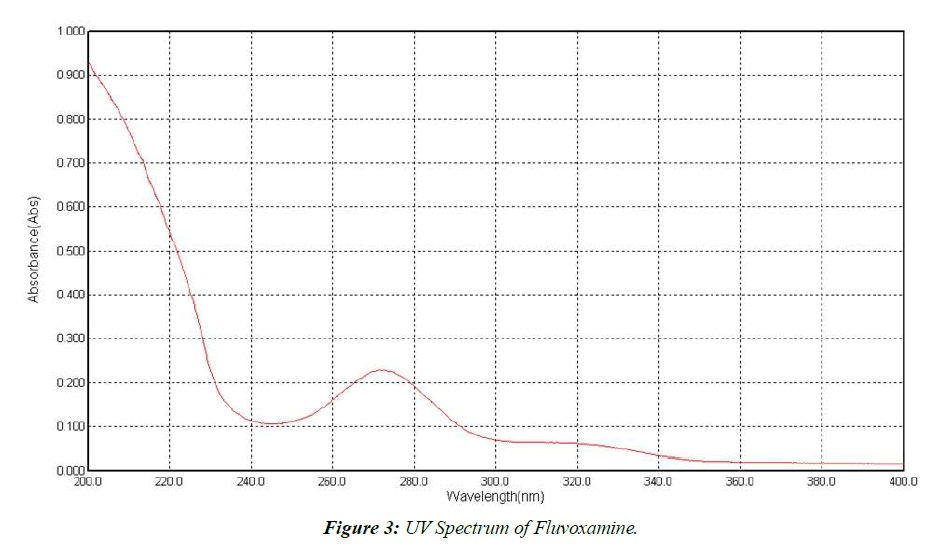
Fluvoxamine maximum concentrations were determined in a 6.8-pH buffer solution. (Figure 3).
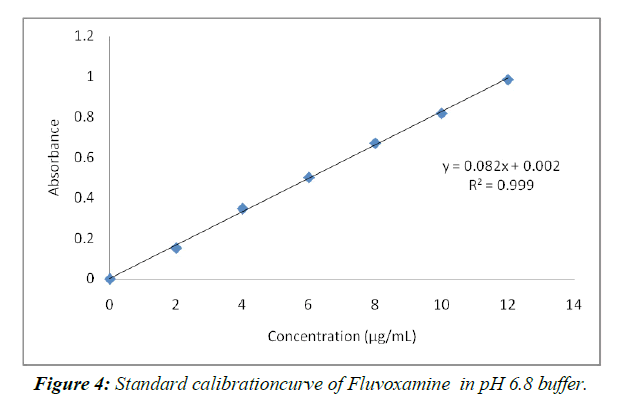
Calibration curve of Fluvoxamine in 6.8pH buffer (Table 3 Figure 4)
| Concentration (µg/mL) | Absorbance |
|---|---|
| 0 | 0 |
| 2 | 0.153 |
| 4 | 0.348 |
| 6 | 0.502 |
| 8 | 0.672 |
| 10 | 0.819 |
| 12 | 0.986 |
Table 3: Standard graph ofFluvoxamine in pH 6.8(λmax271 nm)
The not altogether settled to be there of psyche of 2-12 µg/ml in pH 6.8 help. The system changed in accordance with Ale lamberts' norm, as shown by the way that the backslide result was more similar to 1.
Drug excipient compatibility
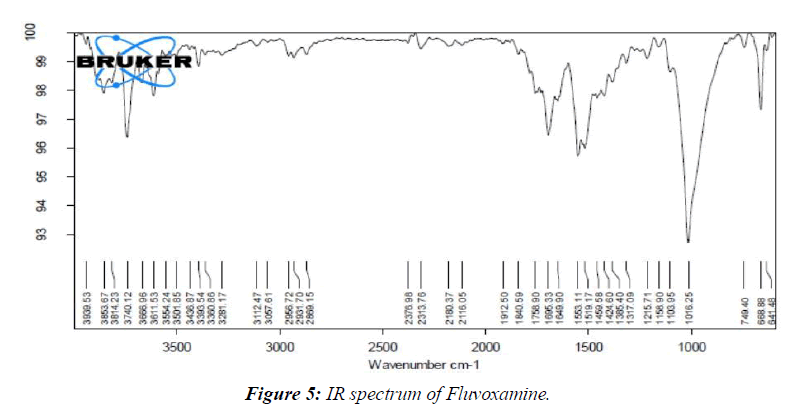
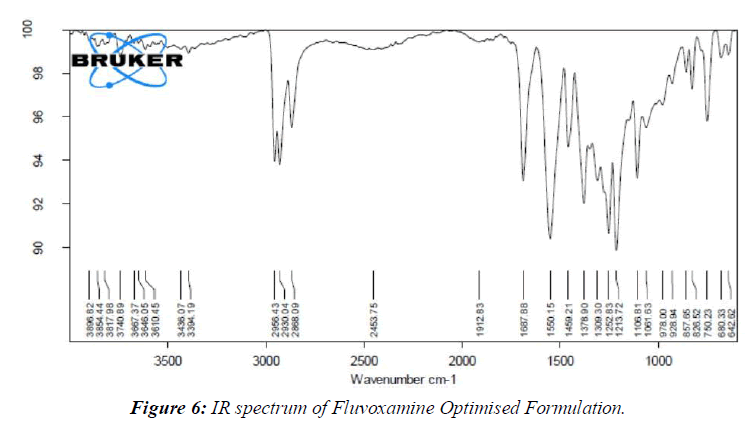
By comparing the spectra of the pure medication utilized in the FT-IR analysis with those of the various excipients used in the definition, the similarity between the drug and the excipient was affirmed. (Figure 5, 6)
Research on medication excipient comparability has led us to the conclusion that there are no meaningful differences between the pure medicine (Fluvoxamine) and the optimal arrangement (Fluvoxamine + excipients).
Precompression parameters of all the Fluvoxamine liqui solid comapcts Formulations (Table 4)
| Formulation code | Angle of repose (θ) | Bulk density (gm/ml) | Tapped density (gm/ml) | Carr’s index (%) | Hausner’s ratio |
|---|---|---|---|---|---|
| F1 | 26.84 | 0.447 | 0.538 | 13.01 | 1.18 |
| F2 | 28.24 | 0.458 | 0.574 | 11.81 | 1.15 |
| F3 | 25.36 | 0.469 | 0.535 | 12.99 | 1.19 |
| F4 | 26.18 | 0.461 | 0.569 | 15.29 | 1.17 |
| F5 | 28.15 | 0.495 | 0.554 | 10.11 | 1.15 |
| F6 | 27.78 | 0.454 | 0.562 | 18.33 | 1.20 |
| F7 | 29.16 | 0.462 | 0.559 | 17.35 | 1.21 |
| F8 | 27.46 | 0.481 | 0.574 | 16.20 | 1.18 |
| F9 | 29.32 | 0.459 | 0.529 | 13.23 | 1.17 |
| F10 | 28.47 | 0.468 | 0.537 | 15.75 | 1.18 |
| F11 | 29.68 | 0.476 | 0.547 | 14.68 | 1.21 |
| F12 | 29.57 | 0.495 | 0.568 | 14.68 | 1.18 |
Table 4: Flow Properties of Tablet Blend
The pharmaceutical industry is expected to benefit greatly from the stream feature due to the possibility that the irregular water flow would increase tablet weight change. When analyzing stream characteristics, values of Carr's Record (Compressibility) around 15% are excellent, whereas values over 25% reflect discouraging stream patterns. Compressibility values for the particles were determined to be less than 25%, indicating the presence of smooth stream features [11,12].
Places to rest may be found at angles ranging from 0 degrees (no stream) to 40 degrees (superb stream). However, the powder becomes very sticky and unmanageable as the temperature rises beyond 50 degrees. The error rate for repeated evaluations of the safe haven is typically approximately 2%. These techniques allow for the rapid identification of large-scale variations in particle size distribution and moisture content from batch to batch.
Amazingly low stream temperatures were achieved by cooling powders to between 250 and 290 degrees. Since powders are stored at temperatures below 40 degrees, they maintain a good reputation in the stream.
Post compression parameters (Table 5)
| Formulation code | Weight variation (%) | Hardness (kg/cm2) | Fraibility (%) | Thickness (mm) | % Drug content |
|---|---|---|---|---|---|
| F1 | 602.4 | 3.56±0.02 | 0.22±0.09 | 3.96±0.02 | 96.15±0.16 |
| F2 | 601.8 | 3.42±0.09 | 0.47±0.22 | 3.85±0.01 | 98.06±0.52 |
| F3 | 598.7 | 3.29±0.06 | 0.49±0.61 | 4.02±0.06 | 95.35±0.97 |
| F4 | 604.8 | 4.02±0.12 | 0.82±0.16 | 4.01±0.03 | 96.48±0.56 |
| F5 | 600.8 | 3.98±0.43 | 0.65±0.45 | 3.98±0.06 | 99.89±0.29 |
| F6 | 601.5 | 3.78±0.02 | 0.32±0.02 | 3.99±0.09 | 99.45±0.36 |
| F7 | 602.4 | 4.21±0.14 | 0.54±0.24 | 4.08±0.04 | 98.16±0.21 |
| F8 | 597.5 | 4.05±0.09 | 0.41±0.18 | 3.94±0.08 | 97.42±0.85 |
| F9 | 601.8 | 3.68±0.05 | 0.78±0.06 | 3.99±0.05 | 94.46±0.46 |
| F10 | 602.5 | 3.74±0.12 | 0.68±0.09 | 4.25±0.24 | 97.84±0.28 |
| F11 | 601.8 | 3.84±0.19 | 0.53±0.12 | 3.72±0.19 | 96.58±0.34 |
| F12 | 600.1 | 3.96±0.08 | 0.76±0.04 | 3.65±0.29 | 98.67±0.25 |
Table 5: Evaluation studies
Examining the fluvoxamine pills, I found that they were consistent in size and shape. Fluvoxamine tablet evaluations showed a hardness range of 3.290.06-4.210.14kg/cm2.
The standard deviation statistics for both thickness and weight were judged to be quite small, suggesting a very high degree of consistency. It was decided that the tablets will be between 3.85 and 4.08 mm thick when finished. Friability levels below 1% show appropriate mechanical strength to push through the pressures of handling and travel [13].
Fluvoxamine pill potency remains stable over time. Fluvoxamine tablets with standard deviation and coefficient of variation (2) values near to zero have a drug content on average between 96.150.16 and 99.890.29%, indicating that the prescription is being followed extremely carefully throughout manufacturing.
In vitro Dissolution studies (Table 6)
| Time (mins) | F1 | F2 | F3 | F4 | F5 | F6 | F7 | F8 | F9 | F10 | F11 | F12 |
|---|---|---|---|---|---|---|---|---|---|---|---|---|
| 0 | 0 | 0 | 0 | 0 | 0 | 0 | 0 | 0 | 0 | 0 | 0 | 0 |
| 5 | 19.47 ±0.65 | 26.24 ±0.47 | 31.49 ±0.46 | 39.27 ±0.15 | 28.47 ±0.42 | 35.25 ±0.16 | 46.74 ±0.15 | 52.16 ±0.26 | 41.85 ±0.26 | 45.21 ±0.25 | 49.16 ±0.24 | 54.32 ±0.18 |
| 10 | 26.78 ±0.59 | 38.85 ±0.57 | 44.52 ±0.21 | 47.51 ±0.23 | 37.25 ±0.36 | 47.84 ±0.24 | 53.26 ±0.20 | 68.36 ±0.41 | 48.36 ±0.18 | 54.19 ±0.26 | 59.36 ±0.29 | 68.15 ±0.19 |
| 15 | 34.16 ±0.42 | 45.45 ±0.24 | 53.02 ±0.74 | 55.47 ±0.42 | 48.48 ±0.12 | 58.39 ±0.36 | 62.25 ±0.63 | 75.46 ±0.52 | 56.75 ±0.27 | 63.04 ±0.47 | 69.49 ±0.38 | 77.63 ±0.42 |
| 20 | 43.42 ±0.28 | 52.15 ±0.19 | 61.36 ±0.84 | 67.65 ±0.42 | 56.34 ±0.82 | 65.64 ±0.15 | 69.41 ±0.25 | 80.15 ±0.63 | 61.85 ±0.36 | 72.45 ±0.28 | 75.62 ±0.74 | 85.63 ±0.29 |
| 30 | 58.21 ±0.19 | 67.54 ±0.75 | 69.78 ±0.75 | 73.84 ±0.18 | 67.69 ±0.31 | 73.28 ±0.25 | 70.65 ±0.59 | 87.46 ±0.15 | 69.23 ±0.35 | 79.36 ±0.36 | 83.41 ±0.29 | 93.24 ±0.37 |
| 40 | 69.68 ±0.24 | 72.24 ±0.68 | 73.41 ±0.19 | 81.24 ±0.56 | 78.24 ±0.02 | 78.47 ±0.85 | 79.25 ±0.63 | 92.53 ±0.02 | 78.35 ±0.64 | 84.32 ±0.74 | 93.35 ±0.19 | 98.32 ±0.46 |
| 50 | 75.34 ±0.68 | 79.19 ±0.54 | 81.34 ±0.24 | 89.47 ±0.02 | 85.39 ±0.63 | 83.16 ±0.96 | 86.48 ±0.42 | 98.25 ±0.63 | 85.32 ±0.48 | 89.32 ±0.38 | 98.24 ±0.28 | |
| 60 | 86.18 ±0.47 | 88.75 ±0.48 | 90.49 ±0.41 | 95.62 ±0.35 | 93.61 ±0.10 | 95.24 ±0.31 | 96.36 ±0.15 | 94.49 ±0.75 | 96.47 ±0.26 |
Table 6: In-vitro drugrelease data of formulation F1 to F12
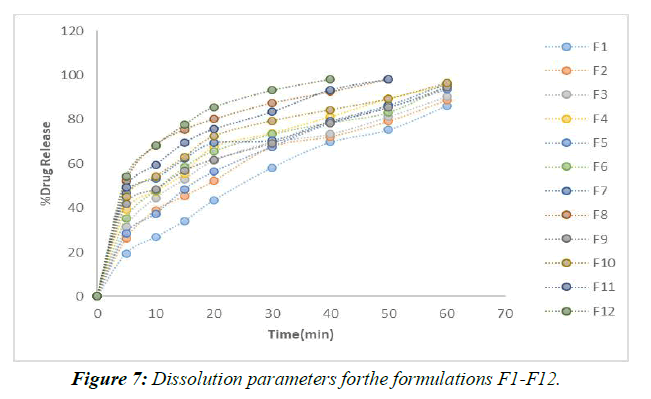
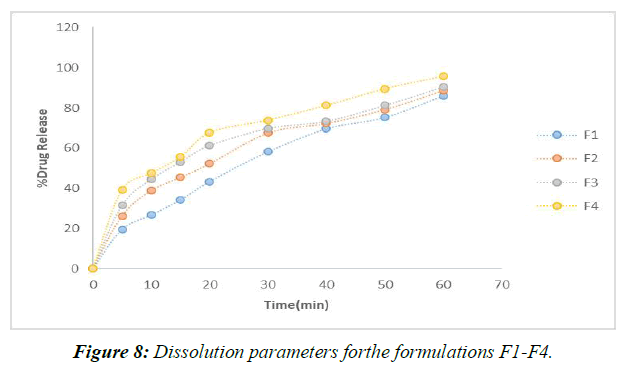
For the in vitro release tests, 900 mL of dissolving media was used along with a pH 6.8 buffer and a paddle stirrer set to 50 revolutions per minute (rpm). The profiles and in vitro information for the individualized nuances are presented. (Figure 7,8)
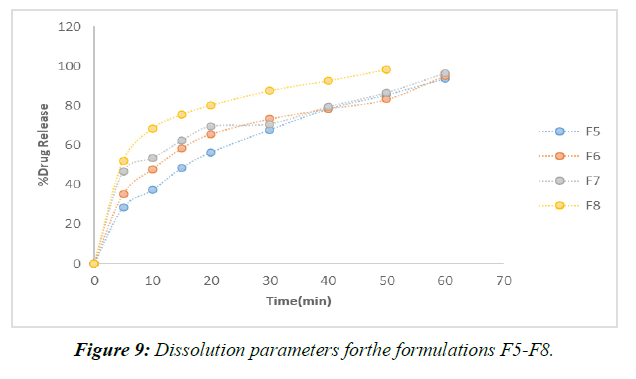
According to the results of the recently cited in vitro drug release studies, plan F1, which involves SSG as a super disintegrant, has been found to show 65.28 percent drug release close to the completion of 60 minutes. Definitions F2-F4 were entirely prepared by using SSG as a super disintegrant at extents ranging from 2%-8% of the rigid tablet weight. In under 60 minutes, the F4 approach has shared the great bulk of the solution. (Figure 9)
Formulations F9–F12 all made use of the super disintegrant crospovidone, with the 8% crospovidone formulation in F12 showing the maximum drug release after 40 minutes.
When compared to more subtle strategies (F1 to F9), F12's application of 8% Crospovidone provides the most evident solution in the shortest period (40 minutes). When more super disintegrant centers are created, drug release times decrease. After analyzing the results of the dissolving primers, it was determined that the F12 configuration was the most effective [14,15].
The release energy from the F12 prescription was dissipated in this manner.
Drug release kinetics studies: Best formulation F12
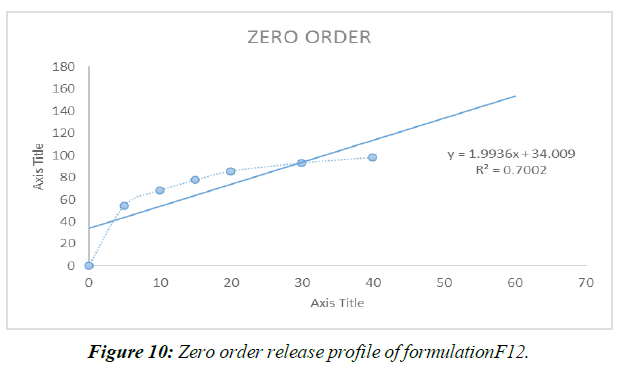
Liquisolid fluvoxamine compacts were put through a quick backslide evaluation that accounted for both zero and initial solicitation energy and the different states of prescription conveyance to assess its applicability in vitro. The best enumerating (F9) may be utilized to determine the backslide coefficients from the straight backslide analysis of zero-demand release energy that was before described.
Zero Order Release Kinetics (Figure 10)
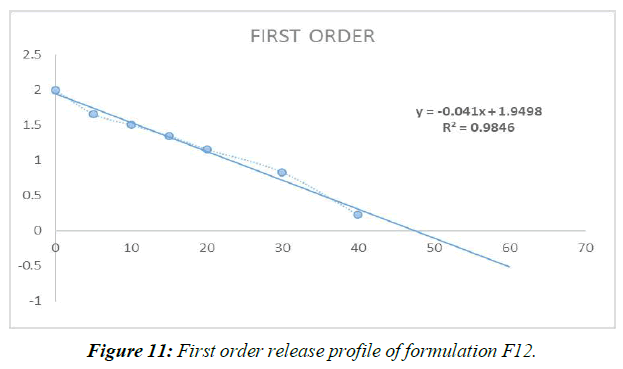
First Order Release Kinetics (Figure 11, Table 7)
| ORDE OF KINETICS | ZERO ORDER | FIRST ORDER |
|---|---|---|
| REGRESSION (R) | 0.700 | 0.984 |
Table 7: Kinetic data of the formulation F9
Different mathematical circumstances, including no solicitation, beginning solicitation, and condition processes, were modeled to predict the release of prescriptions from Liquisolid compacts. Data from the last slide show showed that Item F12, the best of the bunch, possessed First-demand energy .
Summary and Conclusion
Fluvoxamine treatment for despair. Due to its high susceptibility, limited water solubility, and 53% oral bioavailability, this SSRI (specific serotonin reuptake inhibitor) is also a partial serotonin receptor agonist. Because of this, liquisolids have been the subject of much study and development in an effort to boost their solubility and oral bioavailability.
Crospovidone was employed in the most recent research to administer fluvoxamine liquisolid compacts. Studies of Fluvoxamine's solubility in a small number of nonvolatile solvents led to the selection of Crospovidone.
To separate fluvoxamine fixations, spectrophotometry was performed at a repetition of 271 nm. Liquid solid compacts were tested for things like homogeneity of drug content, in-vitro release, and drugexcipientinteractions (FTIR) before and after they were made.
The results of an inundation dissolvability test performed at 250 degrees Celsius with 0.1N HCL, 6.8 phosphate support, 7.4pH pad, and tween 80 demonstrate that the 6.8 phosphate support is more dissolvable than other pads.
The results of the pharmaceutical excipient similarity assessments suggest that the purified prescription and the best-defined formulation of Fluvoxamine are clinically indistinguishable.
The medication concentration of the produced fluvoxamine liquid solid compacts ranged from 96.150.16 to 99.890.29%.
According to the in vitro tests, the F12 specification led to the shortest medication release time, with a 98.320.46% yield in less than 40 minutes.
Models were developed for distributing prescriptions from the F12 list, which includes gCrospovidone, utilizing zero solicitation, initial solicitation, and conditional methods. First-demand energy was shown for the enhanced counting algorithm F12 when backslide data was taken into account.
From the present study, the following conclusions can be drawn
All of the fabricated, non-settled samples had a drug content of between 95.35 and 99.89%.
• The release rate of the drug may be sped up by elongating the super disintegrant core.
• The pharmaceutical sector as a whole isn't cooperating to develop a cure for anything, as shown by IR spectroscopy experiments.
• After 40 minutes, the F12 formulation of a therapy containing crospovidone showed the most significant drug release (98.320.46%).
• First-demand dispersion in energy transfer was seen in the densestly packed Liquisolids.
• To a R=2 degree, crospovidone was able to reduce the fluvoxamine concentration in the liquid solid.
• The drug concentration of the synthetic, unresolved samples ranged from 95.35 percent to 99.89 percent.
• The release rate of the medicine may be sped up by elongating the super disintegrant core.
• IR spectroscopy research shows that the pharmaceutical industry as a whole isn't working together to find a cure for anything.
• The F12 formulation of a crospovidone-based treatment demonstrated the highest drug release (98.320.46%) after 40 minutes.
The most densely packed Liquisolids exhibited first-demand dispersion in energy transmission.
References
- Dehghan MH, Jafar M. Improving dissolution of meloxicam using solid dispersions. Iran J Pharm Res. 2006;5(4):231-8.
- Jafar M, Mhg D, Shareef A. Enhancement of dissolution and anti-inflammatory effect of meloxicam using solid dispersions. Int. J. Appl. Pharm. 2010;2(1):22-7.
- Nokhodchi A, Javadzadeh Y, Siahi-Shadbad MR, et al. The effect of type and concentration of vehicles on the dissolution rate of a poorly soluble drug (indomethacin) from liquisolid compacts. J Pharm Pharm Sci. 2005;8(1):18-25.
- Gursoy RN, Benita S. Self-emulsifying drug delivery systems (SEDDS) for improved oral delivery of lipophilic drugs. Biomed Pharmacother. 2004;58(3):173-82.
- Kapsi SG, Ayres JW. Processing factors in development of solid solution formulation of itraconazole for enhancement of drug dissolution and bioavailability. Int J Pharm. 2001;229(1-2):193-203.
- Prouse PJ, Bevis PJ, Bluhmki E, et al. Evaluation of the safety, tolerability, and efficacy of meloxicam tablets in patients with osteoarthritis. Clin. Ther. 1996;18(3):429-39.
- Spireas S, Bolton SM, Assignee, et al. Liquisolid systems and methods of preparing same. Patent. 1999.
- Shinkar DM, Khatik AS, Saudagar RB. Liquisolid technology: A review. Asian J. Pharm. Sci.. 2016;6(3):161-6.
- Karmarkar A, Gonjari I, Hosman A, et al. Liquisolid tablets: a novel approach for drug delivery. Int. J. Health Res. 2009;2(1).
- Tong Y, Wang Y, Yang M, et al. Systematic development of self-nanoemulsifying liquisolid tablets to improve the dissolution and oral bioavailability of an oily drug, vitamin K1. Pharmaceutics. 2018;10(3):96.
- Matsui K, Tsume Y, Amidon GE, et al. The evaluation of in vitro drug dissolution of commercially available oral dosage forms for itraconazole in gastrointestinal simulator with biorelevant media. J. Pharm. Sci. 2016;105(9):2804-14.
- Lu M, Xing H, Jiang J, et al. Liquisolid technique and its applications in pharmaceutics. Asian J. Pharm. Sci. 2017;12(2):115-23.
- Kavitha K, Lova Raju KN, Ganesh NS, et al. Effect of dissolution rate by liquisolid compact approach: an overview. Der Pharmacia Lettre. 2011;3(1):71-83.
- Spireas S, Sadu S. Enhancement of prednisolone dissolution properties using liquisolid compacts. Int. J. Pharm. 1998;166(2):177-88.
- Pouton CW. Formulation of poorly water-soluble drugs for oral administration: Physicochemical and physiological issues and the lipid formulation classification system. Eur J Pharm Biopharm. 2006;29(3-4):278-87.
Indexed at, Google Scholar, Cross Ref
Indexed at, Google Scholar, Cross Ref
Indexed at, Google Scholar, Cross Ref
Indexed at, Google Scholar, Cross Ref
Indexed at, Google Scholar, Cross Ref
Indexed at, Google Scholar, Cross Ref
Indexed at, Google Scholar, Cross Ref
Indexed at, Google Scholar, Cross Ref
Indexed at, Google Scholar, Cross Ref
Indexed at, Google Scholar, Cross Ref
