Research Article - Biomedical Research (2016) Volume 27, Issue 4
Finite element modeling and analysis in locomotion system of ostrich (Struthio camelus) foot
Rui Zhang*, Haitao Wang, Guiyin Zeng and Jianqiao Li
Key Laboratory of Bionic Engineering, Ministry of Education, Department of Biological and Agricultural Engineering, Jilin University, Changchun, P.R. China
- *Corresponding Author:
- Rui Zhang
Key Laboratory of Bionic Engineering
Ministry of Education
Department of Biological and Agricultural Engineering
Jilin University
PR China
Accepted date: April 28, 2016
Abstract
Starting from the biomechanics principle, the three-dimensional (3D) composite model of ostrich foot locomotion system was established using dissection, medical scan modelling, reverse engineering (RE) and finite element (FE) analysis technology. Simulation calculation on the model under three groups of different loads was performed. Meanwhile, plantar pressure test on the in vitro ostrich foot was conducted using plantar pressure measurement system combined with dynamic image analytic system. Then, the model validity was verified by comparing experimental results with FE simulation. In the end, stress distribution of bone, cartilage and soft tissue in static standing and dynamic impact state was calculated using FE method. Result shows: In the static standing state, Von Mises Stress of bone is the biggest. For a single phalanx, maximum Von Mises Stress and peak value of contact stress decreased gradually from the proximal to the distal. In a word, the paper contains a detailed study of the FE analysis on the ostrich foot locomotion system, provide a solid foundation for the research of high speed, heavy load and shock absorption mechanisms. The paper also provides a theoretical basis for the research of robot traveling mechanisms and vehicles traversing desert or planetary terrain.
Keywords
Ostrich foot locomotion system, Gross anatomy, 3D composite model, FE simulation.
Introduction
As the only extant didactyl bird, the ostrich exhibits a permanently elevated metatarsophalangeal joint and are the fastest terrestrial runner [1]. The peculiar morphological structure of ostrich foot provides mechanical basis for its locomotion performance. Metatarsophalangeal joint is a fundamental storage area of elastic energy that facilitates absorption of vibration [2].
Modeling on human body parts have been performed by both domestic and foreign scholars [3-9]. For ostrich, studies were concentrated on the locomotion kinematics and mechanics, including, biomechanics of gait and scaling relationship with body size, [10] mechanical adaptations to economical locomotion [11], kinematic and kinetic parameters [12], musculoskeletal specialization relation with locomotion performance [13], kinematics parameters of terrestrial locomotion [14], mechanics of cutting maneuvers [15], muscle moment arms of pelvic limb muscles [16], function of passive structures in locomotion [17], relationship between body mass kinetic energy [18], and economical running caused by gait-specific energetic [19]. In 2011, dynamic pressure distribution and the relationship between the trajectory of pressure center and toe position in the stance phase were studied. The trajectory of the plantar pressure center of the ostrich was J type through the field experiment. They explored the macroscopic plantar pressure curve and its dynamic load distribution [20], which could play a role in the validation of the model in our paper. To our knowledge, it is impossible to view the high speed, heavy load and shock absorption mechanisms by consulting the current literature. Modeling on human foot has great reference value to that of the ostrich [21,22].
The study established 3D composite model of ostrich foot locomotion system, the plantar pressure test was combined with the FE simulation results. Results shows that the plantar pressure distribution in the standing state is basically the same as that of the FE simulation results. The result tends to be consistent with the previous studies, that is, in the standing phase, the plantar pressure at the rear side is the biggest, followed by the front side and the middle. Thus the ostrich foot model established in this paper was validated. Then, FE analysis on the stress distribution of bones, cartilages and soft tissues were performed in static standing and dynamic impact state. Thus, high speed, heavy load and shock absorption mechanisms were explored.
Materials and Methods
FE modeling
The feet of two healthy, freshly slaughtered adult African Ostriches were selected for FE model reconstruction. Following the dissection, CT and MRI scanning were performed to obtain the precise distribution of the structures, using a Lightspeed 16 Plus Spiral CT scanner and Discovery MR750 3.0T MRI apparatus. After the scanning process, the CT/MRI images were generated in DICOM format and then were processed with Mimics software. Based on the RE modeling technology, 3D solid model of bones, articular cartilages and plantar soft tissues that are essential to the biomechanics performance were established using Geomagic Studio software. At present, there are two FE modeling methods for ligament. One is based on the medical MRI image, the ligament model established by this method is very close to the anatomical characteristics.
But at the same time, the analytic difficulty and computational cost of the FE model was raised by this method. The other is based on the FE software itself, the ligament was simplified by using truss unit in ABAQUS software [23,24]. This simplification saved the computational resources and avoided the generation of abnormal structures. In this paper, ligaments were simplified due to the complexity of anatomical structure, which were represented using the truss unit in ABAQUS software. The number and location of the ligaments were modelled based on the MRI images and anatomical analysis. Tendon plays a key role including shock absorption and energy storing in dynamic locomotion.
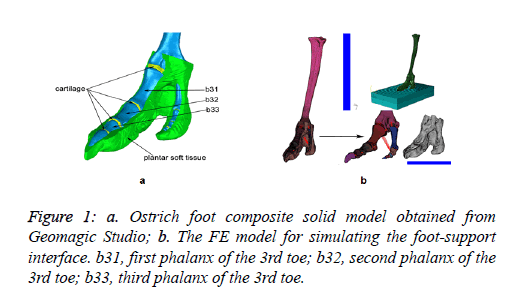
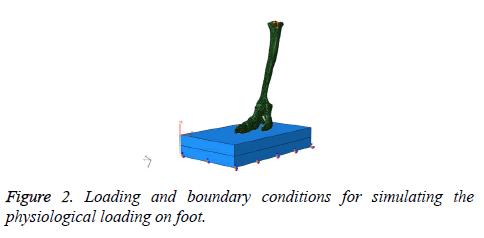
The paper conducted the quasi-static ostrich foot analysis in static standing state, thus there is no analysis about gait cycle. What’s more, the interaction between bones, cartilages and ligaments under quasi-static condition was studied, the effect of tendon could be ignored, thus tendon was not modelled in this paper. Owing to sparse of research on the mechanical properties of the ostrich tissues, the mechanical parameters were replaced by the of human foot. This substitution method has little effect on the structural performance analysis of ostrich foot locomotion system. Referring to previous study, [25] the ostrich foot 3D composite model was obtained (Figure 1a). The model was then meshed in Hypermesh and was imported into ABAQUS for simulation calculation; the position of the truss inserted into phalangeal surface was used to simulate stress concentration of ligament in the extension process (Figure 1b). Biomechanical properties were attributed to each part referring to previous literature [26-31] as is shown in Figures 1 and 2.
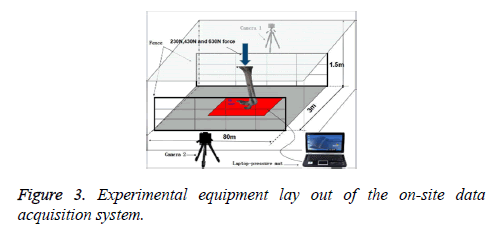
To simulate load-carrying capability of the Ostrich foot in stationary standing state, the in vitro ostrich foot which was fixed into a standing posture was smoothly placed in the middle of the pressure plate, the standing posture was kept unchanged in the experiment process. 230 N, 430 N and 630 N, the three random values were exerted at the top of the tarsometatarsus using weighs (Figure 2), which were used to verify the validation of the model. To analyze the distribution of plantar pressure and Von Mises Stress precisely, model validity verification is essential. Therefore, Ostrich in static standing state was analyzed through combination of 2D/3D locomotion analysis system Simi Motion with plantar pressure measurement system RSscan. Experimental site was calibrated referring to the classical method to obtain kinematic data of the key parts of animal [32]. The 3D calibration frame (0.6 m × 0.4 m × 0.2 m)marking point flash lamp and two high speed cameras were used in the experiment. The flash lamp was used to provide signal and synchronize the shooting time of the two high speed cameras, thus the change of the ostrich foot can be accurately distinguished. Marking point was used to mark the key point of the ostrich foot, thus the kinematic parameters can be obtained through these marking points, and it is a classical method to obtain kinematic data of the key parts of animal. Figure 3 shows Instrument layout on the data acquisition spot. The moments when readings on pressure plate were 230 N, 430 N, 630 N, respectively were recorded; plantar pressure test results were compared with simulation results to verify the model validity. Before each set of external force was applied, the plantar pressure test system should be adjusted and checked (Tables 1 and 2).
| Components | Element type | E (MPa) | ν | ρ (g/mm3) |
|---|---|---|---|---|
| Bone | 3D-tetrahedra | 12800 | 0.3 | 1.5 e-3 |
| Cartilage | 3D-tetrahedra | 10 | 0.4 | 1.07 e-3 |
| Ligaments | Tension-only Truss | 260 | 0.49 | 9.37 e-4 |
| Soft tissue | 3D-tetrahedra | 1.15 | 0.49 | 9.37 e-4 |
| Ground support | 3D-brick | 4.67 | 0.47 | 9.30 e-4 |
Table 1: Material properties and element types defined in the FE model.
| C10 | C01 | C20 | C11 | C02 | D1 | D2 |
| 0.08556 | -0.05841 | 0.03900 | -0.0231 | 0.00851 | 3.65273 | 0.00000 |
Table 2: Coefficients of the hyperelastic material used for the encapsulated soft tissue.
The plantar pressure test system software footscan was controlled by experimental personnel, the Ostrich foot was placed on the pressure plate, a constant external force was applied slowly on the ostrich foot, the plantar pressure test data was saved until the ostrich foot was stable again. The plantar pressure test and the acquisition of the 3D image were conducted simultaneously. The camera of the image analysis system was controlled by the experimental personnel. In this way, the plantar pressure distribution and 3D image data of the ostrich foot was obtained.
FE numerical analysis
In order to probe into the high speed and heavy load mechanism, numerical analysis in static standing and dynamic impact state were performed. In the static standing state, stationary constraints were exerted on the ground support plate, and 750 N (half weight of Ostrich) was exerted on the proximal tarsometatarsus. In the dynamic impact state, stationary constraints was exerted on the proximal tarsometatarsus, and a 30 m/s vertical upward velocity was exerted on the ground support plate [33], the calculation time was set to 0.5 ms. 30 m/s is an approximate value, which is used to the mechanism probing in the dynamic locomotion process, the specific value has little effect on the analysis. The speed will be weakened after impact, the paper ignores the energy dissipation in the process of running, the speed was supposed as unchanged before and after impact.
Results
Model validation
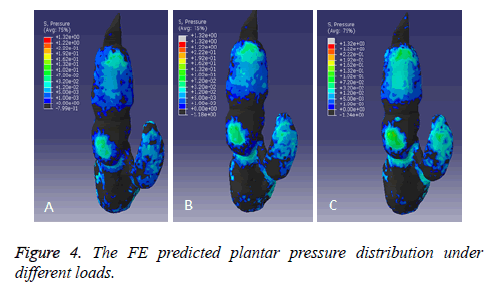
The maximum plantar pressure in standing state appears at posterolateral part of the third toe, followed by the anterior and the middle part (Figure 4), basically consistent with the in vivo standing ostrich [20]. In static standing state, when load of 230 N, 430 N and 630 N were applied, peak value of plantar pressure were 0.07 MPa, 0.09 MPa and 0.10 MPa, respectively, compared with 0.04 MPa, 0.05 MPa and 0.08 MPa from RSscan (Figure 5). Because of the simplification of the ostrich foot in the process of modelling, the complexity of the organizational structure, the connection of internal part through various tissues, which plays a controlling role for the ostrich foot locomotion? Thus, on the whole, we deemed that the experimental and simulation results are basically consistent, thus the model established was valid.
Calculation results and analysis under static load
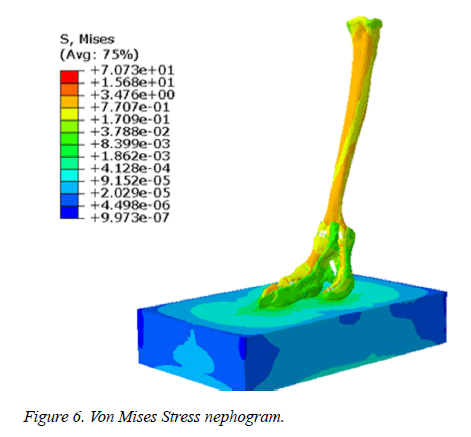
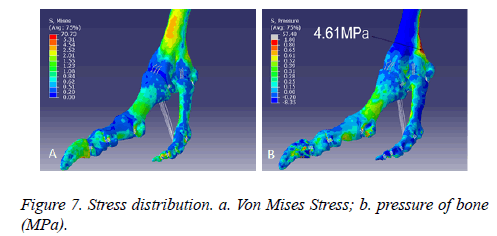
Bone stress distribution, displacement and velocity: Von Mises Stress of bone is the largest, followed by articular cartilage and plantar soft tissue (Figure 6). Corpus phalangis bears much than the caput phalangis and basis phalangis, medial bears much than the lateral, dorsal bears much than the plantar (Figure 7). The third toe is the main bearing part, while the fourth toe plays a role of supporting [20]. Posterior metatarsophalangeal joint is the main bearing part, the stress is 4.61 MPa.
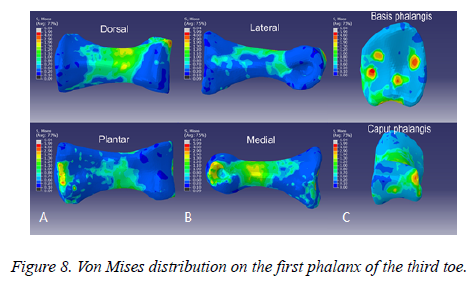
Stress analysis on a single phalanx was performed by taking the first phalange of the third toe for example. Maximum Von Mises Stress of the medial is bigger than the lateral (Figure 8b), dorsal is bigger than the plantar (Figure 8a). The maximum and minimum Von Mises Stress of phalanx is 6.04MPa and 0.09MPa (Figure 8c). In addition to articular surface of caput phalangis and basis phalangis, the maximum stress appears in the middle finest position, the enquiry value is 1.59 MPa.
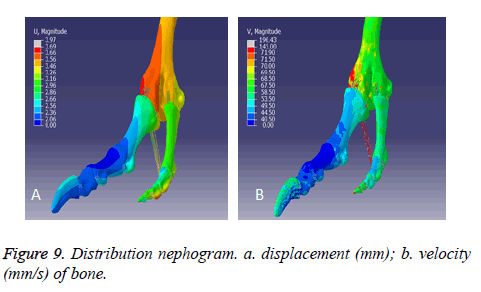
The vertical distance between metatarsophalangeal joint and horizontal support plate was 86.70 mm and 85.03 mm respectively before and after calculation, fell by 1.67 mm (Figure 9a). The velocity of the interphalangeal ligament is the biggest, bigger than 100 mm/s (Figure 9b). The displacement and velocity of the fourth toe is bigger than the third toe. Displacement and velocity of dorsal is bigger than the plantar.
Stress distribution of articular cartilage
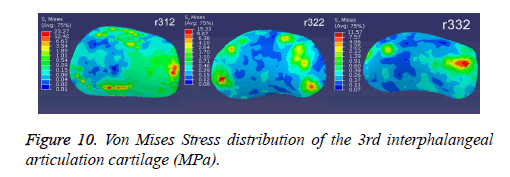
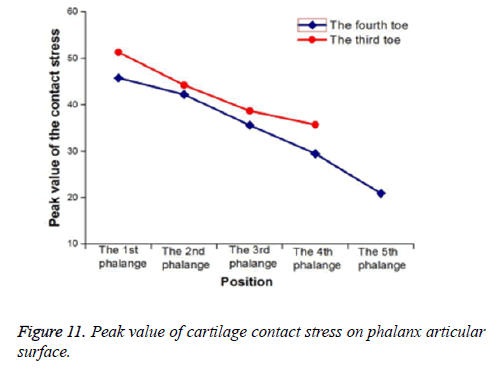
Maximum Von Mises Stress on the interphalangeal articular cartilage contact surface of r312 (distal cartilage of the first phalange of the third toe), r322 (distal cartilage of the second phalange of the third toe), r332 (distal cartilage of the third phalange of the third toe) was 23.23 MPa, 15.33 MPa and 11.57 MPa, respectively (Figure 10). The medial stress is the biggest, followed by the lateral and the middle. The maximum Von Mises Stress of the fourth interphalangeal articulation cartilage on the contact surface was 29.63 MPa, 13.64 MPa, 36.55 MPa and 15.32 MPa, respectively, similar regularity with the third toe. Similarly, with regard to the interphalangeal articular cartilage of the fourth toe, the stress distribution presents similar regularity with that of the third toe (Figure 11). From the proximal articulation to the distal articulation, the peak contact stress of the third toe was 51.32 MPa, 44.25 MPa, 38.71 MPa and 35.76 MPa respectively. The peak contact stress of the fourth toe was 45.80 MPa, 42.23 MPa, 35.63 MPa, 29.53 MPa and 20.99 MPa respectively.
Plantar pressure distribution
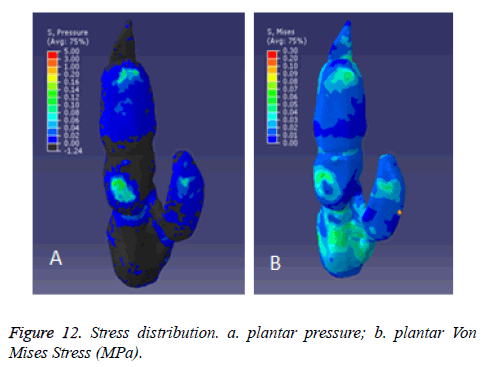
The maximum plantar pressure appears at the posterolateral plantar third toe, followed by the anteromedial and the middle part, a large plantar pressure also appears in the middle of the fourth toe. The peak stress and maximum Von Mises Stress at the posterior plantar third toe was 0.154 MPa and 0.071 MPa, while 0.123 MPa and 0.052 MP at the anterior plantar third toe, 0.070 MPa and 0.048 MPa at the plantar fourth toe (Figure 12). Through the analysis of plantar pressure distribution, it is explicitly shows that in static standing state, the third toe plays a main part of weight-bearing, while the fourth toe plays a part of keeping balance [20].
Calculation and analysis under dynamic impact
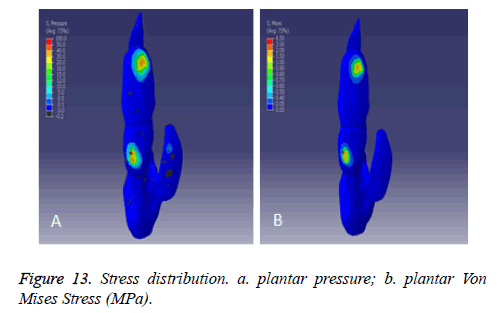
Plantar pressure distribution: The maximum plantar pressure appears at the posterolateral third toe, followed by the anteromedial. Among them, peak value of pressure and Von Mises Stress at the posterior part of the third toe are 56.18MPa and 6.47MPa, compared with 46.41 MPa and 1.86 MPa respectively at the anterior third toe. The peak value of plantar pressure of the fourth digit is 0.59 MPa (Figure 13).
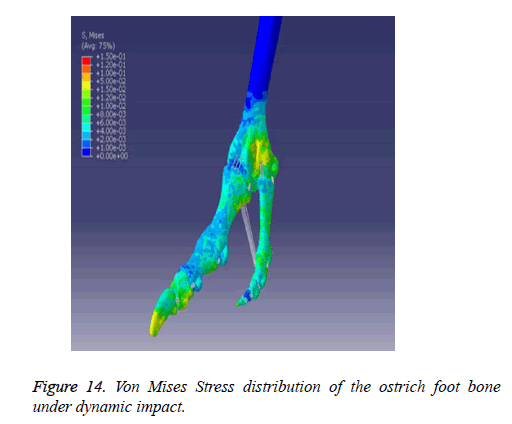
Bone stress distribution: Maximum Von Mises Stress on the tarsometatarsus is the maximum, namely 0.087 MPa; fourth toe is the minimum, namely 0.002 MPa (Figure 14). Von Mises Stress of the third toe is bigger than the fourth toe. In the process of the plantar region suffered instantaneous impact, the Maximum Von Mises Stress changed from 6.47 MPa to 0.087 MPa, that is because soft tissue played a key part of buffering and protecting the inner skeletal structure from damage effectively; With the distance from metatarsophalangeal joint becoming smaller and smaller, Von Mises Stress on the cartilage is becoming bigger and bigger, that is because plantar soft tissue is thicker near distal phalange, and thick digital cushion contains inside, buffered the external force passed over and played a part of energy absorption and cushioning.
Articular cartilage stress distribution: According to the Von Mises Stress analysis of ostrich foot bone, we draw a conclusion that soft tissue plays a role of cushioning, while the internal forces are conveyed through articular cartilage, thus, it is necessary to study the stress distribution of articular cartilage. Figure 15 shows Von Mises Stress distribution of the cartilage surface of the interphalangeal joint of the third toe.The maximum Von Mises Stress values of r34 (cartilage of the fourth phalange of the third toe), r331 (proximal cartilage of the third phalange of the third toe), r321 (proximal cartilage of the second phalange of the third toe), r311 (proximal cartilage of the first phalange of the third toe) are 0.052 MPa, 0.057 MPa, 0.067 MPa and 0.138 MPa respectively (Figure 15).
Discussion
The study probed the high speed, heavy load and shock absorption mechanisms through dissection and FE analysis of ostrich foot locomotion system. We concluded: stress of the posterior part of pelma of the third toe is the biggest, followed by the anterior and intermediate section. In the ostrich foot locomotion system composite model, Von Mises Stress of bone is the largest, followed by articular cartilage and plantar soft tissue. The third toe is the main bearing part. Peak value of the Von Mises Stress and contact stress on the phalanx decreased gradually from the proximal to the distal. Plantar soft tissue plays a role in energy absorbing and cushioning. The study provides a theoretical basis for research on robotic travelling mechanisms and vehicles in extreme environments.
However, some limitations are worth noting. The complicated internal structure provided certain difficulties for modeling, and limitations to experimental conditions and time meant that tendon was not established in the model. Tendon plays a crucial role in the ostrich foot locomotion system, further exploration should detail this.
Acknowledgements
The authors are grateful for the financial support by the National Natural Science Foundation of China (No. 51275199) and the Science and Technology Development Planning Project of Jilin Province of China (Project No. 20140101074JC).
References
- Alexander RM, Maloiy GMO, Njau R, Jayes AS. Mechanics of running of the ostrich (Struthio camelus). J Zool 1979; 187: 169-178.
- Rubenson J, Lloyd DG, Besier TF, Heliams DB, Fournier PA. Running in ostriches (Struthio camelus): three-dimensional joint axes alignment and joint kinematics. J Exp Biol 2007; 210: 2548-2562.
- Cheng HYK, Lin CL, Wang HW, Chou SW. Finite element analysis of plantar fascia under stretch-The relative contribution of windlass mechanism and Achilles tendon force. J Biomech 2008; 41: 1937-1944.
- Cheung JT, Zhang M, An KN. Effects of plantar fascia stiffness on the biomechanical responses of the ankle-foot complex. Clin Biomech (Bristol, Avon) 2004; 19: 839-846.
- Chu TM, Reddy NP, Padovan J. Three-dimensional finite element stress analysis of the polypropylene, ankle-foot orthosis: static analysis. Med Eng Phys 1995; 17: 372-379.
- Dai XQ, Li Y, Zhang M, Cheung JT. Effect of sock on biomechanical responses of foot during walking. Clin Biomech (Bristol, Avon) 2006; 21: 314-321.
- Chen WM, Lee T, Lee PV, Lee JW, Lee SJ. Effects of internal stress concentrations in plantar soft-tissue--A preliminary three-dimensional finite element analysis. Med Eng Phys 2010; 32: 324-331.
- Forushani RH, Hassani K, Izadi F. Steady State Heat Analysis of the Eye Using Finite Element Method. Biomed res-india 2012; 23: 99-104.
- Yan WJ, Jiao XH, Shao P, Cai W. Stress distribution in the mandibular central incisor and periodontal ligament while opening the bite: A finite element analysis. Biomed res-india 2012; 23: 343-348.
- Smith NC, Wilson AM. Mechanical and energetic scaling relationships of running gait through ontogeny in the ostrich (Struthio camelus). J Exp Biol 2013; 216: 841-849.
- Lloyd RJ, Heliams DG, Besier DB, Fournier PA. Adaptations for economical bipedal running: the effect of limb structure on three-dimensional joint mechanics. J R Soc Interface 2007; 8: 740-755.
- Smith NC, Jespers KJ, Wilson AM. Ontogenetic scaling of locomotor kinetics and kinematics of the ostrich (Struthio camelus). J Exp Biol 2010; 213: 1347-1355.
- Smith NC, Wilson AM, Jespers KJ, Payne RC. Muscle architecture and functional anatomy of the pelvic limb of the ostrich (Struthio camelus). J Anat 2006; 209: 765-779.
- Abourachid A. Kinematic parameters of terrestrial locomotion in cursorial (ratites), swimming (ducks), and striding birds (quail and guinea fowl). Comp Biochem Physiol A Mol Integr Physiol 2001; 131: 113-119.
- Jindrich DL, Smith NC, Jespers K, Wilson AM. Mechanics of cutting maneuvers by ostriches (Struthio camelus). J Exp Biol 2007; 210: 1378-1390.
- Smith NC, Payne RC, Jespers KJ, Wilson AM. Muscle moment arms of pelvic limb muscles of the ostrich (Struthio camelus). J Anat 2007; 211: 313-324.
- Schaller NU, Herkner B, Villa R, Aerts P. The intertarsal joint of the ostrich (Struthio camelus): Anatomical examination and function of passive structures in locomotion. J Anat 2009; 214: 830-847.
- Fedak MA, Heglund NC, Taylor CR. Energetics and mechanics of terrestrial locomotion. II. Kinetic energy changes of the limbs and body as a function of speed and body size in birds and mammals. J Exp Biol 1982; 79: 23-40.
- Watson RR, Rubenson J, Coder L, Hoyt DF, Propert MW. Gait-specific energetics contributes to economical walking and running in emus and ostriches. Proc Biol Sci 2011; 278: 2040-2046.
- Schaller NU, D'Août K, Villa R, Herkner B, Aerts P. Toe function and dynamic pressure distribution in ostrich locomotion. J Exp Biol 2011; 214: 1123-1130.
- Hirokawa S, Tsruno R. Three-dimensional deformation and stress distribution in an analytical/computational model of the anterior cruciate ligament. J Biomech 2000; 33:1069-1077.
- Song Y, Debski JK, Musahl V, Thomas M, Woo S. A three-dimensional finite element model of the human anterior cruciate ligament: a computational analysis with experimental validation. J Biomech 2004; 37: 383-390.
- Cheung JT, Zhang M, Leung AK, Fan YB. Three-dimensional finite element analysis of the foot during standing--a material sensitivity study. J Biomech 2005; 38: 1045-1054.
- García-Aznar JM, Bayod J, Rosas A, Larrainzar R, García-Bógalo R. Load transfer mechanism for different metatarsal geometries: a finite element study. J Biomech Eng 2009; 131: 021011.
- Zhang R, Wang HT, Zeng GY, Li JQ. Computer Tomography Scanning and Modelling of Ostrich Foot J Med Imag Health 2015; 5: 848-854.
- Chen WP, Tang FT, Ju CW. Stress distribution of the foot during mid-stance to push-off in barefoot gait: a 3-D finite element analysis. Clin Biomech 2001; 16: 614-620.
- Cheung JT, Zhang M, Leung AK, Fan YB. Three-dimensional finite element analysis of the foot during standing--a material sensitivity study. J Biomech 2005; 38: 1045-1054.
- Reed KL, Brown TD. Elastic modulus and strength of emu cortical bone. Iowa Orthop J 2001; 21: 53-57.
- Chen WP, Ju CW, Tang FT. Effects of total contact insoles on the plantar stress redistribution: a finite element analysis. Clin Biomech (Bristol, Avon) 2003; 18: S17-24.
- Cheung JT, Zhang M, An KN. Effect of Achilles tendon loading on plantar fascia tension in the standing foot. Clin Biomech (Bristol, Avon) 2006; 21: 194-203.
- Hu B, He LF, Zhang R. Digital Image Correlation for Rubber Elastic Modulus Measurement. 2011; 26:151-157.
- Ren L, Hutchinson JR. The three-dimensional locomotor dynamics of African (Loxodonta africana) and Asian (Elephas maximus) elephants reveal a smooth gait transition at moderate speed. JR Soc Interface 2008; 5: 195-211.
- Zhang SH. Research on walking mechanism of vehicles in the sand circumstance by imitating ostrich foot. Jilin University, 2013.
