Research Article - Journal of Clinical Ophthalmology (2024) Volume 8, Issue 6
Exploring the role of homocysteine in eye with glutamate-cysteine ligase, a biochemical and molecular dynamics approach
Muthuvel Bharathselvi1*, Muthuvel Suresh Kumar2*, Amaresh Kumar Mohanty2, Konerirajapuram N Sulochanaa1
1Department of Biochemistry and Cell Biology, Vision Research Foundation, KBIRVO Block, Sankara Nethralaya, Chennai, India
2Centre for Bioinformatics, School of Life Sciences, Pondicherry University, Pondicherry, India
- Corresponding Author:
- M. Sureshkumar and M. Bharathselvi
Department of Biochemistry and Cell Biology,
Vision Research Foundation,
Chennai,
India
E-mail: muthuvels@hotmail.com, bharathselvi363@gmail.com
Received: 09-September-2024, Manuscript No. AACOVS-24-153791; Editor assigned: 12-September-2024, PreQC No. AACOVS-24-153791 (PQ); Reviewed: 26-September-2024, QC No. AACOVS-24-153791; Revised: 15-November-2024, Manuscript No. AACOVS-24-153791 (R); Published: 13-December-2024, DOI: 10.35841/aacovs.8.6.489-496
Citation: Bharathselvi M, SureshKumar M, Mohanty AK, et al.. Exploring the role of homocysteine in eye with glutamate-cysteine ligase, a biochemical and molecular dynamics approach. J Clin Ophthalmol 2024;8(6):489-496.
Abstract
An increased homocysteine level is considered as a risk factor of vascular eye diseases. To protect the neural retina from oxidative stress by homocysteine is challenging. Glutathione is synthesized from cysteine, a product of methionine via Hcy. In this study, we measured the levels of GSH and the amino acids involved in the methionine-homocysteine cysteine-glutathione axis to understand the effect of Hcy on GSH and also we study the time course variation and stability of the binding patterns of homocysteine in comparison with cysteine by molecular dynamics. Homocysteine forms a stable complex with GCLC protein but fails to induce secondary structural variations, which aid the ligation of glutamic acid. Competitive inhibition of homocysteine is evident from the higher binding energy and the structural similarity of homocysteine with cysteine. We observed that Hcy negatively influences GSH synthesis, γ-Glutamate Cysteine Ligase (γ-GCL) is the enzyme responsible for the synthesis of GSH. It is possible that Hcy is a competitive inhibitor of γ-GCL and its role in GSH synthesis needs to be studied further.
Keywords
Homocysteine, Glutathione, Inhibitor, GCLC protein.
Introduction
In human studies have highlighted the association between homocysteinemia (HHcy) and the development of Age related Macular Degeneration (AMD) [1,2]. Homocysteine (Hcy) is an intermediate product in the metabolism of methionine pathway which converts Hcy back to Methionine (Met) and in transsulfuration pathway, upon serine addition, which converts Hcy to cysteine (Cys). Increased levels of Hcy deplete the glutathione levels through the GSH consumption by reactive oxygen species and also by Hcy and its metabolite HcyTL which impairs the protein function due to the process of inflammation [3,4]. These metabolic reactions are dependent on vitamins such as B12, folate and pyridoxine. Inadequate supply of vitamins and alterations in an enzyme results in the accumulation of Hcy in the blood, leads to neurodegenerative, cardiovascular diseases and elevated Hcy predicts a risk of AMD. There is an in-vitro experimental evidence shows a cause-effect relationship between Hcy and retinal RPE dysfunction, which plays a fundamental role in the development and progression of AMD [5,6].
Glutathione is a naturally occurring tri-peptide with a thiol functional group and its diverse functions includes the maintenance of reactive oxygen and nitrogen species, transport of Cys [6,7] and involved in synthesis of prostaglandin [8,9]. It regulates the enzyme activity by reduction of the disulfide bonds and glutathionylation [10,11]. GSH metabolism is exclusively disrupted in the diseased individuals being affected from AIDS, cancer and neurodegenerative conditions such as Parkinson and Alzheimer [12-16]. Age related lowering of the GSH levels leads to decline an antioxidant levels with a higher incidence of chronic illness [17].
High concentration of glutathione was observed in the retina and retinal pigment epithelium and may be depleted during periods of oxidative stress [18]. Endogenous antioxidants, such as GSH, cannot be replaced directly. Instead, compounds that can easily enter cells and increase intracellular antioxidant levels are preferred. In clinical trials supplementation of antioxidants halt the progression of AMD [18]. In-vitro experimental studies show that the protection of RPE cells from oxidative injury and oxidant-induced apoptosis by GSH and its precursors [19].
Glutathione is made of glutamate, cysteine and glycine. GSH is an antioxidant and its biosynthesis dependents on enzymes such as Glutamate-Cysteine Ligase (GCLC) and glutathione synthetase. Among these enzymes the synthesis of GSH regulates by the enzyme glutamate-cysteine ligase and this enzyme availability depends on the amino acids cysteine [20-22]. Hcy induces cellular damage through oxidative stress observed in in-vitro studies [23-25].
To the best of the authors’ knowledge, there has been no substantial report on the association of homocysteine and competitive inhibition of Cys, related to Glutathione (GSH). Our study explores the competitive binding of homocysteine with cysteine related to GSH and its rate limiting enzymes γ- glutamate cysteine ligase through the Molecular Dynamics Studies (MDS) approach to investigate the structural stability of the interactions and the inhibition mechanism of the GCLC by Hcy.
Materials and Methods
Homology modeling
By using homology modeling approach GCLC crystal structure 3D model in the absence of Homo sapiens is predicted. The 637 amino acids (aa) sequence of GCLC (P48506; GSH1_HUMAN) is retrieved from the UniProtKB database [26]. The homologues sequences of retrieved aa sequence of GCLC in Homo sapiens are searched using NCBI BLAST program with default parameters against the Protein Data Bank (PDB) [27]. The PDB structure of Saccharomyces cerevisiae glutamate cysteine ligase in complex (PDB ID: 3IG8) [28] is used for model building which has a sequence identity of 42% with the inbound Glu, ADP and three Mg2+ ions. Holo form of the GCLC enzyme is modeled using the Cys ligand from crystal structure of Michaelis complex of gammaglutamylcysteine synthetase (PDB ID: 2D32) [29]. The models were build using the model-ligand py script from Modeller 9v13 [30,31] by applying the positional restraints on the bound ligands. By using Discrete Optimized Protein Energy (DOPE) assessment score and probability density function to generate the comparative models and ranked. The GCLC Hcy complex is modeled by manually editing the Cys structure to Hcy by adding an additional methylene bridge (-CH2-) to Cys. The model structures are subjected to energy minimization to relax the short range contacts formed by the Hcy ligand.
Molecular Dynamics studies (MD)
MD simulations were performed by using 4.5.5 versions of the GROMACS software and GROMOS 53a6 force field and the topology files for Hcy, Cys, Glu substrates and ADP cofactor are generated by using PRODRG sever [32-34]. During simulation the proteins were solvated, neutralized and the periodic boundary conditions were carry through with a distance of 1 nm in all directions from the protein, electrostatic and van der Waals interactions were also analyzed as described by Darden, et al [35,36]. The temperature, isotropic pressure was employed by using the Parrinello-Rahman method [37] and the constraints were deployed using LINC algorithm in simulation [37,38]. The solvent, ions were stabilized by constant volume and pressure, the substrates, cofactors were construct by using a force constant of 1000 kJ mol-1nm-2. Finally, the MD simulations were performed for 30 ns and all trajectories were stored every 0.002 ps for further analysis.
Cytotoxicity assay
Cytotoxic effect of Hcy, Cys and Hcy with Cys together was assayed using a 3-[4, 5-dimethylthiazol-2-yl]-2,5- diphenyltetrazolium bromide (MTT) [39]. ARPE-19 cells grown in 96-well plates following a 12 h in serum-free medium were exposed to various concentrations of 5 μM-100 μM Hcy, Cys and Hcy with Cys together. At the end of incubation, the cells were treated with MTT for 4 h and solubilised in 100 μl of dimethylsulfoxide. The absorbance was measured at a wavelength of 550 nm using a micro-plate reader.
Estimation of amino acids by FLD-RP-HPLC
The level of released Hcy and its related amino acids in methionine pathway was analyzed with HPLC, as described by Bharathselvi, et al [40]. ARPE 19 cells were exposed to various concentrations of Hcy at the incubation for 1 h. Cells were lysed in mobile phase and centrifuged at 2,500 rpm for 10 minutes. The supernatant was filtered using 0.22 μ filter and 50 μl was injected into the HPLC column. Cells without treatment were taken as control.
Intracellular GSH estimation
ARPE-19 cells were grown in 24-well plates and exposed to various concentrations of Hcy, Cys and also the combination of Hcy with Cys. At the end of incubation, the cells were extracted with chilled PBS, sonicate the lysate for a minute and immediately centrifuged it for 10,000 rpm at 5 minutes, transferred the lysate into a fresh vial and concentrate the lysate using speed vac. Then the lysate made up with 100 μl of water and estimate glutathione by spectrophotometer at 412 nm [41].
Statistical analysis
All the experiments were done in triplicates and the values were expressed as mean ± SD. The data were analyzed for statistical significance by Student’s t test and p values, 0.05 were considered to be significant.
Results and Discussion
Homology modeling
The best-predicted model having relatively less molPDF score 157061.29 and DOPE score of -46065.46; is subjected to energy minimization and used as reference structure for generating GCLC-Hcy complex. The generated GCLC-Cys and GCLC-Hcy complexes have a RMSD deviation of 1.316 and 1.313 respectively with the template GCLC complex structure from Saccharomyces cerevisiae. By using ProSA server the model was determined by X-ray and NMR structures. Packing quality analysis using Atomic Non-Local Environment Assessment (ANOLEA) server of GCLC-Cys and GCLC-Hcy complexes showed higher residues with positive energy values which shows the protein structures are compactly packed.
The QMEAN global quality scores are 0.432 (Z-score=-3.53) and 0.431(Z-score=-3.71) for GCLC-Cys and GCLC-Hcy complexes respectively makes them a lower but acceptable quality models assessed by QMEAN server. The overall Zscores of GCLC-Cys and GCLC-Hcy were within the acceptable quality analysis by ProSA of -3.38 and -3.24 showing that the predicted structures are comparable with the pdb structures. The higher energy levels of the protein are due to the long gap insertions of 12% and lesser sequence identity of 42% between the template and the target sequence.
Molecular dynamics simulations
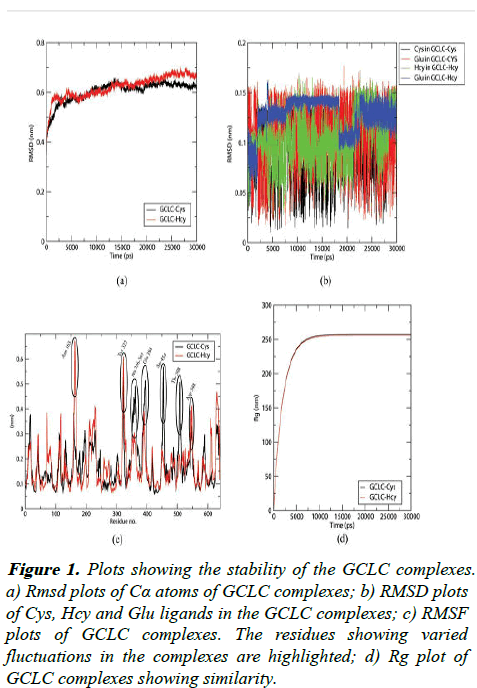
The 30 ns simulation files of the production run were saved and the RMSD of the GCLC protein and bound substrates were calculated to assess the strength of the systems as shown in Figure 1.
Figure 1: Plots showing the stability of the GCLC complexes. a) Rmsd plots of Cα atoms of GCLC complexes; b) RMSD plots of Cys, Hcy and Glu ligands in the GCLC complexes; c) RMSF plots of GCLC complexes. The residues showing varied fluctuations in the complexes are highlighted; d) Rg plot of GCLC complexes showing similarity.
The RMSD of the protein attains stability at 2.5 ns at 6 Å and shows a lesser deviation up to 7 Å in the course of the simulation. The substrates Cys, Hcy and Glu shows fluctuations lower than 1.5 Å showing that the bound ligands are having a stable interaction in the binding pockets. The fluctuations of each residue in the complexes are assessed using the RMSF plot as shown in the Figure 2.
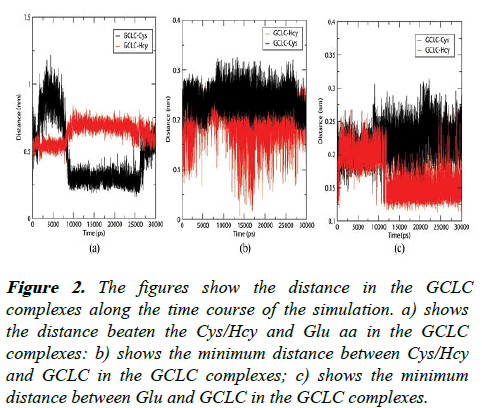
Figure 2: The figures show the distance in the GCLC complexes along the time course of the simulation. a) shows the distance beaten the Cys/Hcy and Glu aa in the GCLC complexes: b) shows the minimum distance between Cys/Hcy and GCLC in the GCLC complexes; c) shows the minimum distance between Glu and GCLC in the GCLC complexes.
The residues Asn 163, Tyr 322, Asp 548 residing in the outer coil regions show a higher fluctuation upon interaction with Cys. The Cys substrate binding induces higher fluctuations in the loop region of 356-365 and the residues 394, 454 and 508. These fluctuating residues reside away from the binding site of cofactors or the substrates making the fluctuations irrelevant. The above analysis proves that the GCLC-Cys and GCLC-Hcy along with cofactor ADP and the other substrate Glu are stable.
GCLC interactions with Cys/Hcy and Glu residues
The inhibitor Hcy shows an altered binding pattern with the GCLC protein when compared to Cys as shown in the Figure 2. The minimum distance plots of Cys and Glu show higher fluctuations from 12.5 Å to 1.5 Å, whereas the Hcy resides at a distance of 4.0 Å to 7.5 Å hindering the peptide bond formation between the substrates unlike the Cys and Glu, which can form an effective peptide bond due to the shorter distances. The Glu and Hcy aa in the GCLC-Hcy complex show a shorter distance than the Glu and Cys distance in GCLC complex. The Cys in the GCLC complex resides at a distance of 2 Å making non bonded interactions whereas in GCLC-Hcy complex the Hcy involves in bonded interactions with the GCLC protein with a lesser distance than 1.5 Å. After a simulation period of 12 ns the Hcy in the GCLC-Hcy complex induces the Glu aa to form bonded interactions with GCLC whereas in GCLC-Cys complex the Glu aa remains at a distance more than 1.5 nm from GCLC. These bonded interactions between the GCLC and substrates Hcy and Glu in GCLC-Hcy restrict the bond formation between the mentioned substrates hindering the synthesis of glutathione.
Secondary structural alterations
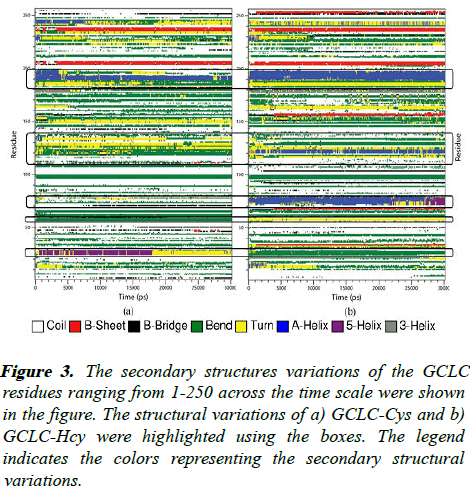
The residual range of 1-250 contains key aa which interact with the substrates and the cofactors. These residues are assessed for the secondary structural changes using the DSSP program as shown in Figure 3.
Figure 3: The secondary structures variations of the GCLC residues ranging from 1-250 across the time scale were shown in the figure. The structural variations of a) GCLC-Cys and b) GCLC-Hcy were highlighted using the boxes. The legend indicates the colors representing the secondary structural variations.
The Hcy binding to the GCLC induces the formation of new α- helix in the GCLC protein. The residue 180-200 contain α-helix region, which involves in the interaction with the ADP residue. The Hcy interactions stabilize the helices but Cys binding induces the α-helix to nonstructural formations of bends and turns. The Hcy interacts with the residues ranging from 120-130 and induces the α-helix formation whereas the Cys induces the formation of β-bridges and bends. The residues in the range of 70-80 have a α-helix configuration induced by the Hcy aa, but the substrate Cys induces a coil configuration which has high flexibility. The residues in the range of 20-30, 55-60 that interact with ADP and Cys/Hcy also show structural transactions from bends and turns. These helical variations induced by the Hcy in the GCLC makes the protein structure less flexible than the Cys binding.
Free energy landscapes
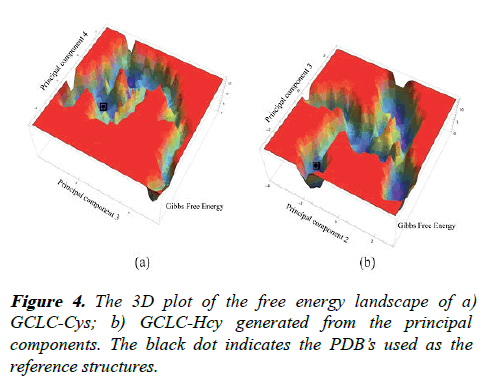
The Free Energy Landscapes (FEL) for GCLC complexes are generated based on the principal component vectors using the g_sham tool of GROMACS. The FEL of the GCLC-Cys complex is generated based on the principal component 3 (cos value=0.0019897) and principal component 4 (cos value=0.0181617). Similarly, the principal component 2 (cos value=0.0142558) and principal component 3 (cos value=0.000190398) are used to generate the FEL of the GCLC-Hcy complex. The FEL of GCLC-Cys complex has a Gibbs energy in the range of 0 KJ/mol-16.7 KJ/mol with wide spanning core region with lower energy barrels and a tail region of higher energy. The GCLC-Hcy has a Gibbs energy in range of 0 KJ/mol-13.6 KJ/mol with a widespread five energy barrels which are connected by a lower energy levels.
The wide spread five energy barrels provide insight to the structural transitions undergone by the GCLC protein on interaction with the Hcy than Cys, which can induce a few energy bin formations showing lesser altered structural variations. The structures with lowest Gibbs free energy were retrieved from the free energy landscapes as shown in the Figure 4.
Structural comparisons of GCLC-Cys and GCLCHcy complexes
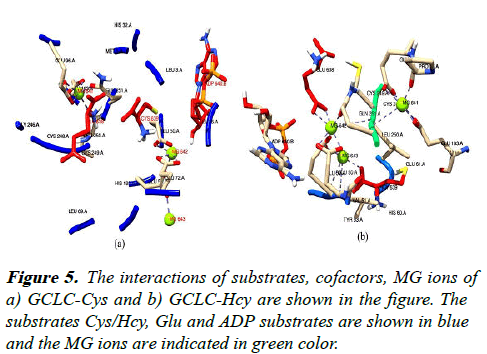
The GCLC-Cys and Hcy complexes show an altered interaction patterns with the substrates Cys/Hcy, Glu and the cofactors ADP and Mg+2 ions are shown in the Figure 5.
The Cys which is the natural substrate for the GCLC complex exhibits non bonded interactions with the GCLC enzyme and resides in the acidic environment of Glu aa (638, 50 and 72) and a protonating his 32 residue which helps in electron transfer reactions similar to proposed PDB structure 3IG5.
The Hcy residue in the GCLC-Hcy complex is surrounded by a lesser acidic environment with Glu (52, 61) lacking interactions with Glu substrate and interacts with Mg2+ cofactor. The other substrate Glu in the GCLC-Cys complex resides closer to the Cys as discussed above whereas the Glu ion in the GCLC-Hcy complex interacts with the ADP and Mg2+ acting as a cofactor. The ADP molecule in the GCLC-Cys complex interacts with the hydrophobic Leu residues near the phosphate moiety whereas the ADP of GCLC-Hcy the ADP phosphate moiety interacts with sulphur containing aa Met which does not aid in the energy transfer reactions.
Binding free energies calculated by MM/PBSA
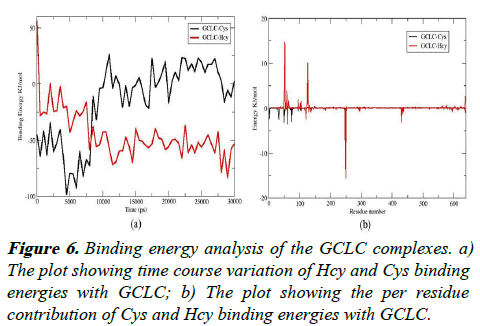
The binding free energies of the GCLC complex with Hcy/Cys were calculated using the g_mmpbsa program. The binding free energies of the complexes were averaged for 60 snapshots taken at an interval of 500 ps throughout the simulation were shown in Figures 6a and 6b.
The increased binding affinity is mainly contributed by the increased van der Waal energy and the SAV energy, which contribute to the strong attractive force for the Hcy as shown in Table 1.
| GCLC-Cys | GCLC-Hcy | |
|---|---|---|
| van der Waal energy | 0.000 ± 0.000 kJ/mol | -77.720 ± 2.140 kJ/mol |
| Electrostatic energy | 0.000 ± 4.042 kJ/mol | 19.346 ± 0.804 kJ/mol |
| Polar solvation energy | 10.713 ± 11.117 kJ/mol | 58.662 ± 2.142 kJ/mol |
| SASA energy | -4.885 ± 0.059 kJ/mol | -9.355 ± 0.089 kJ/mol |
| SAV energy | -49.928 ± 2.117 kJ/mol | -69.474 ± 1.232 kJ/mol |
| WCA energy | 28.196 ± 0.460 kJ/mol | 33.263 ± 0.541 kJ/mol |
| Binding energy | -15.969 ± 4.386 kJ/mol | -45.226 ± 2.714 kJ/mol |
Table 1. The contribution of various energy terms to the binding energy value of Cys/Hcy in the GCLC complexes.
The Cys and Hcy show a higher variation in the binding energy patterns through the course of the simulation. The Cys, which binds intact with negative binding energy, shows stability in the positive binding region, indicating that it can be released freely during the course of the simulation. Alternatively, the binding energy values of Hcy shift from the positive values to the negative values which show an increase in the binding efficiency of the Hcy to the GCLC. The per residue interactions of Cys/Hcy were show in the Figure 6. The residues Leu 250, Cys 248 show strong interactions with Hcy with energy values of -15.61KJ/mol and -13.50KJ/mol respectively revealed that these residues form stable interactions with the GCLC. The Cys interactions are spread over a varied region of GCLC with altered residual interaction patterns. This shows that the Hcy can form strong and stable interactions with the GCLC than the Cys and can act as competitive inhibitor.
Cytotoxicity assay
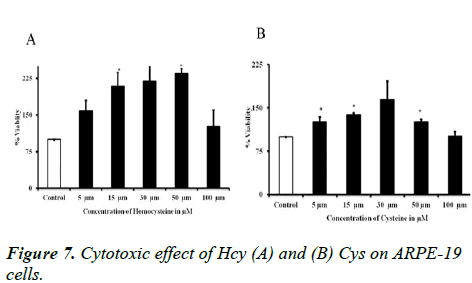
MTT assay was determined to observe the cytotoxic effect of Hcy and Cys on ARPE-19 cells. Concentration ranges from 5 μM-100 μM for 1 h time point and the cell viability as shown in Figure 7. The prolonged incubation of Hcy alters the RPE structure.
Homocysteine alters the amino acids level in ARPE-19 cells
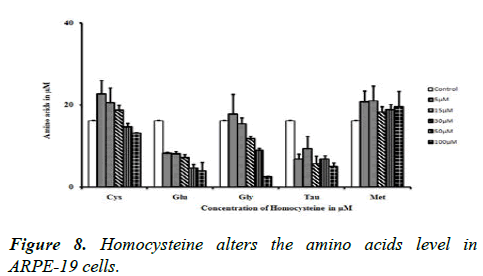
Glutamic acid, glycine and taurine levels were decreased when increased the concentration of Hcy, whereas in 5, 15 and 30 μM concentrations of Hcy not affected the cysteine level, instead of 50 and 100 μM affected the cysteine level. But methionine level is increased while increasing the concentration of Hcy as shown in Figure 8.
The amino acids such as glutamic acid, cysteine and glycine are decreased when increased the concentration of Hcy, this paves the way to study the Hcy is really affecting the synthesis or utilization of GSH. Glycine is an abundant amino acid in extracellular matrix, as collagen is a major protein accounting for bulk of ECM, which contains glycine as 1/3 of its composition [42].
Intracellular GSH levels
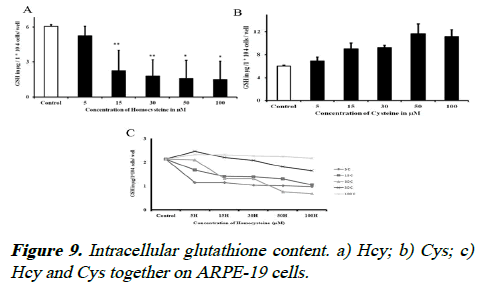
To determine whether Hcy decreased the GSH levels, ARPE-19 cells were exposed to various concentrations of Hcy and Cys and intracellular GSH concentrations were analyzed. The intracellular GSH content was decreased when compare to controls with increase concentration of Hcy, whereas the GSH content was increased with increased concentration of cysteine. While co-incubation of Hcy and Cys, the GSH level can be retrieved up to 60% by adding Cys to the cells as shown in Figure 9, but increased Hcy decreases the synthesis of GSH and also higher levels of Cys along with higher levels of Hcy, there is no change in GSH level. We did the enzyme activity in the serum and PBMC samples of idiopathic re tinal vasculitis (Eales’ diseases) cases and observed that the GCL activity was decreased in Eales’ disease (data not shown).
GSH is an important antioxidant in humans. The intracellular thiols were maintained and preserving the pro-oxidantantioxidant balance in human tissues, such as GSH, in their reduced form, may allow for the maintenance of Hcy and other intracellular thiols in redox states [43,44]. It is often accompanied by other endogenous thiols, such as cysteine, cysteinylglycine and even Hcy. It has been reported that GSH and thiol content may decrease in certain pathological states and on the account of the aging process.
In GSH biosynthesis, GCL is a rate-limiting enzyme play an important role in oxidative stress [45]. The GCLC possess catalytic activities; however, GCLM subunit increases GCL activity (Vmax and Kcat) are the two subunits of GCL protein, substrate affinity for glutamate, ATP and the Ki involves in feedback inhibition of GSH [45].
Conclusion
The molecular dynamics studies provide insight to the competitive inhibition mechanism of GCLC with Hcy. Hcy fails to induce secondary changes in the α-helix which prevents its ligation with the Glu an inhibiting the GSH synthesis. The Hcy residue lacks surrounding acidic environment, which prevents the probation reactions further inhibiting the ligation reactions. The Hcy had an increased binding energy than the Cys, which shows an increased binding affinity of Hcy with GCLC than the Cys. Our study paves that Hcy had a competitive inhibition in the binding of Cys with GCLC.
Acknowledgments
We are very thankful to Bioinformatics Resources and Applications Facility (BRAF) at C-DAC, Pune for providing high-end supercomputing facility for carrying out the simulations.
References
- Kamburoglu G, Gumus K, Kadayıfcılar S, et al. Plasma homocysteine, vitamin B12 and folate levels in age-related macular degeneration. J Clin Exp Ophthalmol. 2006;244(5):565-569.
[Crossref] [Google Scholar] [PubMed]
- Ghosh S, Saha M, Das D. A study on plasma homocysteine level in age-related macular degeneration. Nepalese J Ophthalmol. 2013;5(2):195-200.
[Crossref] [Google Scholar] [PubMed]
- Bharathselvi M, Biswas J, Selvi R, et al. Increased homocysteine, homocysteine-thiolactone, protein homocysteinylation and oxidative stress in the circulation of patients with Eales’ disease. Ann Clinical Biochem. 2013;50(4):330-338.
[Crossref] [Google Scholar] [PubMed]
- Weiss N. Mechanisms of increased vascular oxidant stress in hyperhomocysteinemia and its impact on endothelial function. Curr Drug Metabol. 2005;(1)6:27-36.
[Crossref] [Google Scholar] [PubMed]
- Ibrahim AS, Mander S, Hussein AK, et al. Hyperhomocysteinemia disrupts retinal pigment epithelial structure and function with features of age-related macular degeneration. Oncotarget. 2016;7:8532-8545.
[Crossref][Google Scholar] [PubMed]
- Samra YA, Kira D, Rajpurohit P, et al. Implication of N-Methyl-d-Aspartate receptor in homocysteine-induced age-related macular degeneration. Int J Mol Sci. 2021;22(17):9356.
[Crossref] [Google Scholar] [PubMed]
- Anderson ME. Glutathione: An overview of biosynthesis and modulation. Chemico-Biol Inter. 1998;111:1-4.
[Crossref] [Google Scholar] [PubMed]
- Nicholson DW, Ali AM, Klemba MW, et al. Human leukotriene C4 synthase expression in dimethyl sulfoxide-differentiated U937 cells. J Biol Chem. 1992;267(25):17849-17857.
[Google Scholar] [PubMed]
- Christ-Hazelhof E, Nugteren DH, van Dorp DA. Conversions of prostaglandin endoperoxides by glutathione-S-transferases and serum albumins. Biochim Biophys Acta. 1976;450(3):450-461.
[Crossref] [Google Scholar] [PubMed]
- Lu SC. Regulation of hepatic glutathione synthesis: Current concepts and controversies. FASEB J. 1999;13(10):1169-1183.
[Google Scholar] [PubMed]
- Klatt P, Lamas S. Regulation of protein function by S‐glutathiolation in response to oxidative and nitrosative stress. Eur J Biochem. 2000;267(16):4928-4944.
[Crossref] [Google Scholar] [PubMed]
- Andersen JK, Mo JQ, Hom DG, et al. Effect of buthionine sulfoximine, a synthesis inhibitor of the antioxidant glutathione, on the murine nigrostriatal neurons. J Neurochem. 1996;67(5):2164-2171.
[Crossref] [Google Scholar] [PubMed]
- Buhl R, Holroyd K, Mastrangeli A, et al. Systemic glutathione deficiency in symptom-free HIV-seropositive individuals. Lancet. 1989;334:1294-1298.
[Crossref] [Google Scholar] [PubMed]
- Sofic E, Lange KW, Jellinger K, et al. Reduced and oxidized glutathione in the substantia nigra of patients with Parkinson's disease. Neurosci Lett. 1992;142(2):128-130.
[Crossref] [Google Scholar] [PubMed]
- Staal FJ, Roederer M, Herzenberg LA, et al. Intracellular thiols regulate activation of nuclear factor kappa B and transcription of human immunodeficiency virus. Proc Natl Acad Sci U S A. 1990;87(24):9943-9947.
[Crossref] [Google Scholar] [PubMed]
- Townsend DM, Tew KD, Tapiero H. The importance of glutathione in human disease. Biomed Pharmacother. 2003;57(3-4):145-155.
[Crossref] [Google Scholar] [PubMed]
- Lang CA, Naryshkin S, Schneider DL, et al. Low blood glutathione levels in healthy aging adults. J Laboratory Clin Med. 1992;120(5):720-725.
[Google Scholar] [PubMed]
- Jampol LM, Ferris III FL. Antioxidants and zinc to prevent progression of age-related macular degeneration. JAMA. 2001;286(19):2466-2468.
[Google Scholar] [PubMed]
- Lu L, Oveson BC, Jo YJ, et al. Increased expression of glutathione peroxidase 4 strongly protects retina from oxidative damage. Antioxid Redox Signal. 2009;11(4):715-724.
[Crossref] [Google Scholar] [PubMed]
- Griffith OW, Mulcahy RT. The enzymes of glutathione synthesis: Gamma-glutamylcysteine synthetase. Adv Enzymol Relat Areas Mol Biol. 1999;73:209-267.
[Crossref] [Google Scholar] [PubMed]
- Tateishi N, Higashi T, Shinya S, et al. Studies on the regulation of glutathione level in rat liver. J Biochem. 1974;75(1):93-103.
[Crossref] [Google Scholar] [PubMed]
- Richman PG, Meister A. Regulation of gamma-glutamyl-cysteine synthetase by nonallosteric feedback inhibition by glutathione. J Biol Chem. 1975;250(4):1422-1426.
[Google Scholar] [PubMed]
- Kruman II, Culmsee C, Chan SL, et al. Homocysteine elicits a DNA damage response in neurons that promotes apoptosis and hypersensitivity to excitotoxicity. J Neurosci. 2000;20(18):6920-6926.
[Crossref] [Google Scholar] [PubMed]
- Ho PI, Collins SC, Dhitavat S, et al. Homocysteine potentiates β‐amyloid neurotoxicity: Role of oxidative stress. J Neurochem. 2001;78(2):249-253.
[Crossref] [Google Scholar] [PubMed]
- Bhattacharjee N, Borah A. Oxidative stress and mitochondrial dysfunction are the underlying events of dopaminergic neurodegeneration in homocysteine rat model of Parkinson's disease. Neurochem Int. 2016;101:48-55.
[Crossref] [Google Scholar] [PubMed]
- UniProt Consortium. UniProt: A hub for protein information. Nuc Acids Res. 2015;43:204-212.
[Crossref] [Google Scholar] [PubMed]
- Berman HM, Westbrook J, Feng Z, et al. The protein data bank. Nuc Acids Res. 2000;28:235-242.
- Biterova EI, Barycki JJ. Mechanistic details of glutathione biosynthesis revealed by crystal structures of Saccharomyces cerevisiae glutamate cysteine ligase. J Biol Chem. 2009;284(47):32700-32708.
[Crossref] [Google Scholar] [PubMed]
- Hibi T, Nakayama M, Nii H, et al. Structural basis of efficient coupling peptide ligation and ATP hydrolysis by gamma-gluatamylcysteine synthetase.
- Webb B, Sali A. Comparative protein structure modeling using modeller. Curr Protoc Bioinform. 2016;54:5-6.
[Crossref] [Google Scholar] [PubMed]
- Fan X, Monnier VM, Whitson J. Lens glutathione homeostasis: Discrepancies and gaps in knowledge standing in the way of novel therapeutic approaches. Exp Eye Res. 2017;156:103-111.
[Crossref] [Google Scholar] [PubMed]
- Pronk S, Pall S, Schulz R, et al. GROMACS 4.5: A high-throughput and highly parallel open source molecular simulation toolkit. Bioinformatics. 2013;29(7):845-854.
[Crossref] [Google Scholar] [PubMed]
- Oostenbrink C, Villa A, Mark AE, et al. A biomolecular force field based on the free enthalpy of hydration and solvation: The GROMOS force‐field parameter sets 53A5 and 53A6. J Comput Chem. 2004;25(13):1656-1676.
[Crossref] [Google Scholar] [PubMed]
- Schüttelkopf AW, van Aalten DM. PRODRG: A tool for high-throughput crystallography of protein-ligand complexes. Acta Crystallogr D Biol Crystallogr. 2004;60(8):1355-1363.
[Crossref] [Google Scholar] [PubMed]
- Berendsen HJ, Postma JP, van Gunsteren WF, et al. Interaction models for water in relation to protein hydration. Springer. 1981;331-342.
- Darden T, York D, Pedersen L. Particle mesh Ewald: An N⋅ log (N) method for Ewald sums in large systems. J Chem Phys. 1993;98:10089-10092.
- Parrinello M, Rahman A. Polymorphic transitions in single crystals: A new molecular dynamics method. J App Phy. 1981;52:7182-7190.
- Hess B, Bekker H, Berendsen HJ, et al. LINCS: A linear constraint solver for molecular simulations. J Comput Chem. 1997;18:1463-1472.
- Mosmann T. Rapid colorimetric assay for cellular growth and survival: Application to proliferation and cytotoxicity assays. J Immunol Met. 1983;65(1-2):55-63.
[Crossref] [Google Scholar] [PubMed]
- Coral K, Bharathselvi M. Simultaneous determination of homocysteine, cysteine, glycine, glutamic acid, methionine, serine and taurine in human plasma by using reverse phase-high performance liquid chromatography. Ann Clin Lab Res. 2022;10:1-6.
- Beutler E, Duron O, Kelly B. Improved method for the determination of blood glutathione. J Lab Clin Med. 1963;61:882-888.
[Google Scholar] [PubMed]
- Chau KY, Sivaprasad S, Patel N, et al. Plasma levels of matrix metalloproteinase-2 and-9 (MMP-2 and MMP-9) in age-related macular degeneration. Eye. 2008;22(6):855-859.
[Google Scholar] [PubMed]
- Moriarty SE, Shah JH, Lynn M, et al. Oxidation of glutathione and cysteine in human plasma associated with smoking. Free Radic Biol Med. 2003;35(12):1582-1588.
[Crossref] [Google Scholar] [PubMed]
- Castro R, Rivera I, Blom HJ, et al. Homocysteine metabolism, hyperhomocysteinaemia and vascular disease: An overview. J Inherit Metab Dis. 2006;29(1):3-20.
[Crossref] [Google Scholar] [PubMed]
- Deponte M. Glutathione catalysis and the reaction mechanisms of glutathione-dependent enzymes. Biochim Biophys Acta. 2013;1830(5):3217-3266.
[Crossref] [Google Scholar] [PubMed]
