Research Article - Journal of Nutrition and Human Health (2017) Volume 1, Issue 2
Effects of glutamine supplementation on body composition, food intake and energy metabolism in high fat fed mice.
Sandrina Bervini1,2, Louise Purtell3, Julia Aepler1, Yue Qi1*, Lesley V. Campbell3,4, Herbert Herzog1*
1Neuroscience Division, Garvan Institute of Medical Research, Sydney, NSW, Australia
2Department of Endocrinology, Diabetology and Metabolism, University Hospital, Bern, Switzerland
3Diabetes and Metabolism Division, Garvan Institute of Medical Research, Sydney, NSW, Australia
4Department of Endocrinology, St Vincent's Hospital Sydney, Sydney, NSW, Australia
- *Corresponding Author:
- Herbert Herzog and Yue Qi
Garvan Institute of Medical Research 384 Victoria St Darlinghurst NSW, 2010 Australia
Tel: +612 9295 8218
Fax: +612 9295 8481
E-mail: h.herzog@garvan.org.au; y.qi@garvan.org.au
Accepted date: October 11, 2017
Citation: Bervini S, Purtell L, Aepler J, et al. Effects of glutamine supplementation on body composition, food intake and energy metabolism in high fat fed mice. J Nutr Hum Health. 2017;1(2):34-41
DOI: 10.35841/nutrition-human-health.1.2.34-41
Visit for more related articles at Journal of Nutrition and Human HealthAbstract
enhance recovery after surgery or trauma. It has also been reported to have beneficial effects on glycaemic control in diabetic patients, while rodent studies suggest that it may reduce body weight and lessen hyperglycaemia. Objective: The present study aimed to investigate the effects of daily supplementation of glutamine to high fat diet and to assess this in a mouse model with abnormal feeding behaviour: the Snord116 knockout mouse. Research methods: Adult male C57BL/6 mice and mice with deletion of the Snord116 gene cluster (implicated in Prader-Willi syndrome) were given ad libitum access to HFD for 12 weeks. Mice of both genotypes were randomly assigned to either the treatment or non-treatment group. Animals were supplemented with glutamine in food (40 mg/g HFD). Body weight was monitored weekly. Spontaneous and fasting-induced food intake, glucose tolerance and insulin sensitivity, energy expenditure and body composition were assessed between 14 and 18 weeks of age. Results: Glutamine treatment did not attenuate the development of HFD-induced obesity in either WT or Snord116 knockout mice, with treatment and non-treatment groups within genotypes gaining weight at a similar rate during the monitoring period. There was also no difference between treatment groups within genotypes in food intake, glucose tolerance, insulin tolerance, energy expenditure or adiposity. Conclusion: Our results did not find evidence that would support beneficial metabolic effects of glutamine when administered daily; either in WT or Snord116 knockout mice fed a HFD.
Keywords
Glutamine, Glutamine supplementation, Mice, Snord116, Metabolism, Obesity.
Introduction
Glutamine is a conditionally essential amino acid, in that its endogenous production is sufficient in times of health, but its depletion during catabolic stress states requires supplementation from an external source [1,2]. Glutamine is highly abundant in muscle, plasma and milk and has a role in several physiological processes, including glucose homeostasis, protein anabolism and acid-base regulation [3-5].
In recent years, the addition of glutamine to enteral and parenteral nutrition has become common in critical care. Glutamine’s efficacy in aiding recovery after trauma or surgery has been documented, with its use associated with reduced mortality and reduced length of hospital stay when given to patients in intensive care as reviewed in [6,7], though more recent studies have disputed these effects [8,9]. In addition, glutamine was suggested to improve gut immune function [10,11]. But while the potential benefits of glutamine administration have been studied in the context of critical care, less is known about its effects during long-term supplementation. In humans and in vitro, glutamine potently stimulates glucagon-like peptide 1 (GLP-1) release [12,13]. Given that the GLP-1 agonist exenatide has been shown to augment postprandial satiety in adults with Prader-Willi syndrome (PWS) [14], it is possible that glutamine, in its role as GLP-1 secretagogue, could have a similar effect, inducing weight loss via reduced food intake [15]. A recent pilot study found that 4 weeks of daily supplementation of glutamine (0.5 g/Kg BW/day) was associated with weight loss and reduced waist circumference in obese women, compared to supplementation with an isonitrogenous protein supplement [16]. One previous mouse study showed that mice on a high fat diet (HFD) with glutamine supplementation gained less weight than those given HFD alone [17], although another study was not able to detect any effect on body composition of glutamine supplementation in early-weaned mice [18].
Snord116, in a paternally imprinted region on chromosome 15 (q11.2–13), has been reported as a potent genetic candidate for PWS, as the lack of this gene causes extreme food-seeking behaviour and hyperphagia in humans and mice [19-25]. To better assess the effects of daily oral glutamine supplementation of HFD on body weight, food intake and energy metabolism we chose to compare a mouse model with normal feeding behaviour (wild type) and one with hyperphagia (Snord116-/- mice) [24,26,27].
Materials and Methods
Generation of Snord116-/- mice
A general chromosome-engineering technique was used to generate the ubiquitous deletion of the imprinted Snord116 C/D box gene cluster [22,24].
Animal experiments
The Snord116Del mouse strain (C57BL/6(Cg)-Snord116tm1Uta/J; Stock No: 008118), was obtained from Jackson Laboratory (Bar Harbor, ME, USA). Experimental animals were bred at ABR (Australian BioResources Pty ltd., Moss Vale, NSW, Australia) and transferred to the testing facility of the Garvan Institute of Medical Research (Darlinghurst, NSW, Australia) at the age of 5 weeks. All animal care and procedures were approved by the Garvan/St. Vincent’s Animal Ethics Committee and were conducted in accordance with relevant guidelines and regulations.
Animals were housed under controlled conditions with a light cycle of 12 hours (lights on between 7:00 and 19:00) at an average room temperature of 22°C. The oxygen supply was guaranteed by a specific ventilation system supplying fresh air to the cages. The holding cages contained a standardised environment of spreadable bedding, a paper roll and a dome. Unless otherwise stated, animals had ad libitum access to water out of a sealed bag through a valve in the cage (hydropac/lab products, Seaford, DE, USA) and their assigned diet.
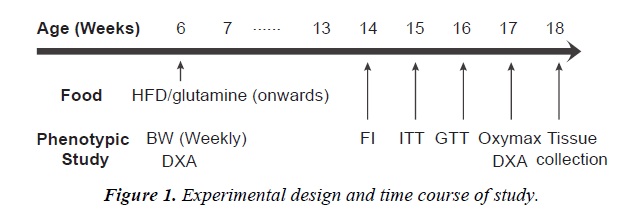
From the age of 6 weeks, mice in the wild type (WT) (n=9 to 11 per group) as well as Snord116 -/- control groups (n=7 to 8 per group) were fed with HFD providing 59% of calories from lipid, 15% of calories from protein and the remaining 26% of calories from carbohydrate (5.4 kcal/g, Specialty Feeds, Glen Forrest, WA, Australia). The access to HFD lasted during the experimental period. The treatment groups of both genotypes received glutamine supplementation in HFD at a concentration of 40 mg/g HFD (Glutamine 5000, General Nutrition Corporation, Pittsburg, PA, USA), which was used previously in this concentration [28] and is representative of the human diet [16]. The phenotypic study commenced 8 weeks after the diet started. Sufficient time was given for the animals to recover between tests. The time line of the experimental design was shown in Figure 1.
Body weight and composition
Body weight was monitored weekly. To determine total fat and total lean body mass, animals underwent dual X-ray absorptiometry (DXA) (Lunar PIXImus2, GE Medical Systems, Madison, WI, USA) dorsal side down. DXA analysis was performed before HFD feeding (at the age of 6 weeks) and after HFD feeding (at the age of 18 weeks) to determine the alteration in body composition. Animals were anaesthetised by inhalation of 2.5% isoflurane (IsoFlo™, Abbott Laboratories, Abbott Park, IL, USA) in oxygen. The head and the tail were excluded from analysis.
Food intake
Food intake was measured at the age of 14 weeks (8 weeks on HFD) both under non-fasted conditions (spontaneous food intake) and in response to an overnight fast (fasting-induced food intake). Mice were individually housed for three days and fed their assigned diet in powdered form to acclimatise to experimental conditions. They were then transferred to individual specialised Nalgene metabolic chambers (Medtex, Notting Hill, VIC) and given ad libitum access to powdered diet. Food spillage, water spillage, faeces and urine were collected into discrete compartments. Body weight and hopper weight were recorded over three consecutive days, and food consumed (i.e., food given minus food remaining) was calculated.
To determine the effect of fasting on food intake, animals’ food was removed at 5:00pm on the day before the experiment. Food was given at 9:00am the following day and food intake was measured at 1, 2, 4, 8, 24, 48 and 72 hours after reintroduction of food.
Glucose homeostasis
Insulin tolerance tests (ITT) and glucose tolerance tests (GTT) were measured at the age of 15-16 weeks. Animals were fasted for five hours prior to the tests. For ITT, an insulin solution containing 0.1 IU/mL was prepared by diluting the stock solution (100 IU/mL, Actrapid® Penfill®, Novo Nordisk, Baulkham Hills, NSW, Australia) with sterile 0.9% saline (Astra Zeneca Pty ltd., North Ryde, NSW, Australia). Animals were injected intraperitoneally with insulin solution at a dosage of 0.75 μU/g body weight. Glucose levels were assessed at baseline and 15, 30, 60 and 90 minutes after insulin administration with Accu-chek® Go glucometer (Model GS, Roche, Mannheim, Germany) in tail blood. For GTT, a 10% glucose solution for injection was prepared by diluting a sterile solution of 50% w/v glucose (Pharmalab, Lane Cove, NSW, Australia) with sterile physiological saline. Glucose was injected intraperitoneally at a dose of 1 mg/kg body weight in a volume of 10 μL/g body weight and blood glucose levels were assessed as for ITT.
Indirect calorimetry
Energy expenditure and substrate utilisation were measured at 17 weeks (11 weeks on HFD) by indirect calorimetry using an eight-chamber open-circuit calorimeter (Oxymax Series; Columbus Instruments, OH, USA). Locomotor activity was also determined in these chambers using an OPTO-M3 sensor system (Columbus Instruments). An airflow rate of 0.6 L/min was maintained and mice were acclimatised to chambers for 24 hours before the beginning of recording. Oxygen consumption (VO2) and carbon dioxide production (VCO2) were measured and respiratory exchange ratio (RER) was calculated as VCO2/ VO2. Energy expenditure (kCal) was calculated as calorific value (CV) × VO2, where CV = 3.815 + 1.232 × RER. Physical activity was assessed as ambulatory counts, i.e., consecutive beam breaks in the X and Y horizontal dimensions. Data collected for the metabolic parameters in the 24-hour measurement period were expressed as hourly averages and physical activity data were presented as hourly sums. The calorimeter was maintained with monthly calibration using highly pure primary O2 and CO2 standards.
Statistical analysis
Analyses were performed and figures were prepared using GraphPad Prism software (version 6.0, GraphPad software, San Diego, CA). Treatment groups were compared within each genotype (i.e., WT vs. WT-glutamine; Snord116 -/- vs. Snord116-/-- glutamine). Time course analyses (body weight curves, fasting-induced food intake, ITT and GTT glucose curves, energy expenditure, RER and physical activity) were performed using two-way ANOVA for repeated measures. Multiple parameter analyses (delta fat mass and lean mass, individual adipose tissue masses) were performed by multiple t-tests, correcting for multiple comparisons using the Holm-Sidak method. Differences in individual parameters (spontaneous food intake and area under the curve for glucose, energy expenditure, RER and physical activity) were performed by t-tests. Data are expressed as mean ± standard error of the mean. A p value < 0.05 was considered statistically significant.
Results
Body weight
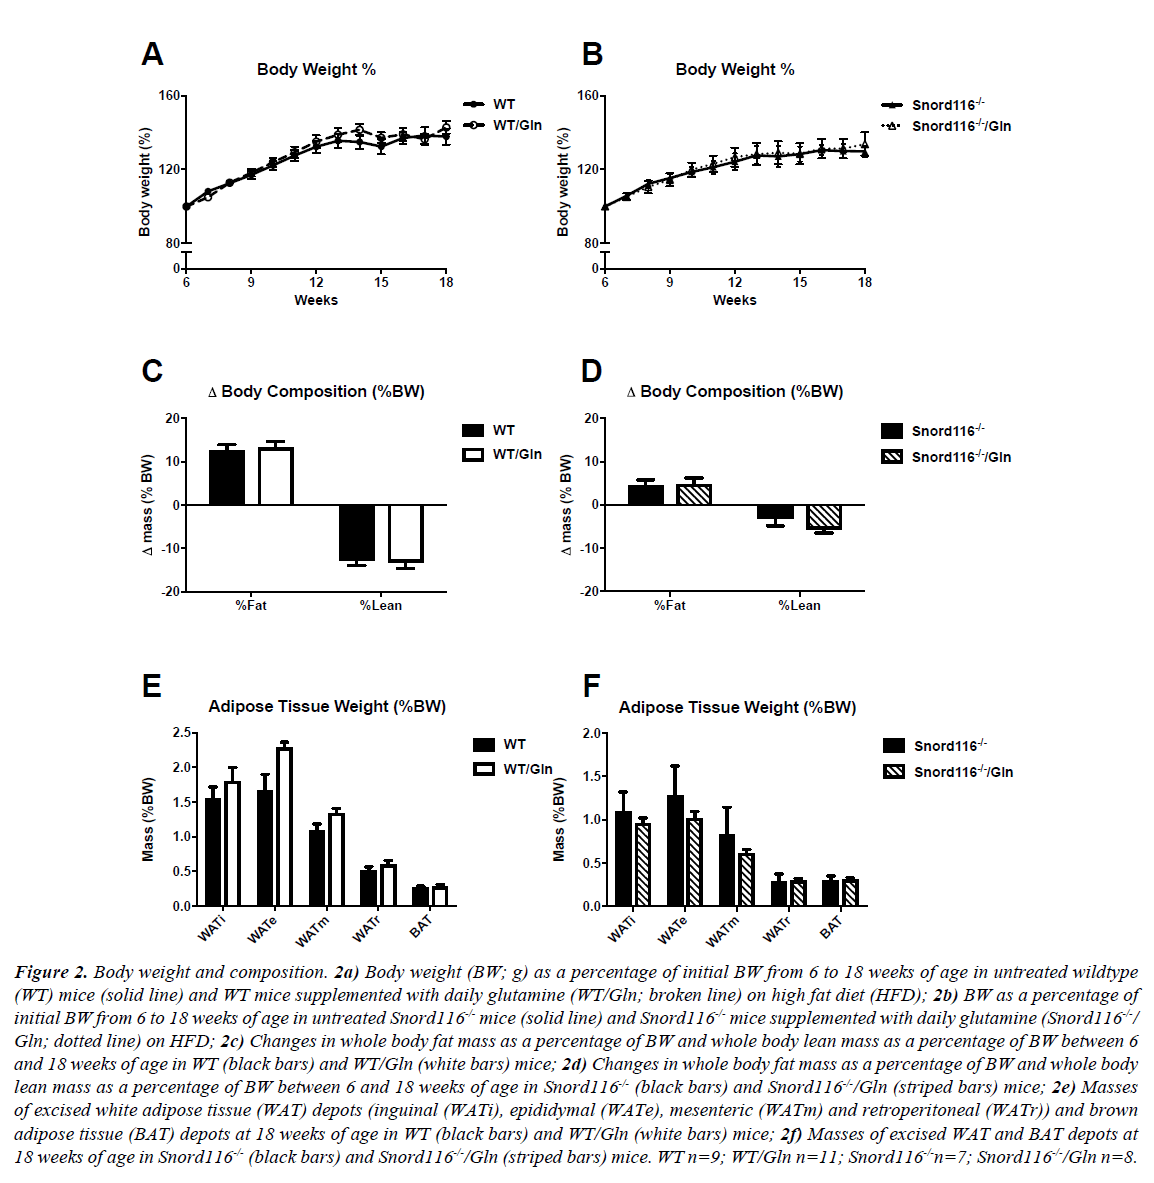
WT mice on HFD with and without glutamine supplementation gained body weight between 6 and 18 weeks of age, with no difference between treatment groups in amount or rate of weight gained (Figure 2A). Similarly, Snord116 -/- mice gained weight throughout the monitoring period, with no difference between mice on HFD with or without glutamine (Figure 2B).
Figure 2: Body weight and composition. 2a) Body weight (BW; g) as a percentage of initial BW from 6 to 18 weeks of age in untreated wildtype (WT) mice (solid line) and WT mice supplemented with daily glutamine (WT/Gln; broken line) on high fat diet (HFD); 2b) BW as a percentage of initial BW from 6 to 18 weeks of age in untreated Snord116-/- mice (solid line) and Snord116-/- mice supplemented with daily glutamine (Snord116-/-/ Gln; dotted line) on HFD; 2c) Changes in whole body fat mass as a percentage of BW and whole body lean mass as a percentage of BW between 6 and 18 weeks of age in WT (black bars) and WT/Gln (white bars) mice; 2d) Changes in whole body fat mass as a percentage of BW and whole body lean mass as a percentage of BW between 6 and 18 weeks of age in Snord116-/- (black bars) and Snord116-/-/Gln (striped bars) mice; 2e) Masses of excised white adipose tissue (WAT) depots (inguinal (WATi), epididymal (WATe), mesenteric (WATm) and retroperitoneal (WATr)) and brown adipose tissue (BAT) depots at 18 weeks of age in WT (black bars) and WT/Gln (white bars) mice; 2f) Masses of excised WAT and BAT depots at 18 weeks of age in Snord116-/- (black bars) and Snord116-/-/Gln (striped bars) mice. WT n=9; WT/Gln n=11; Snord116-/-n=7; Snord116-/-/Gln n=8.
Body composition
In order to assess changes in fat mass and lean mass throughout the monitoring period, body composition was determined by DXA at the commencement of HFD treatment and at 18 weeks of age. All treatment groups exhibited an increase in fat mass as a percentage of body weight between the two time points, along with reduced lean mass as a percentage of body weight (Figures 2C and 2D). Interestingly, these changes were of greater magnitude in WT mice than in Snord116-/- mice. However, no effects of glutamine supplementation on fat or lean mass changes were seen in either genotype.
Furthermore, glutamine supplementation had no effect on masses of excised adipose tissue deposits (Figures 2E and 2F) or individual organs (data not shown) in either WT or Snord116 -/- mice.
Food intake
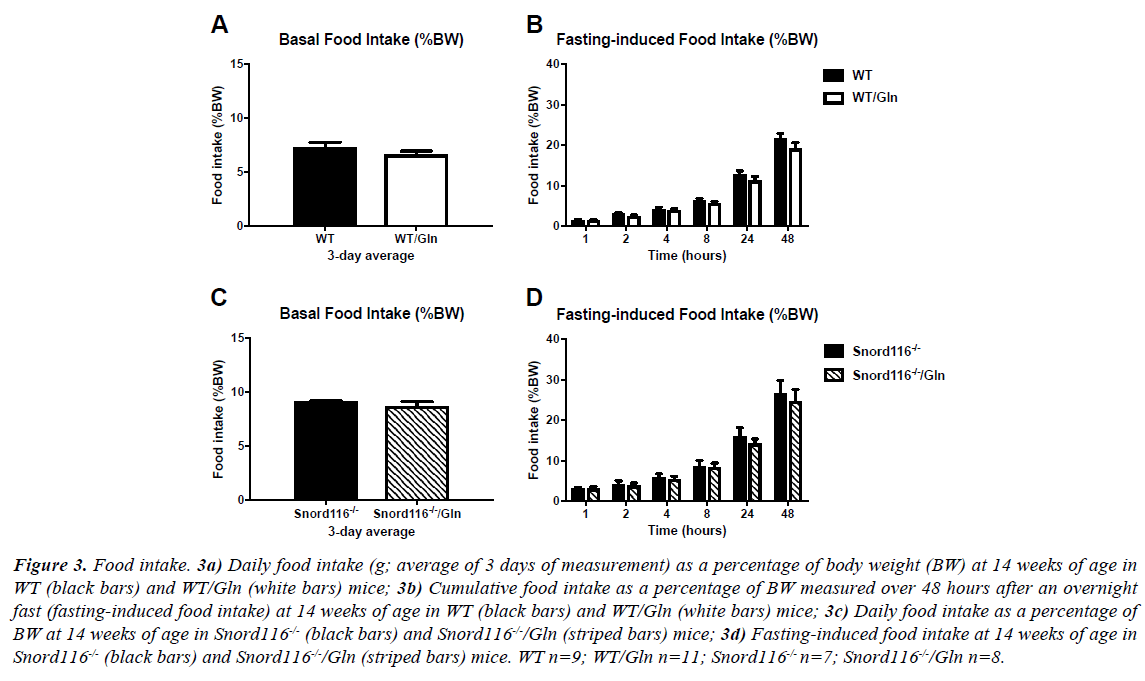
There was no difference in spontaneous or fasting-induced food intake between WT mice with and without glutamine supplementation (Figures 3A and 3B). As previously shown [24], food intake is generally higher in Snord116 -/- mice than WT, but this elevated spontaneous and fasting-induced food intake was unaffected by glutamine supplementation in Snord116 -/- mice (Figures 3C and 3D).
Figure 3: Food intake. 3a) Daily food intake (g; average of 3 days of measurement) as a percentage of body weight (BW) at 14 weeks of age in WT (black bars) and WT/Gln (white bars) mice; 3b) Cumulative food intake as a percentage of BW measured over 48 hours after an overnight fast (fasting-induced food intake) at 14 weeks of age in WT (black bars) and WT/Gln (white bars) mice; 3c) Daily food intake as a percentage of BW at 14 weeks of age in Snord116-/- (black bars) and Snord116-/-/Gln (striped bars) mice; 3d) Fasting-induced food intake at 14 weeks of age in Snord116-/- (black bars) and Snord116-/-/Gln (striped bars) mice. WT n=9; WT/Gln n=11; Snord116-/- n=7; Snord116-/-/Gln n=8.
Glucose homeostasis
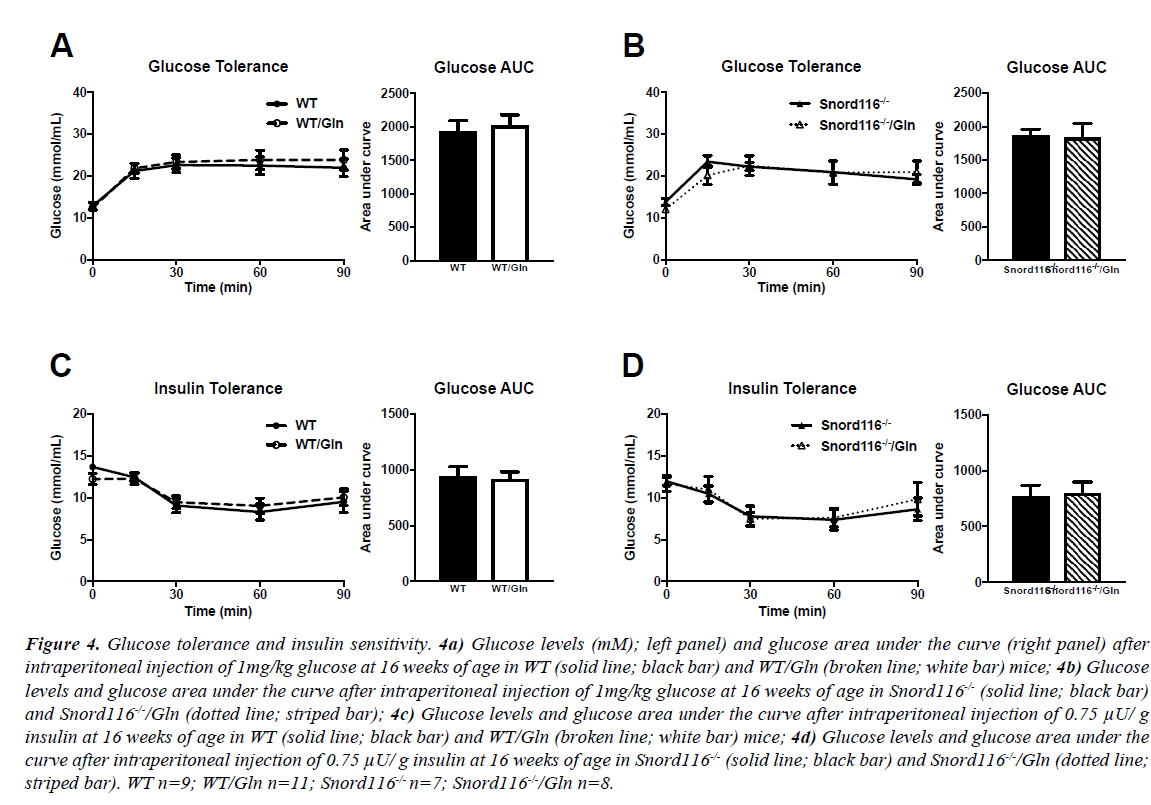
Blood glucose levels after a 5-hour fast were similar between all genotypes and treatment groups. During GTT, blood glucose levels in WT mice increased from baseline and stayed elevated throughout the 90-minute procedure, irrespective of treatment (Figure 4A, left panel). Glucose area under the curve was also unaffected by glutamine supplementation (Figure 4A, right panel). Similarly, glucose levels after injection rose in Snord116 -/- mice and remained above fasting levels (Figure 4B, left panel). There was no difference in glucose curve or in glucose area under the curve between Snord116 -/- mice treated or untreated with glutamine (Figure 4B, right panel).
Figure 4: Glucose tolerance and insulin sensitivity. 4a) Glucose levels (mM); left panel) and glucose area under the curve (right panel) after intraperitoneal injection of 1mg/kg glucose at 16 weeks of age in WT (solid line; black bar) and WT/Gln (broken line; white bar) mice; 4b) Glucose levels and glucose area under the curve after intraperitoneal injection of 1mg/kg glucose at 16 weeks of age in Snord116-/- (solid line; black bar) and Snord116-/-/Gln (dotted line; striped bar); 4c) Glucose levels and glucose area under the curve after intraperitoneal injection of 0.75 μU/ g insulin at 16 weeks of age in WT (solid line; black bar) and WT/Gln (broken line; white bar) mice; 4d) Glucose levels and glucose area under the curve after intraperitoneal injection of 0.75 μU/ g insulin at 16 weeks of age in Snord116-/- (solid line; black bar) and Snord116-/-/Gln (dotted line; striped bar). WT n=9; WT/Gln n=11; Snord116-/- n=7; Snord116-/-/Gln n=8.
The intraperitoneal injection of insulin led to a drop in blood glucose levels in all groups. There were no differences within genotypes between groups with or without glutamine supplementation, either in glucose curve or area under the curve (Figures 4C and 4D).
Indirect calorimetry
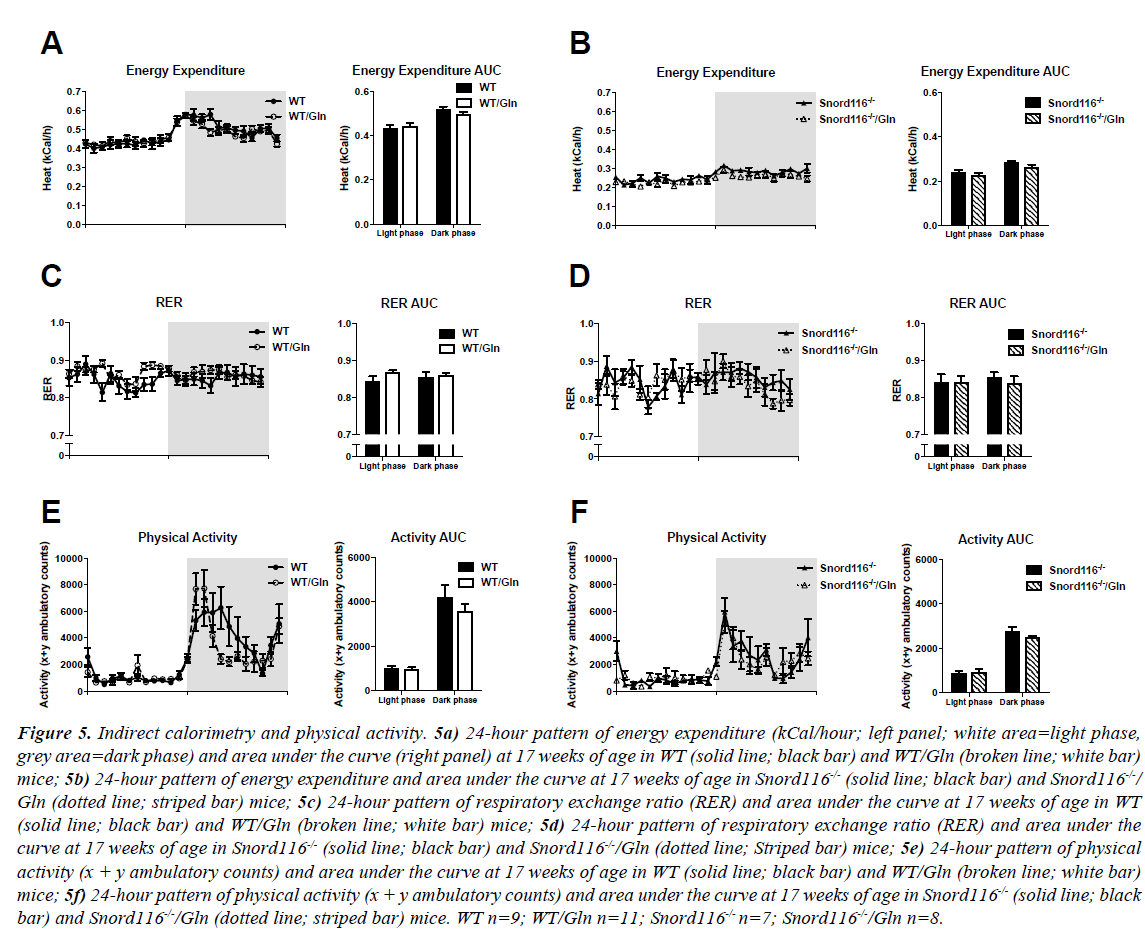
In human studies, glutamine supplementation has been shown to have a positive effect on energy expenditure after a meal. To assess its effects on 24-hour energy expenditure, substrate utilisation and physical activity in mice, indirect calorimetry and continuous activity monitoring were performed.
All study groups displayed a diurnal pattern of energy expenditure, with more energy expended in the dark phase than in the light phase. Snord116-/- mice showed reduced energy expenditure compare to WT, however, no effect of glutamine supplementation on energy expenditure was observed in either WT or Snord116 -/- mice, respectively (Figures 5A and 5B).
Figure 5: Indirect calorimetry and physical activity. 5a) 24-hour pattern of energy expenditure (kCal/hour; left panel; white area=light phase, grey area=dark phase) and area under the curve (right panel) at 17 weeks of age in WT (solid line; black bar) and WT/Gln (broken line; white bar) mice; 5b) 24-hour pattern of energy expenditure and area under the curve at 17 weeks of age in Snord116-/- (solid line; black bar) and Snord116-/-/ Gln (dotted line; striped bar) mice; 5c) 24-hour pattern of respiratory exchange ratio (RER) and area under the curve at 17 weeks of age in WT (solid line; black bar) and WT/Gln (broken line; white bar) mice; 5d) 24-hour pattern of respiratory exchange ratio (RER) and area under the curve at 17 weeks of age in Snord116-/- (solid line; black bar) and Snord116-/-/Gln (dotted line; Striped bar) mice; 5e) 24-hour pattern of physical activity (x + y ambulatory counts) and area under the curve at 17 weeks of age in WT (solid line; black bar) and WT/Gln (broken line; white bar) mice; 5f) 24-hour pattern of physical activity (x + y ambulatory counts) and area under the curve at 17 weeks of age in Snord116-/- (solid line; black bar) and Snord116-/-/Gln (dotted line; striped bar) mice. WT n=9; WT/Gln n=11; Snord116-/- n=7; Snord116-/-/Gln n=8.
No clear diurnal pattern was discernible in respiratory exchange ratio (RER), an indicator of fuel source and there were also no effects of glutamine treatment in RER within each genotype (Figures 5C and 5D).
In line with the circadian pattern of energy expenditure, physical activity was low in the light phase and elevated in the dark phase in all genotypes and treatment groups. There was no difference in physical activity between mice receiving glutamine and those not receiving it in either genotype (Figures 5E and 5F).
Discussion
Daily dietary glutamine supplementation had no effect on body weight gain, body composition, food intake, energy expenditure, and substrate oxidation and glucose homeostasis in C57Bl/6 mice. Nor did it have an influence on these parameters in a murine model of hyperphagia, the Snord116 knockout mouse model on the same background.
Despite the fact that oral glutamine administration has been shown to stimulate GLP-1 secretion in humans [13], we found no evidence of increased satiety in mice receiving glutamine. Total daily food intake and periodic fasting-induced food intake were unchanged between treated and untreated WT mice. To further assess the effects of glutamine administration on feeding, a murine model of hyperphagia was investigated.116 is an imprinted gene cluster implicated in the neurodevelopmental genetic disorder PWS in humans (characterised by hyperphagia and endocrine dysfunction) and has the homologue Snord116 in mice [24]. Snord116 knockout mice differ from WT in that they have increased spontaneous food intake and increased fastinginduced food intake [22,24,26,27]. However in the current study, similar to WT, there was no difference in food intake between treated and untreated Snord116 knockout mice. It may be that the GLP-1-secretory effects of glutamine are transient, and that chronic administration does not produce continuously high levels; or GLP-1 levels may increase but not to sufficient extent to have a prolonged suppressive effect on food intake. Alternatively, this may be a human-specific effect. As GLP-1 levels cannot be determined with great accuracy in mice, this question cannot be answered at this point.
Glutamine supplementation had no effect on fasting glycaemia in either WT or Snord116 knockout mice. Similarly, there was no effect of glutamine on glycaemia during insulin tolerance or glucose tolerance tests, suggesting that glucose homeostasis in animals on HFD is unaffected by long-term glutamine administration and again suggesting that GLP-1 levels are not affected.
As glutamine is involved in regulating fatty acid oxidation, it was of interest to examine the effect of glutamine on RER, an indicator of substrate utilisation. Although an increase in RER could theoretically be predicted from glutamine’s known role as an inhibitor of fatty acid oxidation, we found no difference between treatment groups in overall 24-hour RER or in either the light or dark phase.
A recent pilot study investigated glutamine supplementation as a potential weight loss therapy in 6 women, with participants experiencing, on average, ~2.8 kg of weight loss during the 4 week treatment period [16]. Though these results seem promising, the fact that neither participants nor researchers were blinded to supplement in this study highlights that further investigations are needed to clarify the effects of this amino acid in humans.
The results of the present study support findings from a previous investigation into glutamine supplementation in rodents, which did not find an effect of treatment on body composition in earlyweaned mice [18]. They did, however, differ from those of the report of Opara et al., which observed reduced body weight and an attenuation of hyperglycaemia in glutamine-supplemented mice [17]. This discrepancy could possibly be explained by the fact that mice of a different genetic background were investigated, and/or because mice in the current study were slightly older than those of Opara et al. at the time of testing.
Our study did not detect any positive effects of glutamine supplementation such as weight loss, improved glycaemia or lean body mass development [16]. Further, it also did not detect the increased satiety (as measured by periodic food intake) that had been hypothesised based on the GLP-1-stimulating property of oral glutamine. This could indicate that glutamine is only of therapeutic use in glutamine-deficient critically ill patients or animals. The mice in the current study, although overweight from consuming a HFD, did not benefit from glutamine supplementation, suggesting that glutamine may only be important in malnutrition or stressed disease states.
Conclusion
We found no evidence for an appetite-suppressing role for oral glutamine, either in normal or hyperphagic mice, nor did we detect an effect of glutamine on body weight or fat mass. Accordingly, glutamine is unlikely to be an effective antiappetite or weight loss candidate in either simple obesity or Prader-Willi syndrome.
Acknowledgements
We are grateful for the technical assistance of the staff of the Garvan Institute of Medical Research’s Biological Testing Facility.
Conflict of Interest
All authors declare no conflicts of interest
Funding source
This study was supported by a project grant from the National Health and Medical Research Council (NHMRC) of Australia (#1045166). LP was supported by an NHMRC postgraduate scholarship.
Author Contributions
SB, LP and HH designed the study. SB, LP, JA, and YQ conducted research. HH provided essential materials. SB, LP and JA performed statistical analysis. SB, LP, JA, YQ, LVC and HH interpreted the data. SB, LP and JA wrote the paper. SB, LP, JA, YQ, LVC and HH revised the manuscript. HH had primary responsibility for the final content.
References
- Lacey JM, Wilmore DM. Is glutamine a conditionally essential amino acid? Nutr Rev. 1990;48(8):297-309.
- Andrews FJ, Griffiths RD. Glutamine: Essential for immune nutrition in the critically ill. Br J Nutr. 2002;87(S1):S3-8.
- Tapiero H, Mathé G, Couvreur P, et al. II. Glutamine and glutamate. Biomed Pharmacother. 2002; 56(9):446-57.
- Roth E. Non-nutritive effects of glutamine. J Nutr. 2008;138(10): 2025S-31S.
- Xi P1, Jiang Z, Zheng C, et al. Regulation of protein metabolism by glutamine: implications for nutrition and health. Front Biosci (Landmark Ed). 2011;16:578-97.
- Windle EM. Glutamine supplementation in critical illness: evidence, recommendations and implications for clinical practice in burn care. J Burn Care Res. 2006;27(6):764-72.
- Novak F, Heyland DK, Avenell A, et al. Glutamine supplementation in serious illness: a systematic review of the evidence. Crit Care Med. 2002;30(9):2022-9.
- Heyland DK, Dhaliwal R, Day AG, et al. Reducing deaths due to oxidative stress (The REDOXS Study): Rationale and study design for a randomized trial of glutamine and antioxidant supplementation in critically-ill patients. Proc Nutr Soc. 2006;65(3):250-63.
- Andrews PJ, Alison A, David WN, et al. Randomised trial of glutamine, selenium, or both, to supplement parenteral nutrition for critically ill patients. BMJ. 2011;342:1542.
- Wischmeyer PE. Glutamine: The role in gut protection in critical illness. Curr Opin Clin Nutr Metab Care. 2006;9(5):607-12.
- Dos Santos R, Viana ML, Generoso SV, et al. Glutamine supplementation decreases intestinal permeability and preserves gut mucosa integrity in an experimental mouse model. J Parenter Enteral Nutr. 2010;34(4):408-13.
- Reimann F, Williams L, Da Silva XG, et al. Glutamine potently stimulates glucagon-like peptide-1 secretion from GLUTag cells. Diabetologia. 2004;47(9):1592-601.
- Greenfield JR, Farooqi IS, Keogh JM, et al. Oral glutamine increases circulating glucagon-like peptide 1, glucagon, and insulin concentrations in lean, obese, and type 2 diabetic subjects. Am J Clin Nutr. 2009;89(1):106-13.
- Sze L, Purtell L, Jenkins A, et al. Effects of a single dose of exenatide on appetite, gut hormones, and glucose homeostasis in adults with Prader-Willi syndrome. J Clin Endocrinol Metab. 2011;96(8):E1314-9.
- Iwashita S, Mikus C, Baier S, et al. Glutamine supplementation increases postprandial energy expenditure and fat oxidation in humans. J Parenter Enteral Nutr. 2006;30(2):76-80.
- Laviano A, Molfino A, Lacaria MT, et al. Glutamine supplementation favors weight loss in nondieting obese female patients. A pilot study. Eur J Clin Nutr. 2014;68(11):1264-6.
- Opara EC, Petro A, Tevrizian A, et al. L-glutamine supplementation of a high fat diet reduces body weight and attenuates hyperglycemia and hyperinsulinemia in C57BL/6J mice. J Nutr. 1996;126(1):273-9.
- Rogero MM, Borges MC, De Castro IA, et al. Effects of dietary glutamine supplementation on the body composition and protein status of early-weaned mice inoculated with Mycobacterium bovis Bacillus Calmette-Guerin. Nutrients. 2011;3(9):792-804.
- Gallagher RC, Pils B, Albalwi M, et al. Evidence for the role of PWCR1/HBII-85 C/D box small nucleolar RNAs in Prader-Willi syndrome. Am J Hum Genet. 2002;71(3):669-78.
- Schule B, Albalwi M, Northrop E, et al. Molecular breakpoint cloning and gene expression studies of a novel translocation t(4;15)(q27;q11.2) associated with Prader-Willi syndrome. BMC Med Genet. 2005;6:18.
- Duker AL, Ballif BC, Bawle EV, et al. Paternally inherited microdeletion at 15q11.2 confirms a significant role for the SNORD116 C/D box snoRNA cluster in Prader-Willi syndrome. Eur J Hum Genet. 2010;18(11):1196-201.
- Ding F, Li HH, Zhang S, et al. SnoRNA Snord116 (Pwcr1/MBII-85) deletion causes growth deficiency and hyperphagia in mice. PLoS One. 2008;3(3): e1709.
- Kim SJ, Miller JL, Kuipers PJ, et al. Unique and atypical deletions in Prader-Willi syndrome reveal distinct phenotypes. Eur J Hum Genet. 2012; 20(3):283-90.
- Qi Y, Louise P, Melissa F, et al. Snord116 is critical in the regulation of food intake and body weight. Sci Rep. 2016;6:18614.
- Dunn HG. The Prader-Labhart-Willi syndrome: A review of the literature and report of nine cases. Acta Paediatr Scand. 1968;57(S186):3-38.
- Qi Y, Purtell L, Fu M, et al. Ambient temperature modulates the effects of the Prader-Willi syndrome candidate gene Snord116 on energy homeostasis. Neuropeptides. 2017;6:87-93.
- Qi Y, Purtell L, Fu M, et al. Hypothalamus specific re-introduction of Snord116 into otherwise Snord116 deficient mice increased energy expenditure. J Neuroendocrinol. 2017.
- Kew S, Wells SM, Yaqoob P, et al. Dietary glutamine enhances murine T-lymphocyte responsiveness. J Nutr. 1999;129(8):1524-31.
