Research Article - Biomedical Research (2018) Volume 29, Issue 4
Effects of fissura ante fenestram sclerosis on hearing
Xu Xu1*, Wang Chen1, Wenjuan Yao2*, Yudong Ma1 and Bingtai Li1
1Department of Civil Engineering, Shanghai University, Shanghai, PR China
2Shanghai Institute of Applied Mathematics and Mechanics, Shanghai University, Shanghai, PR China
- *Corresponding Authors:
- Xu Xu
Department of Civil Engineering
Shanghai University, PR China
Wenjuan Yao
Shanghai Institute of Applied Mathematics and Mechanics
Shanghai University, PR China
Accepted date: November 20, 2017
DOI: 10.4066/biomedicalresearch.29-17-1167
Visit for more related articles at Biomedical ResearchAbstract
In this paper, a three-dimensional spiral cochlear Finite Element (FE) model was established by using PATRAN software based on the experimental data of synchronous light source imaging from Shanghai Institute of Applied Physics, Chinese Academy of Sciences. The acoustic-solid-liquid coupling analysis was carried out by NASTRAN software and the effects of fissura ante fenestra sclerosis on spiral cochlea were simulated in the paper. The satisfactory agreements between simulated results of ratio of displacement at 12 mm from Basilar Membrane (BM) to that at the vestibular window and experimental data in the literature confirm the validity of the FE model. Comparing the frequency response of the basilar membrane of normal and diseased ears, it can be found that greater hearing loss occurs at low frequency (100-600 Hz) and high frequency (2000-10000 Hz), but the hearing loss is less in the middle frequency. In this paper, the numerical simulation is used to make up for the lack of related researches and it provides a new way for clinical treatment of cochlear lesions.
Keywords
Spiral cochlea, Basilar membrane, Fissura ante fenestram, Otosclerosis, Hearing loss, Numerical simulation D
Introduction
Otosclerosis is a common disease that often causes binaural or monaural progressive hearing loss. According to the different parts of otosclerosis lesions, otosclerosis is divided into vestibular window type, cochlear and mixed type, of which the most common type is the vestibular window. The primary site of vestibular window type otosclerosis is located in the fissura ante fenestra that begins in the perilymphatic space between vestibule and scala vestibule and contains connective tissue fibers [1]. The vestibular is located in the posterior part of the through the ear canal and ossicular chain, and then the excitation is exerted on the vestibular window, So that the basilar membrane BM in the cochlea vibrates in the vertical direction because of the different pressure of the two both side lymph. Finally, the hair cell and nerve fiber on the BM transform the vibration of the BM into nerve impulses and transmit the nerve signals to the brain center to generate hearing [2]. Obviously, fissura ante fenestra hardening will have a great impact on hearing. Although the experimental study on the structure of the cochlea is very necessary, it is not possible to test the human cochlea under the consideration of ethical problems. Experiments on animal cochlea are not only time-consuming and labor-intensive, but there is a big difference between animal cochlear and human cochlea. For example, the predilection site of vestibular window type otosclerosis is located in the fissura ante fenestra, but it is a human-specific organ. Thus, it is an effective alternative method to establish a finite element model with the actual properties of biological materials based on the principle of human anatomy. Many experts and scholars at home and abroad have carried out a large number of studies in the field of clinical medicine, theoretical analysis and numerical analysis, and have achieved some research results [3-6], but have not involved the numerical simulation of cochlear sclerosis hearing behavior characteristics. In view of this, this paper established a spiral Finite Element (FE) cochlear model in line with the actual human ear. This FE model considered the fluid-structure interaction between the lymphatic fluid and the surrounding structures and simulated the mechanical response of the cochlea when the window fissure hardens, and revealed the mechanism of sound transmission and destruction of the cochlea.
Finite Element Model
FE model of the spiral cochlea
Based on the related knowledge of ear anatomy, CT scan images of healthy volunteers provided by Zhongshan Hospital Affiliated to Fudan University were digitized by self-compiled program. Combined with the experimental data of Shanghai Light Source of CAS and references [7-9], the real threedimensional spiral FE cochlear model containing vestibular, scala tympani, lymphatic fluid, vestibular window, round window, basement membrane and helicotrema was optimized and established by MSC PATRAN software. And the frequency response analysis, modal analysis and transient response analysis were carried out on FE model by using NASTRAN software.
In this paper, the geometric model of each part of the cochlea is as follows. The spiral inner ear has 2.5 period. The space inside cochlea was divided into three chambers by the Reissner’s Membrane (RM) and the BM: Scala Vestibule (SV), Scala Media (SM), and Scala Tympani (ST) and filled with viscous perilymphatic fluid. The geometric model of SV, ST, and helicotrema were referred to last published literature [10] and geometric data given by Rask [11,12]. The vestibular window and the round window were respectively established on the SV and the ST, and their geometric models were simplified to rectangles. The surface area of vestibular window and round window were 3.21 mm2 and 2.25 mm2. The total curved length of BM was 34 mm. The width of BM changed linearly from 0.1 mm at the base to 0.5 mm at the apex and the thickness also changed linearly from 7.5 μm at the base to 2.5 μm at the apex [9]. Similarly, the thickness of osseous spiral lamina also changed linearly from 7.5 μm at the base to 2.5 μm at the apex.
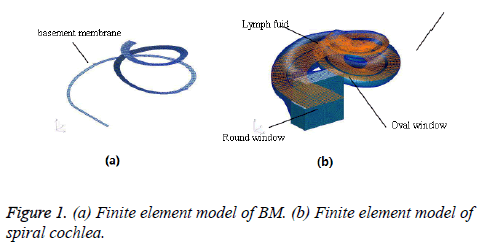
In this paper, the meshing of each part of cochlea was as follows. The lymph of SV, SM and ST were meshed by 124970 eight-noded hexahedral fluid elements. The vestibular window and round window were meshed by a total of 100 and 70 fournoded quadrangular two-dimensional membrane elements, respectively. The BM were meshed by 652 eight-noded hexahedral elements and 12 six-noded pentahedron elements and BM had the inner and outer supports or the spiral lamina and spiral ligament structure that were meshed by 3428 eightnoded hexahedral elements and 28 six-noded pentahedron elements. The finite element model of spiral BM and cochlea is shown in Figures 1a and 1b.
Material properties
The material properties for the cochlear structure are listed in Table 1. The Poisson's ratio of each part was 0.3, the structural damping coefficient was taken as 0.4, the viscosity of the fluid was assumed as 0.001 NS/m2, and the damping coefficient was 0.0001 S [13].The velocity of the lymph gland was 1400 m.s-1, and the density was 1000 kg.m-3 [14,15]. In this paper, the Young’s modulus of the BM was linearly decreased from the base to the apex.
| Modulus (MPa) | Density (kg/m3) | Thickness (mm) | |
|---|---|---|---|
| BM | 50 (base)-3 (apex) | 1200 | 0.0075 (base)-0.0025 (apex) |
| Osseous spiral lamina | 141 | 2200 | 0.1 |
| Oval window | 5.5 | 1200 | 0.1 |
| Round window | 0.2 | 1200 | 0.01 |
Table 1. Material properties used for cochlear structures.
Boundary conditions
The outer edges of round window and vestibular window were defined as the fixed constraint. The BM and Reissner’s membrane were fluid-structure coupling interfaces. The outer edges of SV, ST, and helicotrema were assumed as relative rigid boundary.
Verification of FE model
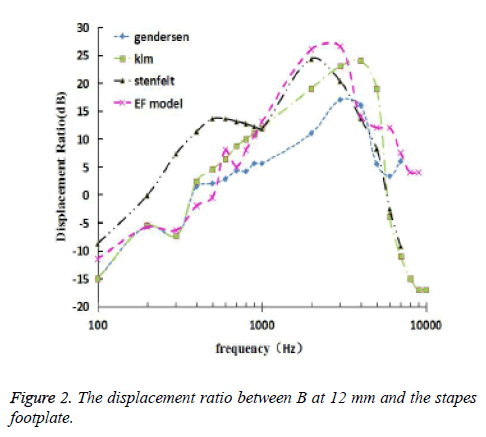
Gundersen and Stenfelt et al. had conducted experiments on human temporal bone [16,17]. Applying 90 dB (0.632 Pa) sound pressure on the surface of the vestibular window, the ratio of BM displacement amplitude at 12 mm from the base of BM to stapes footplate displacement amplitude changes with frequency was obtained. Meanwhile, the Phase difference relationship which varies with frequency between BM phase and stapes footplate was obtained.
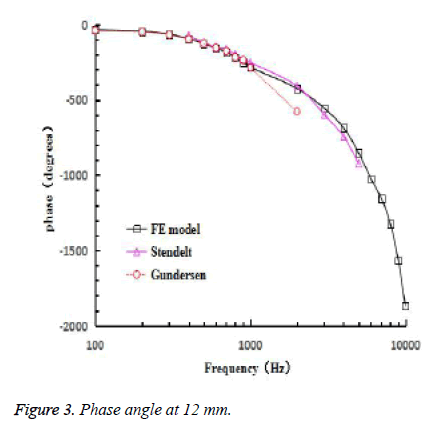
Because of the pressure gain of the external ear and middle ear, the 110 dB (6.32 Pa) sound pressure excitation was applied on the vestibular window, which was equivalent to the 90 dB (0.632) excitation on the surface of the external ear canal [18]. The frequency response curve of the 12 mm at the bottom of the BM and the stapes center was obtained by the FE model. The relationship of the ratio varying with frequency of displacement amplitude at 12 mm on BM and at the center of stapes footplate was calculated. Then, Figure 2 shows the experimental data of Gundersen et al., Stenfelt et al. and Kim et al. [16,17,19], and the results obtained from the FE model. Figure 3 shows the comparison between the calculated phase difference curves of this model and the experimental data of Gundersen et al. and Stenfelt et al [16,17].
It can be seen from Figure 2 that in the frequency range of 100 Hz-1000 Hz, the response curve of the ratio of displacements at 12 mm on BM and at the center of stapes footplate was in good agreement with the Gendersen and the Klm experimental curve was in good agreement with the Gendersen and Klm test curves. In the frequency range of 1000 Hz-5000 Hz, the numerical simulation curve was slightly higher than the Stenfelt test curve. In the frequency range of 5000 Hz-10000 Hz, the numerical simulation curve gradually deviated from the stefelt test curve, but still within a reasonable range. In this paper, the characteristic frequency was 4200 Hz, which is close to the Gundersen test curve. According to the frequency locus formula (1) given by Greenwood [20], the characteristic frequency at 12 mm is 3777 Hz, which is only 12% different from this paper.
x=35-16.7 log10 (0.006046 fm+1) → (1)
Figure 3 shows that in the 100 Hz-1000 Hz frequency range, the numerical simulation curve was slightly higher than the Gundersen trial curve. In the 1000 Hz-5000 Hz frequency range, the numerical simulation curve was close to the experimental curve of Stenfelt et al.
In summary, the numerical simulation data obtained by the FE spiral cochlear model in this paper are in agreement with the experimental data in the trend and the numerical value, so the finite element model established in this paper is reasonable.
Effects of fissura ante fenestram sclerosis on hearing
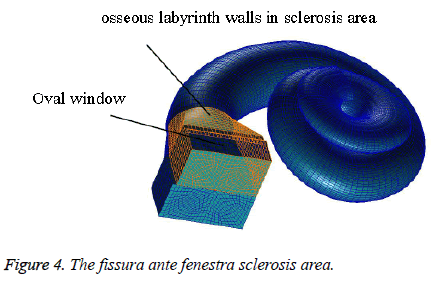
Pathology and numerical simulation of fissura ante fenestram sclerosis: The osseous labyrinth walls consist of three layers: the periosteal layer, the endogenous cartilage layer and the endosteal layer. The endogenous cartilage layer was characterized by retaining embryonic cartilage remnants, which are replaced by a new bone in the ear that had suffered from otosclerosis. Vestibular window type otosclerosis begins in the cartilage of fissura ante fenestra and Spreads to the surrounding bone. In the finite element model of this paper, by increasing the elastic modulus of the bone wall to simulate the fissura ante fenestra sclerosis, the sclerosis area was shown in the Figure 4. According to the literature [21,22], the elastic modulus of the bone was assumed as 100 times that of the normal physiological state.
Model calculation
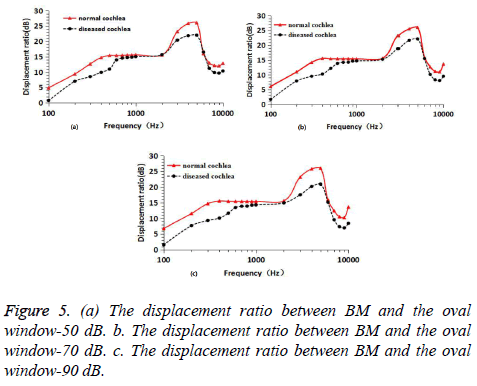
The sound field (fields) was established in PATRAN and different acoustic pressure (50 dB, 70 dB, 90 dB) excitation was applied to the cochlea. Then, the numerical simulation results were obtained by NASTRAN, which was shown in Figure 5.
Under 50 dB (0.00632Pa) sound pressure, the curve of displacement ratio of the BM and vestibular window following the change of frequency was calculated. When the BM displacement was presented as dB relative to the footplate displacement, an illustration commonly used by researchers in study of BM movement [23], the change of displacement value of the BM was displayed in Figure 5a. Compared with the displacement ratio curves of normal cochlea and diseased cochlea, in the low frequency (<600 Hz), the displacement ratio of diseased ear significantly decreased by 2.4-4.8 dB and the drop range decreased firstly then increased with increment of frequency. In the higher frequency range (600 Hz-2000 Hz), the displacement ratio decreased slightly, only 0.1-1 dB. At this moment, there is no obvious difference between the diseased and the normal cochlea. In the range around the characteristic frequency point (3000 Hz-5000 Hz), the displacement ratio decreased by 4 dB at most. In high frequency range (5000 Hz-10000 Hz), the decrease of displacement ratio was small and its maximum value was 2.3 dB [24,25].
Under 70 dB (0.0632 Pa) sound pressure, the curve of displacement ratio of the BM and vestibular window following the change of frequency were displayed in Figure 5b. Comparing the displacement curves of normal cochlear and diseased cochlea, we can see that at low frequency (<600 Hz), the displacement ratio decreased obviously, and then decreasing range was 3.1-5.2 dB. The decreasing amplitude decreased first and then increased with the increase of frequency. In the higher frequency range (600 Hz-2000 Hz), the displacement ratio decreased slightly, only 0.3-1.2 d. There was no significant difference between normal and hardened state. In the range around the characteristic frequency point (3000 Hz-5000 Hz), the displacement ratio decreased by 4.3 dB at most. In high frequency range (5000 Hz-10000 Hz), the decrease of displacement ratio was small and its maximum value is 4.1 dB.
Under 90 dB (0.632 Pa) sound pressure, the curve of displacement ratio of the BM and vestibular window against the change of frequency were displayed in Figure 5c. Comparing the displacement curves of normal cochlear and diseased cochlea, we can see that at low frequencies (<600 Hz), the displacement ratio obviously decreases, and the amplitude of the displacement is larger than that of 70 dB, with a decrease of 3.9-5.5 dB. The decreasing amplitude decreased first and then increased with the increase of frequency. In the higher frequency range (600 Hz-2000 Hz), the displacement ratio decreased slightly, only 0.6-1.7 dB. There was no significant difference between the hardened state and the normal state. In the range around the characteristic frequency point (3000 Hz-5000 Hz), the displacement ratio decreased by 5.6 dB at most. In high frequency range (5000 Hz-10000 Hz), the decrease of displacement ratio was small and its maximum value was 5 dB.
Conclusion
In this paper, a three-dimensional model of spiral cochlea which was in accordance with the actual human ear was established. The results from the model in this paper were in good agreement with experimental data, which confirmed the validity of the FE model. Based on the FE model and comparing the frequency-response curve of normal cochlea and diseased cochlea, the effect of fissura ante fenestra sclerosis was discussed. The results show that: under the different sound pressure (50 dB, 70 dB and 90 dB), the hearing loss caused by fissura ante fenestra sclerosis was basically the same, and with the increase of sound pressure, the hearing loss was also increased.
In the low frequency range, the diseased cochlea under different excitation both had obviously decreased hearing, and the maximum decrease was 5.5 dB. In the higher frequency range, the hearing slightly decreased with a maximum decrease as 1.7 dB. In the range around the characteristic frequency point, the hearing decreased by 5.6 dB at most. In high frequency range, the drop of hearing was decreased with increment of frequency and its maximum value was 5 dB.To sum, the hearing loss caused by fissura ante fenestra sclerosis was more in low-frequency stage (100-600 Hz) and highfrequency stage (2000-10000 Hz), but less in the intermediate frequency.
In this paper, the numerical simulation was used to make up for the lack of researches on the characteristics of the effects of fissura ante fenestra sclerosis on cochlea auditory behavior. In conclusion, the study in this paper provided a new way of thinking and theoretical support for clinical treatment of cochlear lesions.
Acknowledgements
We thank the support of the National Natural Science Foundation of China (11572186, 11272200).
References
- Xuepei L. Anatomy and clinical investigations on ear. Beijing Peking Univ Med Press 2007; 107-109.
- Wenjuan Y, Yiqiang C, Jianwei M. Numerical simulation on the dynamic behavior of the basilar membrane in the spiral cochlea. Biomed Res 2016; 27: 977-984.
- Nakajima HH, Merchant SN, Rosowski JJ. Performance considerations of prosthetic actuators for round-window stimulation. Hear Res 2010; 263: 114-119.
- Yiqiang C, Wenjuan Y. Mechanical model of round window membrane under reverse excitation. Appl Math Mech 2016; 37: 1341-1348.
- Yao W, Li B, Huang X, Guo C, Luo X, Zhou W, Duan M. Restoring hearing using total ossicular replacement prostheses-analysis of 3D finite element model. Acta Otolaryngol 2012; 132: 152-159.
- Elliott SJ, Ni G, Mace BR. A wave finite element analysis of the passive cochlea. J Acoust Soc Am 2013; 133: 1535-1545.
- Gan RZ, Yang F, Zhang XM. Mechanical properties of stapedial annular ligament. Med Eng Phys 2011; 33: 330-339.
- Zhang XL, Gan RZ. A comprehensive model of human ear for analysis of implantable hearing devices. IEEE Trans Biomed Eng 2011; 58: 3024-3027.
- Yao W, Li B, Huang X, Guo C, Luo X, Zhou W, Duan M. Restoring hearing using total ossicular replacement prostheses-analysis of 3D finite element model. Acta Otolaryngol 2012; 132: 152-159.
- Wenjuan Y, Yiqiang C, Jianwei M. Amplitude analysis of basement membrane. J Investig Med 2013; 61: 15.
- Raskandersen H, Erixon E, Kinnefors A. Anatomy of the human cochlea-implications for cochlear implantation. Cochl Impl Int 2011; 12: 14-22.
- Raskandersen H, Liu W, Erixon E. Human cochlea: anatomical characteristics and their relevance for cochlear implantation. Anat Rec (Hoboken) 2012; 295: 1791-2811.
- Yao WJ, Li X, Li W. Research on pathological changes of middle-ear and artificial stapes. J Med Biomed 2009; 24: 118-122.
- Zhang X, Gan RZ. Dynamic properties of human round window menmbrane in auditory frequencies running head: dynamic properties of round window membrane. Med Eng Phys 2013; 35: 310-318
- Steer RW, Li YT, Young LR. Physical properties of the labyrinthine fluids and quantification of the phenomenon of caloric stimulation. Third Symposium on the Role of Vestibular Organs in Space Exploration. Ames: NASA 1967; 409-420.
- Kondrachuk AV, Sirenko SP, Boyle R. Effect of difference of cupula and endolymph densities on the dynamics of semicircular canal. J Vestib Res Equilib Orient 2007; 18: 69-88.
- Wang ZL, Wang XL, Hu YJ. FEM Simulation of sound transmission based on integrated model of middle ear and cochlea. Chinese J Biomed Eng 2011; 30: 60-65.
- Gundersen T, Skarstein O, Sikkeland T. A study of the vibration of the basilar membrane in human temporal bone preparations by the use of the Mossbauer effect. Acta Otolaryngol 1978; 86: 225-232.
- Stenfelt S, Puria S, Hato N. Basilar membrane and osseous spiral lamina motion in human cadavers with air and bone conduction stimuli. Hear Res 2003; 181: 131-143.
- Jianwei M, Wenjuan Y. Research on the distribution of pressure field on the basilar membrane in the passive spiral cochlea. J Mech Med Biol 2014; 14: 1-22.
- Kim N, Homma K, Puria S. Inertial bone conduction: symmetric and anti-symmetric components. J Assoc Res Otolaryngol 2011; 12: 261-279.
- Greenwood DD. Critical bandwidth and the frequency coordinates of the basilar membrane. J Acoust Soc Am 1961; 33: 1344-1356.
- Nakajima HH, Dong WE, Rosowski JJ. Evaluation of round window stimulation using the floating mass transducer by intracochlear sound pressure measurements in human temporal bones. Otol Neurotol 2010; 31: 506-511.
- Chenkai D, Tao C, Mark WW, Rong ZG. Fixation and detachment of superior and anterior malleolar ligaments in human middle ear: Experiment and modeling. Hear Res 2007; 230: 24-33.
- Wittbrodt MJ, Steele CR, Puria S. Developing a physical model of the human cochlea using microfabrication methods. Audiol Neurotol 2006; 11: 104-112.
