Research Article - Current Trends in Cardiology (2017) Volume 1, Issue 2
Effect of ventricular relaxation performance on blood flow profiles in fontan circulation.
Hideaki Senzaki*, Kenji Sugamoto, Yoichi Iwamoto, Shun Matsumura, Hirotaka Ishido and Satoshi MasutaniPediatric Cardiology and Pediatrics, Saitama Medical Center, Saitama Medical University, Saitama, Japan
- *Corresponding Author:
- Hideaki Senzaki
Saitama Medical Center, Saitama Medical University, Saitama, Japan
E-mail: hsenzaki@saitama-med.ac.jp
Accepted on September 14, 2017
DOI: 10.35841/cardiology.1.2.49-54
Visit for more related articles at Current Trends in CardiologyAbstract
Flow profiles in the pulmonary veins (PVs) and arteries (PAs), Fontan conduit (conduit), and superior vena cava (SVC) were examined using phase-contrast magnetic resonance imaging. The relationship of the ratio of systolic forward flow volume and diastolic forward flow volume (FV-S/D) with ventricular relaxation time constant (tau) was then investigated. According to the flow profiles in the PVs, the forward flow volumes in diastole were dominant over those in systole. The FV-S/D was significantly negatively correlated with tau, not only in the PVs but also in the PAs and conduit. Moreover, tau was positively correlated with pulmonary wedge pressures, while pulmonary wedge pressures were significantly negatively correlated with FV-S/D in the PVs. In contrast, the FV-S/D in the SVC was also negatively correlated with tau, but the correlation coefficient of this relationship was lower than that of the other relationships. Lastly, the FV-S/D in the SVC correlated more significantly with the ejection fraction of the ventricle rather than with tau. On the basis of our findings, we believe that the flow profiles in the PVs are influenced by the ventricular relaxation performance. Moreover, the ventricular relaxation performance influences the flow profiles in the PAs and conduit, both of which are located upstream of pulmonary circulation. On the contrary, the flow profiles in the SVC seem to be influenced by ventricular contraction rather than ventricular relaxation.
Keywords
Pulmonary vein, Cava vena, Magnetic resonance, Ventricular relaxation, Fontan circulation
Background
The driving force of blood flow in Fontan circulation depends on pressure changes in the thoracic cavity due to respiration and the pump effects of the skeletal muscles, in addition to the systemic ventricular pump effect [1], although the latter is thought to be the chief driving force [2].
The single ventricular pump in Fontan circulation works not only to eject arterial blood into systemic circulation but also to suck the blood from the atrium into the systemic ventricle itself [3,4]. This sucking effect depends on the diastolic performance, especially active relaxation performance in the early diastole of the systemic ventricle. The present study aimed to investigate the relationship between ventricular relaxation performance and the blood flow profiles in the pulmonary veins (PVs) and arteries (PAs) and caval veins.
Patients and Methods
Patients
Consecutive patients with Fontan circulation who underwent magnetic resonance imaging (MRI) studies and cardiac catheterization studies for clinical reasons were analyzed as the Fontan group. The data of these patients were compared with those of patients who underwent repair for tetralogy of Fallot; this was the biventricular group. Patients with significant fenestration (more than 20% of cardiac output), veno-veno collateral vessels (more than 20% of cardiac output), arteriopulmonary collateral arteries (more than 25% of cardiac output), and/or significant atrio-ventricular valve regurgitation (more than 20% of regurgitation fraction) were excluded from the Fontan group. Additionally, patients with anomalous systemic venous anatomy with azygous continuation and absence of the inferior vena cava were excluded. In the case of double superior vena cava (SVC), venous flow was measured in the left and right SVCs and the sum was quantified as the SVC flow. Similarly, patients with tricuspid valve regurgitation or pulmonary valve regurgitation wherein the regurgitation fraction exceeded 30%, artificial atrio-ventricular valve, or obscure MRI scans were excluded from the biventricular group. The heart rhythm of all the patients in both groups was sinus rhythm.
Magnetic resonance imaging
Cine MRI was performed using a 1.5-T scanner. A conventional phase-contrast sequence (25 phases) was used in a double oblique plane perpendicular to the dominant flow direction in each targeted vessel using the phase-contrast cine MRI technique. If patients were cooperative, the data were sampled for a period of about 25 s with breath-holding. Data were sampled for a period of about 2–2.5 min to rule out any respiratory effects in case of free breathing. All MRI examinations were conducted without tracheal intubation or positive-pressure ventilation. Blood flow volume curves were drawn in the right upper and lower and left upper and lower PVs and SVC in both groups and in the left (LPA) and right (RPA) pulmonary arteries and extra-cardiac conduit or intraatrial lateral tunnel (conduit) in the Fontan group. The peak of the flow volume (ml/s) in the systolic (FV-S) and diastolic phases (FV-D) were measured in each vessel. The mean of FVS and FV-D in the upper and lower PVs was used as the FV-S and FV-D of the right and left PVs.
Cardiac catheterization data
The ventricular pressure was recorded using the catheter-tipped manometer system with the patient under general anesthesia or local anesthesia and awake. The descent of the ventricular pressure curve was regressed, and ventricular relaxation time constant (logistic tau) [5,6] values were calculated with nonzero asymptote using a custom-made software.
Statistical analysis
Data are described as mean with standard deviation (SD). Samples were compared using Student’s t-test, and the relationships between parameters were analyzed using Pearson’s correlation analysis. A p value <0.05 was set as the level of statistical significance. Analyses were performed using standard statistical software (SPSS for Windows, version 24; SPSS Inc., IBM Company, Chicago, IL, USA).
Results
Patients
MRI was performed on 41 consecutive patients after Fontan compression. Finally, 33 patients who met the inclusion criteria were enrolled.
The data of these patients were compared to those of 7 patients who underwent repair for tetralogy of Fallot who comprised the biventricular group. Demographic and hemodynamic data are shown in Table 1.
| Fontan ) | group (n=33 | Biventricular group (n=7) | ||
|---|---|---|---|---|
| Heart anomaly | SV | 14 | repaired TOF | 7 |
| DORV | 6 | |||
| TA | 3 | |||
| PA with IVS | 3 | |||
| HLHS | 3 | |||
| d-TGA | 1 | |||
| CCTGA | 1 | |||
| Type of Fontan | APC | 1 | ||
| LT | 27 | |||
| EC | 5 |
Table 1: Patient demographic and hemodynamic data in Fontan and Biventricular groups.
Blood flow profiles in each vessel
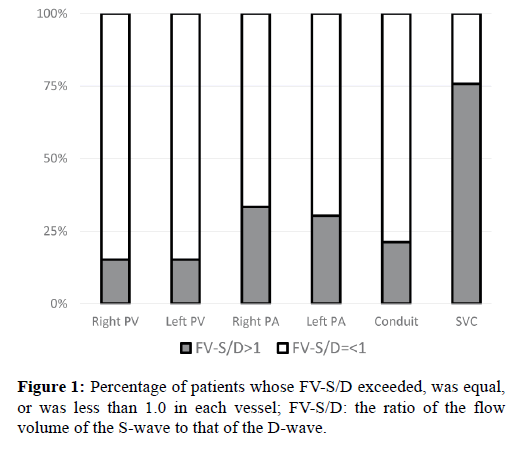
The peaks of flow volume in each vessel are shown in Table 2. In approximately 85% patients, the FV-S to FV-D (FV-S/D) ratio in the right and left PVs was equal to or less than 1.0 (Figure 1).
| Fontan group | Biventricular group | p | |||
|---|---|---|---|---|---|
| MRI data | Age at MRI (years) | 9.0 (4.7) | 7.6 (5.0) | 0.48 | |
| Right PV | S | 29.0 (15.6) | 27.5 (21.0) | 0.91 | |
| D | 36.7 (17.5) | 36.4 (26.6) | 0.99 | ||
| S/D | 0.83 (0.25) | 0.74 (0.034) | 0.64 | ||
| Left PV | S | 22.7 (9.89) | 23.6 (16.5) | 0.87 | |
| D | 30.8 (17.2) | 50.9 (51.8) | 0.084 | ||
| S/D | 0.81 (0.25) | 0.73 (0.76) | 0.64 | ||
| Right PA | S | 23.4 (10.6) | |||
| D | 25.9 (13.5) | ||||
| S/D | 0.94 (0.20) | ||||
| Left PA | S | 20.0 (7.99) | |||
| D | 23.1 (10.0) | ||||
| S/D | 0.96 (0.39) | ||||
| Conduit | S | 26.2 (10.8) | |||
| D | 32.5 (16.8) | ||||
| S/D | 0.89 (0.29) | ||||
| SVC | S | 24.4 (13.1) | 41.9 (14.9) | 0.0049 | |
| D | 20.9 (11.9) | 46.4 (11.6) | <0.001 | ||
| S/D | 1.19 (0.22) | 0.93 (0.31) | 0.02 | ||
| Ejection fraction | 0.45 (0.08) | ||||
| Catheterization data | CVP (mmHg) | 10.3 (2.6) | 10.4 (3.55) | 0.95 | |
| Tau (m) | 21.5 (4.7) | 19.8 (1.88) | 0.42 |
Table 2: MRI and catheterization data of the Fontan and biventricular groups.
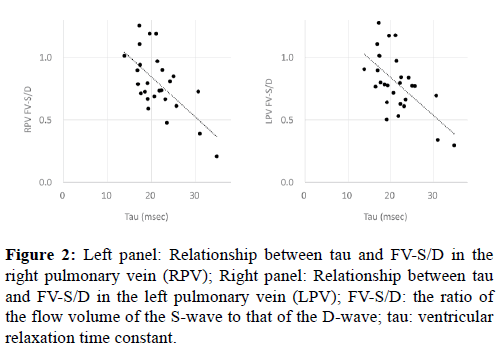
As shown in Figure 2, the FV-S/D ratio in the PVs and tau were negatively correlated (right PV: p<0.001, r=-0.65; left PV: p<0.001, r=-0.58).
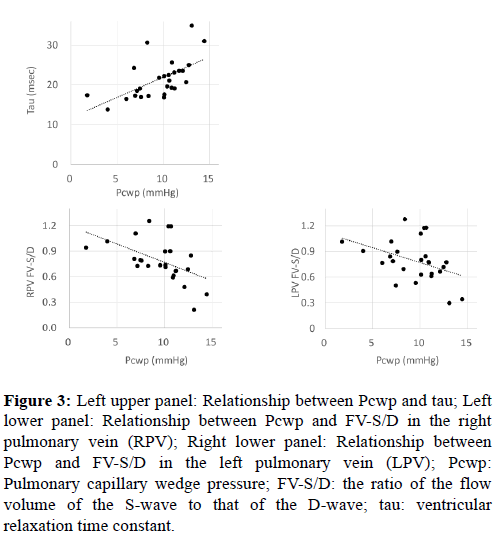
Moreover, as shown in Figure 3, tau and the pulmonary capillary wedge pressure (Pcwp) were positively correlated and the Pcwp and FV-S/D in the PVs were negatively correlated (p<0.001, r=0.62 and p=0.0010, r=-0.50, respectively). Further, in approximately 70% and 80% of the patients, the FV-S/D ratios in the PAs and conduit were equal to or less than 1.0, respectively (Figure 1).
Figure 3: Left upper panel: Relationship between Pcwp and tau; Left lower panel: Relationship between Pcwp and FV-S/D in the right pulmonary vein (RPV); Right lower panel: Relationship between Pcwp and FV-S/D in the left pulmonary vein (LPV); Pcwp: Pulmonary capillary wedge pressure; FV-S/D: the ratio of the flow volume of the S-wave to that of the D-wave; tau: ventricular relaxation time constant.
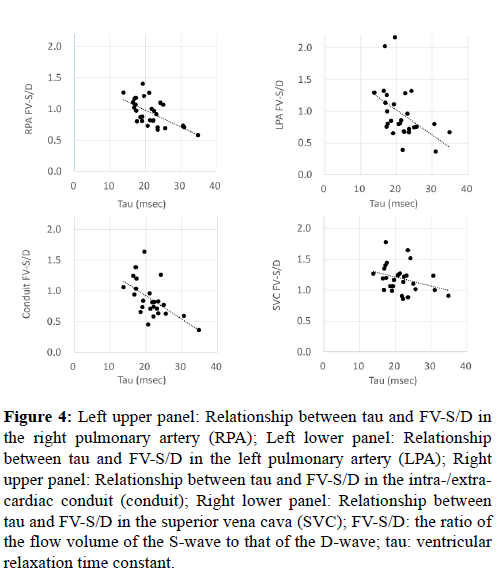
As shown in Figure 4, FV-S/D in the PAs or conduit and tau were negatively correlated (right PA: p<0.001, r=-0.62; left PA: p<0.0013, r=-0.49; conduit: p<0.001, r=-0.57).
Figure 4: Left upper panel: Relationship between tau and FV-S/D in the right pulmonary artery (RPA); Left lower panel: Relationship between tau and FV-S/D in the left pulmonary artery (LPA); Right upper panel: Relationship between tau and FV-S/D in the intra-/extracardiac conduit (conduit); Right lower panel: Relationship between tau and FV-S/D in the superior vena cava (SVC); FV-S/D: the ratio of the flow volume of the S-wave to that of the D-wave; tau: ventricular relaxation time constant.
In contrast to the correlations in the PVs, PAs, and conduit, in approximately 75% of patients, the FV-S/D ratio in the SVC exceeded 1.0 (Figure 1). Moreover, although FV-S/D in the SVC and tau were negatively correlated (p=0.037, r=-0.33), the correlation coefficient was significantly lower than that for the PVs, PAs, or conduit (p<0.001; analysis of covariance).
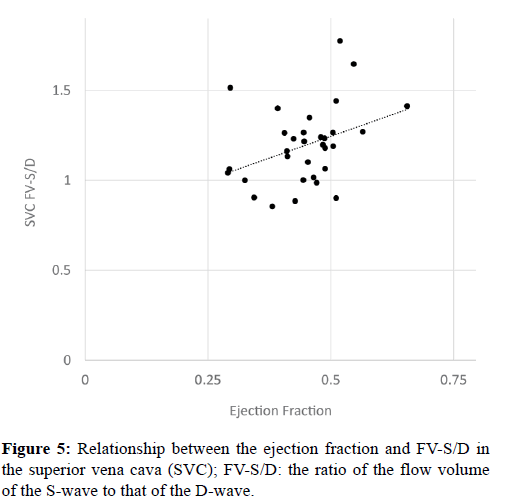
Instead, there was a positive correlation between the ejection fraction of the ventricle and FV-S/D in the SVC (Figure 5; p=0.018, r=0.37).
Discussion
Generally, the blood flow profiles in the PVs consist of two peaks the forward flow and reverse flow during the late diastolic phase (atrial reverse flow). The forward flow can be divided into the systolic forward flow (S-wave) and the diastolic forward flow (D-wave). The S-wave is often observed separately as an S1-wave and S2-wave. The S1-wave reflects the blood flow due to atrial diastole. Shariat et al. showed that the S2-wave reflects the blood flow from the lung due to contraction of the pulmonary ventricle [7], although the origins of the S2-wave were assumed to be varied until their study. The D-wave reflects the blood flow due to ventricular diastole and corresponds to the early diastolic flow (E-wave) in Doppler echocardiography. In Fontan circulation, the forward flow in the PVs consists of only S1-wave and D-wave, and the driving force of blood flow in pulmonary circulation was thought to depend on the ventricular diastolic performance.
On the contrary the driving force of the blood flow in the PAs or caval veins depends on not only the ventricular function but also the pressure changes due to respiration and the pump effect of the skeletal muscles [1]. Generally, elevated central venous pressure is observed in post-Fontan patients and is considered to be the cause of various complications. Therefore, understanding the flow profiles of the PAs and central veins may guide strategies to prevent these complications.
Flow profiles in the PVs
The S-wave in the Fontan group in this study comprised only the S1-wave and lacked the S2-wave, similar to what was found in the study by Shariat et al. [7]. Other studies of normal biventricular circulation using MRI or Doppler echocardiography reported that the peak flow velocity or peak flow volume of the S-wave is almost equal to or dominant over that of the D-wave [8,9]. In our study, as shown in Table 1 and Figure 1, FV-D tended to be dominant to FV-S in the Fontan group, a finding that agrees with that of previous reports [10].
We found a significant negative correlation between FV-S/D in the PVs and tau (Figure 2). Moreover, FV-S/D in the PVs and Pcwp were significantly negatively correlated and Pcwp and tau were significantly positively correlated (Figure 3). Reduction of the ventricular sucking effect is considered to induce an increase in atrial pressure, and this along with a reduction in atrial compliance promotes a decrease in FV-S and increase in FV-D. In normal biventricular circulation, an increased D-wave and decreased S/D ratio were observed in the initial stage of diastolic dysfunction, during which the value of tau was prolonged but the atrial pressure was not elevated [11]. In this initial stage of diastolic dysfunction, the blood flow induced by atrial kick (A-wave) is dominant over the early diastolic inflow (E-wave) in the trans-mitral flow (abnormal relaxation pattern). The ventricular inflow in Fontan circulation is reported to relatively shift to the latter portion of diastole with a large atrial contribution, which lowers the E/A ratio as a result [12,13]. Moreover, the isovolumic relaxation time or tau has been reported to be worse in post-Fontan patients than in patients with normal biventricular circulation [13,14]. The findings of the current study showed that the abnormal relaxation (prolonged tau) may directly cause elevation of atrial pressure in post-Fontan patients, although abnormal relaxation is thought to be the initial stage of diastolic dysfunction in patients with normal biventricular circulation. Thus, even minor abnormalities of ventricular relaxation may affect pulmonary and central venous circulation in post-Fontan patients.
Flow profile in the PAs and conduit
In 70–80% of patients, the FV-S/D in the PAs and conduit were equal or to less than 1.0 (Figure 1), and the D-wave was dominant over the S-wave (Table 2). The negative correlation between FV-S/D in the PAs or conduit and tau (Figure 4) implies that the ventricular diastolic sucking effect contributes to the forward flow in the PAs and conduit. A previous study reported that the pulsation in the PAs in Fontan circulation was 56% in the lateral tunnel method and 31–35% in the extracardiac conduit method [15,16]. Parts of the right atrial wall in the lateral tunnel were thought to contribute to the pulsation observed in the lateral tunnel method [16]. This pulsation could not be distinguished from that induced by the downstream sucking effect. However, ventricular relaxation seems to contribute to the blood flow in the PAs or conduit, because a negative correlation was observed between FV-S/D in the PAs or conduit and tau.
Flow profile in the SVC
The flow profile in the SVC differed considerably from that in the PVs, PAs, or conduit: in approximately 75% patients, the FV-S/D in the SVC exceeded 1.0 (Figure 1), and the negative correlation coefficient between FV-S/D in the SVC and tau was lower than that for the other vessels. These findings imply that the blood flow in the SVC is influenced by other factors in addition to ventricular relaxation. We thought one of these other factors might be the pushing effect of ventricular contraction. This is because we observed a positive correlation between the ejection fraction of the ventricle and FV-S/D in the SVC (Figure 5). The distribution volume in the lower half of the body is considered to be larger than that in the upper half of the body [4,17]. Therefore, the peripheral vascular bed in the lower half of the body serves as a reservoir, and the blood flow in the conduit from the lower half of the body is affected more by the sucking rather than the pushing effect of the ventricle. On the contrary, the peripheral vascular bed in the upper half of the body has much lower compliance, so the blood flow in the SVC from the upper half of the body is affected by the pushing effect rather than the sucking effect of the ventricle.
Limitations
A previous study reported that the driving force of blood flow in Fontan circulation depends not only on the ventricular pump effect but also the pressure change in the thoracic cavity due to respiration [18]. The effects of respiration were not considered in this study. However, the flow profile in the SVC was different from that in the other vessels despite all of them being in the same thoracic cavity. Therefore, we believe these differences in flow profiles indicate other effects than respiration.
Conclusion
Diastolic flow is prominent in the PV flow profile in post- Fontan patients. The flow profile in the PVs was found to be influenced by the ventricular relaxation performance. Moreover, the ventricular relaxation performance influenced the flow profile in the PAs and intra-/extra-cardiac conduit, located upstream of pulmonary circulation. However, the flow profile in the SVC seemed to be influenced by ventricular contractility rather than ventricular relaxation.
References
- Hjortdal VE. Effects of exercise and respiration on blood flow in total cavopulmonary connection: a real-time magnetic resonance flow study. Circulation. 2003;108:1227-31.
- Fogel MA. The nature of flow in the systemic venous pathway measured by magnetic resonance blood tagging in patients having the fontan operation. J Thorac Cardiovasc Surg. 1997;114:1032-41.
- Senzaki H. Cardiac rest and reserve function in patients with Fontan circulation. J Am Coll Cardiol. 2006;47:2528-35.
- Liang F. Hemodynamic performance of the Fontan circulation compared with a normal biventricular circulation: a computational model study. Am J Physiol Heart Circ Physiol. 2014;307:H1056-72.
- Senzaki H.Comparison of ventricular pressure relaxation assessments in human heart failure: quantitative influence on load and drug sensitivity analysis. J Am Coll Cardiol. 1999;34:1529-36.
- Senzaki H, Kass DA. Analysis of isovolumic relaxation in failing hearts by monoexponential time constants overestimates lusitropic change and load dependence: mechanisms and advantages of alternative logistic fit. Circ Heart Fail. 2010; 3:268-76.
- Shariat M. Pulmonary vein flow pattern in children with bidirectional cavopulmonary connection or Fontan circuit. Pediatr Radiol. 2012;42:211-4.
- Hu P. Noncontrast SSFP pulmonary vein magnetic resonance angiography: impact of off-resonance and flow. J Magn Reson Imaging. 2010;32:1255-61.
- Ayabakan C, Ozkutlu S. Normal patterns of flow in the superior caval, hepatic and pulmonary veins as measured using Doppler echocardiography during childhood. Cardiol Young. 2003; 13:143-51.
- Rydberg A.Pulmonary venous blood flow pattern in patients with univentricular hearts following total cavo-pulmonary connection. Clin Physiol. 1998;18:131-8.
- Kerut EK, McIlwain E, Nishimura RA. Grade I diastolic dysfunction and elevated left ventricular end-diastolic pressure: Mitral Doppler inflow, pulmonary vein atrial reversal, and the M-mode mitral B-bump. Echocardiography. 2017.
- Eicken A. Characteristics of Doppler myocardial echocardiography in patients with tricuspid atresia after total cavopulmonary connection with preserved systolic ventricular function. Int J Cardiol. 2007;116:212-8.
- Penny DJ. The early response of the systemic ventricle during transition to the Fontan circulation—an acute hypertrophic cardiomyopathy? Cardiology in the Young. 2008; 2:78-84.
- Penny DJ, Rigby ML, Redington AN. Abnormal patterns of intraventricular flow and diastolic filling after the Fontan operation: evidence for incoordinate ventricular wall motion. Br Heart J. 1991;66:375-8.
- Klimes K. Pulmonary and caval blood flow patterns in patients with intracardiac and extracardiac Fontan: a magnetic resonance study. Clin Res Cardiol. 2007;96:160-7.
- Senzaki H. Reconsideration of criteria for the Fontan operation. Influence of pulmonary artery size on postoperative hemodynamics of the Fontan operation. Circulation. 1994;89:266-71.
- Liang F. Transient hemodynamic changes upon changing a BCPA into a TCPC in staged Fontan operation: a computational model study. ScientificWorldJournal. 2013;2013:486815.
- Wei Z. Respiratory Effects on Fontan Circulation During Rest and Exercise Using Real-Time Cardiac Magnetic Resonance Imaging. Ann Thorac Surg. 2016;101:1818-25.
