Research Article - Biomedical Research (2016) Health Science and Bio Convergence Technology: Edition-I
Effect of source wavelength on second derivative of finger photoplethysmogram in healthy young female volunteers
Revati Shriram1,4, Betty Martin2, Sundhararajan M3 and Nivedita Daimiwal41Research Scholar, Department of Electronics and Communication Engineering, Sathyabama University, Chennai, India
2Sathyabama University, Chennai, India
3Bharath University, Chennai, India
4Cummins College of Engineering for Women, Pune, India
- *Corresponding Author:
- Revati Shriram
Research Scholar Department of Electronics and Communication Engineering Sathyabama University India
Accepted on October 28, 2016
Abstract
Background: Non-invasive methods for screening and diagnosis are the field with fast growing interest which leads to various biological signal measurements like Photoplethysmogram (PPG) and pressure pulse. PPG monitoring is widely used in the healthcare as this single pulse study can provide wide physiological information non-invasively such as oxygen saturation, heart rate, blood pressure (continuous and cuff less), blood volume, arterial stiffness and respiration rate. First and second derivatives of PPG provide important information about the arterial stiffness and vascular health of the person.
Aim: This paper explains the design and development of prototype with RED LED (660 nm) and IR LED (860 nm) as a source and OPT 101 as a detector. Second derivative related indices of PPG (for RED LED and IR LED) were calculated.
Materials and methods: Study was carried out on 15 healthy female subjects without any known history of blood pressure and blood glucose; aged between 19-23 years.
Results and conclusion: Amplitude of PPG obtained from RED LED is smaller than the amplitude of PPG obtained from IR LED. Comparative analysis of first and second derivative of the PPG obtained from RED light source and IR light source is discussed by the authors. It was observed that various parameters studied from second derivative are the ‘Normalized Values’, so effect of change in the amplitude of the PPG signal obtained from RED LED and IR LED get nullified in this study (P>0.05). Though IR source based reflective type of sensor related study can be useful in future for the brain vascular health assessment.
Keywords
Photoplethysmogram, Optical sensor, Second derivative, RED LED, IR LED, Vascular aging.
Introduction
Non-invasive screening methods are gaining more interest day by day. Photoplethysmogram (PPG) is an optical, low cost, non-invasive and simple method to access various cardiovascular parameters such as Heart Rate (HR), Respiratory Rate (RR), Blood Pressure (BP) [1-5], Blood Volume (BV), Oxygen Saturation (SpO2) and Arteriosclerosis. Stiffness of arteries is the early pathological sign of arteriosclerosis. For acquisition of PPG following type of probe can be used.
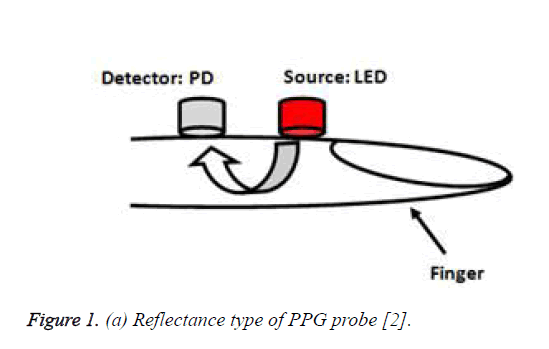
Reflectance type of PPG Probe: In this type of probe source and detector are placed on the same side of the measurement site. Such a type of probe can be used to capture PPG from any measurement site. As shown in Figure 1.
Figure 1. (a) Reflectance type of PPG probe [2].
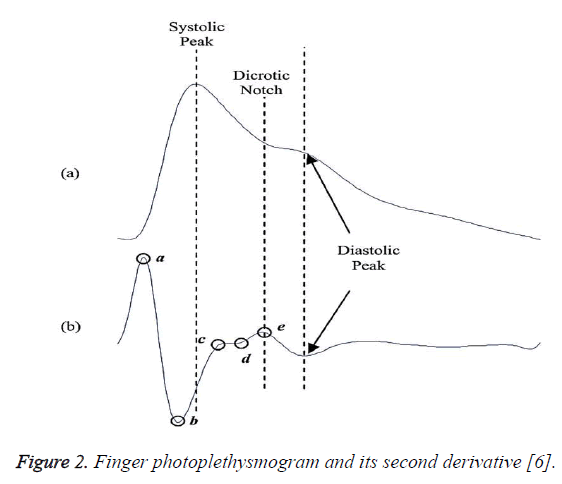
Transmittance type of PPG Probe: In this type of probe, source and detector are placed at the opposite side of the measurement site. Such a type of probe has limited application and can be used to capture PPG from a body site with lesser muscle thickness. Figure 1: (a) Reflectance Type of PPG Probe [2] Authors have developed a reflective type of PPG probe with visible and infrared light source of wavelength 660 nm (RED LED) and 860 nm (IR LED) and OPT 101 is used as a detector. [1] Finger PPG was captured by using RED and IR LED light source. Then first derivative of the finger PPG was calculated. First derivative is differentiated once again to obtain second derivative. Figure 2 shows the finger PPG and its second derivative waveform. Various ‘High’ and ‘Low’ indices of second derivative of finger PPG are named as ‘a’, ‘b’, ‘c’, ‘d’ and ‘e’ respectively.
Figure 2. Finger photoplethysmogram and its second derivative [6].
Materials and Methods
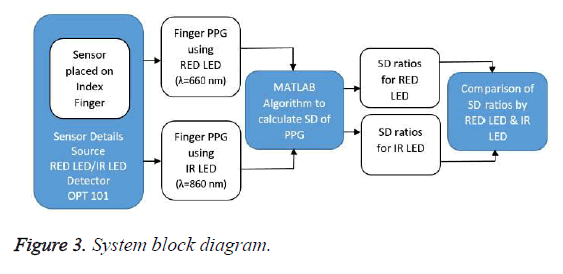
System block diagram: Visible and IR light based reflective type of photoplethysmographic sensor developed by the authors was applied on to an index finger of a subject. Signal conditioning (pre and post amplification and filtering) of the PPG obtained from a finger was carried out before taking its derivatives. Figure 3 shows the system block diagram.
Beer-Lambert’s law: Optical PPG acquisition is based on Beer-Lambert’s law of spectroscopy. It states that the light travelling through a uniform medium with absorptive substance reduces exponentially with the optical path length through the medium and absorptive coefficient [1]. During the acquisition of PPG light travels through various mediums such as; skin, bone, tissue, skin pigmentation, venous blood and arterial blood.
I(z) = I0exp (−μαz) → (1)
Where I(z) is the attenuated intensity as a function of the distance z in the tissue, I0 is the incident intensity and μa is the optical absorption coefficient at the wavelength of interest [4]. The penetration depth of light is dependent on its wavelength and infrared light reaches deeper tissues than visible light [5]. So infrared light source of wavelength 860 nm can be used to capture PPG from various body sites [5] and RED light source of wavelength 660 nm is limited to finger PPG. Amplitude of the PPG signal obtained from RED LED is smaller than the amplitude of PPG obtained from IR LED [1].
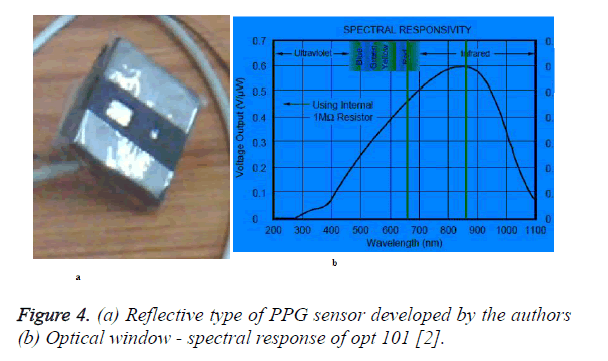
PPG sensor specifications: Figure 4 (a) shows the reflective type of PPG sensor developed by the authors and Figure 4 (b) shows the optical window of the detector OPT 101 (Burr- Brown Silicon diode). Table 1 shows the specifications of the sensor developed by the authors.
Figure 4. (a) Reflective type of PPG sensor developed by the authors (b) Optical window - spectral response of opt 101 [2].
| Sensor | Requirements |
|---|---|
| Visible Light Source | 660 nm (5 mm LED) |
| Infrared Light Source | 860 nm (5 mm LED) |
| Detector | OPT 101 (Si-Burr Brown Diode) |
| Sensor Casing | Black Polyurethane |
| Optode Distance | 1 cm for Red Light Source |
| 1.5 cm for Infrared Light Source | |
| Supply | 10V DC-Signal Conditioning Circuit |
| 5V, 2 KHz AC to source | |
| Application | |
| Measurement Site | Only at peripheral sites for Visible Light Source (660 nm) |
| Anywhere on the human body from head to toe for Infrared Light Source (860 nm). | |
Table 1: Design specifications of PPG Sensor [2].
Subjects and data acquisition procedure
Finger PPG using RED and IR LED was recorded at Cummins College of Engineering for women for fifteen healthy female volunteer subjects aged between 19-23 years. All subjects were in the seated position, their index fingers lying comfortably on the table, with NO nail colour application on the fingers. None of the volunteers had known history of blood pressure or blood glucose.
Derivatives of finger PPG
Original PPG waveform is much flatter, so analysis of such waveform is a bit difficult. To support better analysis, differentiation of original waveform is carried out; such a waveform is known as first derivative (FD). FD of a PPG signal is useful to understand pulse wave change and plays very important role in the vascular health prediction. FD of PPG is also known as ‘Velocity Photoplethysmogram’ (VPG) and has limitation on understanding pulse energy. So to understand process of pulse energy, FD is once again differentiated. Such a signal is known as second derivative (SD) of PPG signal. SD of PPG is also known as Acceleration Photoplethysmogram’ (APG) [7].
Need of FD and SD of PPG: Blood propagation velocity depends on factors such as; intra-vascular pressure, thickness of artery, elasticity, diameter and compliance. These parameters change with an age and various diseases. Finally, this affects the blood circulation in human body. SD related study of PPG waveform can be used as a simple and cheaper technique for various arterial studies. FD is the blood velocity indicator at that site. ‘Crest Time’ and ‘Delta T’ are the two most common measurements carried out from FD waveform. SD related studies are more commonly carried out than the FD studies. It is the indicator of acceleration of blood at a given site. SD waveform parameters are interconnected with state of cardiovascular system parameters such as; elasticity modulus and vascular compliance [8,9]. Following are the five ‘High’ and ‘Low’ indices (four systolic and one diastolic) related to SD which are widely studied. [10-15]
• ‘a’: It is the base value for wave evaluation. This point is known as early systolic positive wave. It is the first positive extrema.
• ‘b’ : It gives the intensity of cardiac output. This point is known as early systolic negative wave. It is the first negative extrema.
• ‘c’ : It gives vascular compliance. This point is known as late systolic re-increasing wave. It is the second positive extrema.
• ‘d’ : It gives residual blood volume. This point is known as re-decreasing wave. It is the second negative extrema.
• ‘e’ : This point represents dicrotic notch. It is the third positive extrema on APG. Height of each extrema is measured from the baseline. Points above the baseline are treated as positive extrema’s; whereas points below the baseline are treated as negative extrema’s. Figure 2 shows the SD and various extrema’s indicated on the SD waveform. Based on these various maxima’s and minima’s of SD waveform, five normalized indices are calculated as follows: [6]
• ‘b/a’ Index: It is a very useful non-invasive index of arthrosclerosis. This ratio is directly correlated to the Farmington Risk Score, which is used to estimate the risk of cardiovascular heart diseases.
• ‘c/a’ Index: This index is the reflection of arterial stiffness. It is used to distinguish the heathy subjects from the subjects having blood pressure history.
• ‘d/a’ Index: Evaluation of vasoactive agents is carried out with the help of this index. It is again a reflection of arterial stiffness.
• ‘e/a’ Index: It reflects the decrease arterial stiffness.
• ‘(b-c-d-e)/a’ Index: It is also known as Ageing Index (AGI) and it is used to check the cardiovascular age of the subject.
Results
Study was carried out on healthy female subjects with age 21.18±1.22 years. Finger PPG recorded using RED LED and IR LED light source is first digitally filtered for noise removal. Then FD and SD of the filtered finger PPG were calculated. Widely used statistical properties such as ‘standard deviation’ and ‘mean’ were applied to the various second derivative ratios.
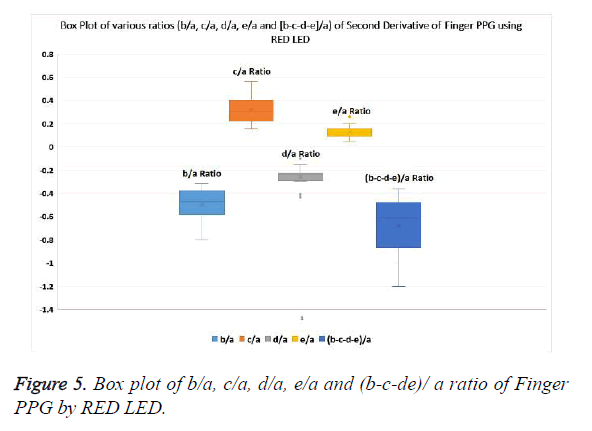
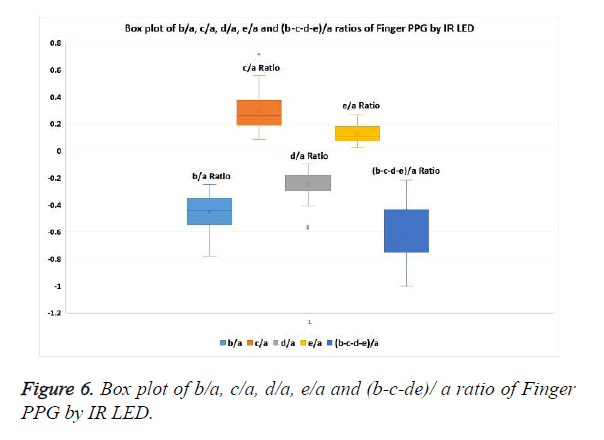
Variations observed in SD ratios for RED LED are: ‘b/ a’=-0.4869 ± 0.1361, ‘c/a’=0.3201 ± 0.113,‘d/a’=-0.2557 ± 0.0795, ‘e/a’=0.1263 ± 0.0561 and ‘(bc-d-e)/a’=-0.6777 ± 0.2497.
Variations observed in SD ratios for IR LED are: ‘b/ a’=-0.4498 ± 0.0909, ‘c/a’=0.3042 ± 0.1436,‘d/a’=-0.227 ± 0.07763, ‘e/a’=0.1587 ± 0.07534 and ‘(b-c-d-e)/a’=- 0.6859 ± 0.2033. Figures 5 and 6 show the box plot of second derivative ratios of finger PPG using RED LED and IR LED respectively.
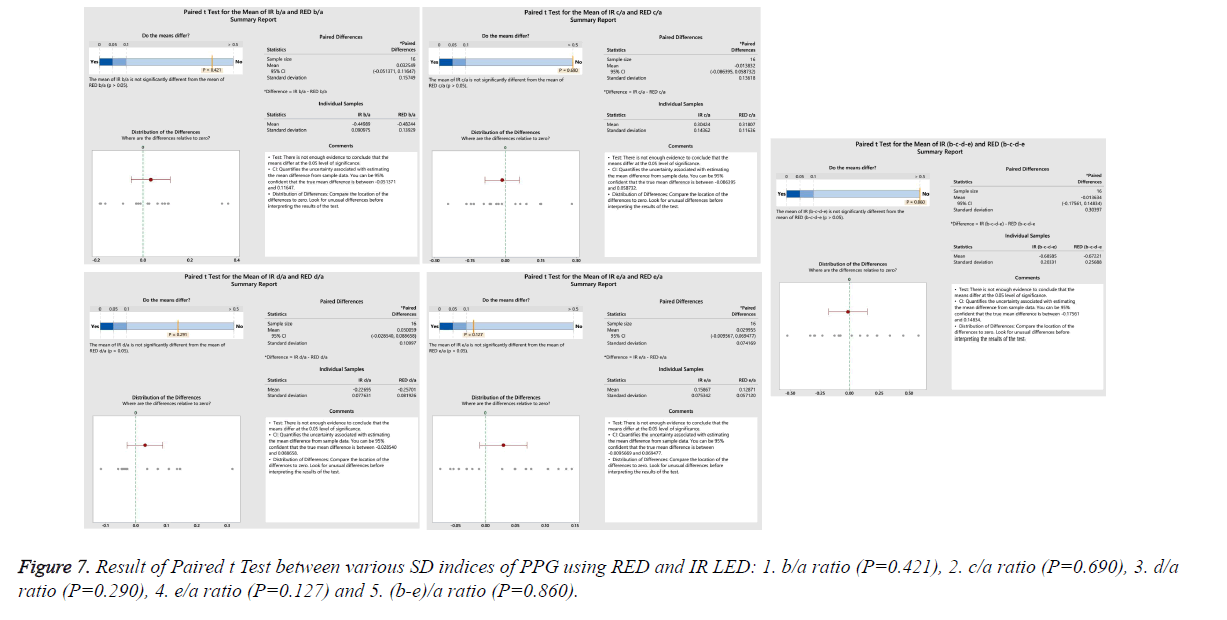
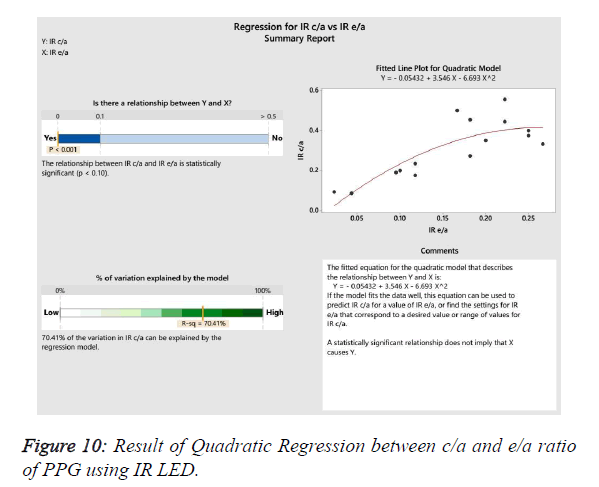
The amplitude of PPG acquired using RED LED is lower than the amplitude of PPG acquired using IR LED at the same measurement site. Various SD related indices obtained from RED LED & IR LED do not show statistical difference as the study was carried out on the ratios and not on the direct amplitude. Mean value of b/a, c/a, d/a, e/a and (b-c-d-e)/a for PPG using RED LED is not significantly different from the PPG using IR LED. Figures 7-10 shows the Minitab 17 based statistical analysis (paired t test) between the five indices (b/a, c/a, d/a, e/a and b-c-de/a) of SD of finger PPG using RED LED and IR LED with α=0.05.
Discussion
PPG signal consists of pulsatile AC (is in synch with HR and BP) and non-pulsatile DC component. AC and DC components of PPG signal varies in amplitude, shape and upstroke time with respect to the various measurement sites and or source wavelength (visible or infrared) used in the sensor design. Source wavelength is directly proportional to the penetration depth. PPG originates from optical property changes in the banana-shaped tissue path [10] between the source of light and the photo detector (μa in). At lesser intensity of source light; penetration of light is more for the infrared source than that of the visible light source. So to prevent saturation in the signal acquired; optode distance (1.5 cm) for the sensor with IR LED and OPT 101 is kept larger than the optode distance (1.0 cm) for the sensor with RED LED and OPT 101.
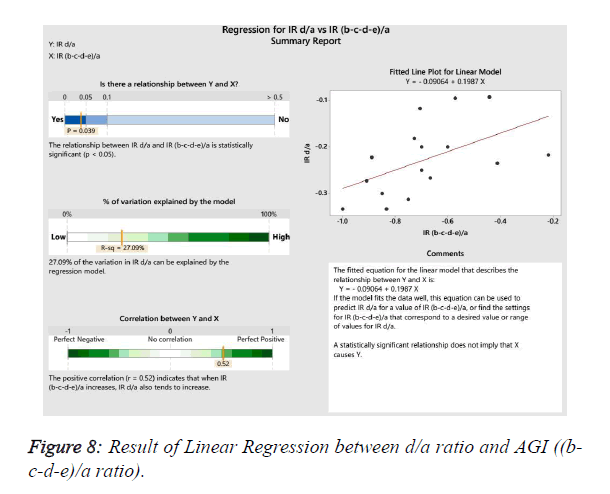
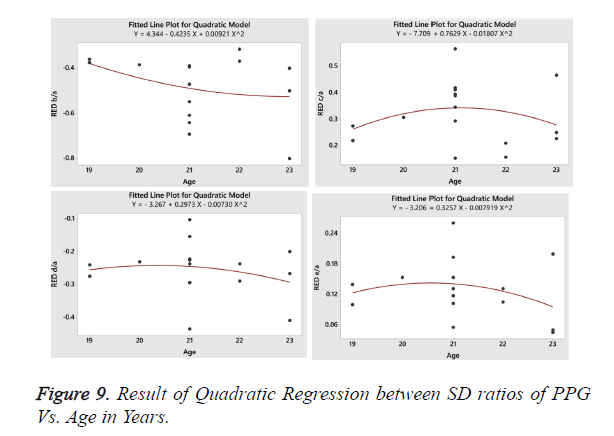
Now a day’s major population is affected by Diabetes (Blood glucose) which is known as a ‘Silent Killer’ as it affects patient’s vascular system. These days’ people are getting affected by diabetes at a young age (in early thirties). So studies related to the vascular health are becoming more important. SD related studies is one of the non-invasive, easy and cheaper method for vascular health prediction [11,12]. PPG waveform changes with an age and gets transformed into triangular shape from the wavy. Sensor developed by the authors is used for the preliminary study related to the vascular aging. FD of AC component of PPG has some non-acceptable variations. So FD of PPG is differentiated again (i.e. PPG is differentiated second time to obtain SD) to get better response and eliminate the noise. SD of PPG consists of five distinct parts; ‘a’ is an initial positive, ‘b’ is early negative, ‘c’ is reincreasing, ‘d’ is late redecreasing and ‘e’ is diastolic positive. Aging Index (AGI) is given by the ratio ‘(b-c-d-e)/a’, it gives the information about the cardiovascular age of the subject. AGI is positively correlated with the d/a ratio [13]. Figure 8 shows the correlation between AGI and d/a ratio obtained by the authors during the work carried out. ‘b’ and ‘d’ are very sensitive to intra-arterial pressure alterations. ‘b/a’ ratio has positive correlation with an age, whereas ‘d/a’, ‘c/a’, and ‘e/a’ ratios have negative correlation with an age [12]. The same kind of correlation was observed by the authors during the study carried out. Figure 9 shows the Quadratic Regression plot of SD indices vs. Age in years for fifteen healthy female volunteers.
Conclusion
As discussed in the earlier sections; IR light source based reflective type of PPG sensor can be used for capturing PPG from any human body site. It was observed that magnitude related information obtained from RED LED and IR LED is different [12]. But SD indices related information obtained from RED LED and IR LED is almost same. This shows that effect of source wavelength is not prominent during the SD related studies at peripheral sites; but plays important role if such a study needs to be carried out at a site with more thickness. SD ratios such as ‘c/a’, ‘d/a’ and ‘e/a’ reflect the arterial stiffness. Among these three parameters, same kind of variations were observed in ‘c/a’ and ‘e/a’ ratio with medium high correlation between the two parameters. For RED LED, p=0.006, R2=54.44%, Quadratic Regression Model Equation Y=0.3228–1.555 X+9.959 X2. For IR LED, p<0.001, Rsquare= 70.41%, Quadratic Regression Model Equation Y=-0.05432+3.546 X–6.693 X2. So to decrease computational complexity and the computational time any one of the ratio can be used for further study (as shown in Figure 10).
Extension of the current work would be the use of reflective type of IR LED based PPG sensor to capture ‘Cranial PPG’ (CPPG) [3,12]. Vascular nature at forehead differs from vascular nature at the finger. Correlation between SD ratios from CPPG and age can be found out and can be compared with the SD ratios from finger PPG. Thus obtained SD related ratios of CPPG can be used for the estimation of Cerebrovascular Stiffness’ or ‘Brain Aging’ [14]. This can be an easy, low cost, light weight, safer (no exposure to radiations) option to MRI related Brain Aging studies. For more accuracy and linearity Lasers can be used as a light source instead of RED/IR LED. But disadvantage of Lasers is it can be harmful to human body if used for continuous measurements over a longer time period. But for the reference, lesser literature is available on SD of cranial PPG as compared to the SD of finger PPG. So in future, developed algorithm should be applied at finger and or at cranial site to more number of healthy as well as unhealthy subjects with known Blood Glucose, Hypertension, Obesity and or Arrhythmia problems at early age (early thirties) or at later age (after sixties), when PPG waveform changes significantly.
References
- Shriram R, Sundhararajan M, Daimiwal N. Application of High & Low Brightness LEDs to Human Tissue to capture Photoplethysmogram at a Finger Tip. Int Confer ConverTechnol 2015.
- Shriram R, Shundhararajan M. Coherence analysis of pressure pulse and photoplethysmogram at various sites. Int J ApplEng Res 2015; 10: 14959-14968.
- Shriram R, Sundhararajan M, Daimiwal N. Cranial PPG Brain Signal based Cardiovascular Parameter Estimation. Int J Control Theor Appl. 2015; 8: 839-845.
- Elgendi M. On the analysis of fingertip photoplethysmogram signals. CurrCardiol Rev 2012; 8: 14-25.
- Qawqzeh Y, Reaz M, Ali M. The analysis of PPG contours in the assessment of atherosclerosis for erectile dysfunction subjects. WSEAS Transactions on Biology and Biomedicin.2010; 7.
- Mohamad R, Usman S, Mohd A, Reaz M. Second Derivatives of Photoplethysmography (PPG) for Estimating Vascular Aging of Atherosclerotic Patients. IEEE EMBS International Conference on Biomedical Engineering and Sciences. Langkawi 2012.
- Borik S. Cap Ivo: Measurement and Analysis Possibilities of Pulse Wave Signals. Biomed Eng 2013; 11.
- Jang D, Park J, Park S, Hahn M. A Morphological Approach to Calculation of the Second Derivative of Photoplethysmography. 10th IntConf Signal 2010.
- Usman S, Ali M, Reaz M, Chellapan K. Second Derivative of Photoplethysmogram in Estimating Vascular Aging among Diabetic Patients. Int Confer on Technical Postgraduates2009.
- Finkelstein J. Applicability of the Second Derivative Photoplethysmogram for Non-invasive Blood Pressure Estimation during Exercise. Pan Am Health Care Exchanges 2013.
- Ohmori K, Emura S, Takashima T. Risk factors of atherosclerosis and aortic pulse wave velocity. Angiology 2000; 51: 53-60.
- Pilt K, Meigas K, Temitski K, Viigimaa M. Second derivative analysis of foreheadphotoplethysmographic signal in healthy volunteers and diabetes patients. World Congress on Medical Physics and Biomed Eng 2012.
- Junichiro H, Kenichi C, Yohei A, Takuya N, Takayoshi O, Atsushi H, Michiko S, Mitsunobu M, Mari M, Tsutomu A,Yutaka I. Pulse wave velocity and the second derivative of the finger photoplethysmogram in treated hypertensive patients: their relationship and associating factors. J Hypertens 2002, 20:2415–2422.
- Ahn JM. Wave detection in acceleration plethysmogram. Healthc Inform Res 2015; 21: 111-117.
- Nur ALJ, Khairul AS, Siti NAMA. Acceleration plethysmogram based biometric identification. Int ConferBioSigAnal Proc Sys 2015; 16-21.
