Research Article - Journal of Clinical and Experimental Toxicology (2017) Volume 1, Issue 1
Determination of indoor formaldehyde concentration by portable sol-gel scanometric method.
Zohreh Mehrabadi1, Hossein Faghihian1*, Abdolreza Khajehzadeh2
1Department of Chemistry, Islamic Azad University, Shahreza Branch, Shahreza, Iran
2Department of Chemistry, Islamic Azad University, Darab Branch, Darab, Iran
- *Corresponding Author:
- Hossein Faghihian
Department of Chemistry, Islamic Azad University, Iran
Tel: +98 321-3292515
E-mail: faghihian@iaush.ac.ir
Accepted date: January 04, 2018
Abstract
Sol-gel scanometric method has several advantages, such as simplicity, high scanning speed, portability, short response time, limited interference, and easy immobilization of reactants, and has been used for determination of many compounds such as dopamine, hydrazine and bromocresol green. In this work, a simple and cost effective sol-gel scanometric method is developed for monitoring of formaldehyde concentration by a portable visual sampling device. The sol-gel containing entrapped formaldehyde was analyzed with software written in visual basic (VB 6) media to red, green and blue (RGB) values and the R, B and B values were obtained. The measurement is based on diffusion of formaldehyde into a transparent sol-gel and reaction with acetylacetone entrapped on the structure of the sol-gel impregnated with sensitive and selective β-diketones. After diffusion, the reaction between formaldehyde and the entrapped β-diketones produced yellow product, lutidine which was detected directly by scanometric method. The method did not require primary sample preparation and enabled screening by visual detection and quantitative measurement. The measurement system had a linear range of 2-20 mgL-1 with detecting limit of 0.1 mgL-1, lower than the maximum exposure concentrations of formaldehyde recommended by the Occupational Safety and Health Administration. The relative standard deviation at 5 mgL-1 was 4.3, 6.1 and 8.5% respectively for red, green and blue colors.
Keywords
Transparent sol-gel, β-diketones, visual detection, portable visual sampling.
Introduction
Formaldehyde can be emitted from various products such as pressed wood, particle boards and new constructions. In addition, formaldehyde is used in many industries and domestic processes including adhesives, electroplating, preservatives for wool, and in agriculture as insecticides in fresh vegetables [1]. Occupational exposure usually is in the limit from 0.1 to 5 mgL-1 in air, and levels from 0.01 to 0.1 mgL-1 are often found indoors like offices and homes [2,3]. A large number of techniques have already been used for evaluation of formaldehyde in air including spectrophotometry [4], HPLC [5], laser induced fluorescence spectroscopy [6], electrochemistry [7], conductometry [8], capillary electrophoresis [6] and enzyme-based biosensors [9-11]. All methods are limited by the attainable sensitivity and the need for bulky and expensive instrumentation. Therefore, development of a practical, quick and useful procedure for evaluating formaldehyde is essential. Sol-gels as a suitable support matrix are capable to trap sensing reagents due to their homogeneous nature, excellent optical transparency, and chemical and physical stable environment [11,12]. The sol-gel preparation is carried out at room temperature; therefore, the precursor alkoxide does hydrolysis and condensation and an optically transparent gel is produced. The polymeric network of the porous gel entraps selected reagents such as sensitive reagents for formaldehyde inside the network during the gelling process providing a transparent matrix being appropriate for visual detection. The produced gels are soft and flexible and can be cut to any needed size. They also can easily be cast into different shapes or thickness. The portable visual detecting devise use in this research does not require to the time-consuming sample preparation step, and does not need to solvent and extraction process. For high concentration of formaldehyde, a short exposure time was needed while for low concentration, a cumulative dose over longer exposure time such as a working day was used. Since the measurement is based on visual detection, the response time is reasonably short for the high concentration. For the low levels, over the exposure time, the chemical reaction giving rise to the color change is irreversible and the method permits evaluation of the cumulative dose [13,14]. The results indicated that the method established in this research permits the estimation of formaldehyde concentration in air below the limiting value regulated by occupational safety and health administration (0.75 mgL-1). Moreover, the method has been used for determination of a wide ranges of compounds as indicated in Table 3.
Methodology
Formaldehyde 37% (w/v) solution, acetylacetone, acetic acid, hydrochloric acid and ammonium acetate were purchased from Sigma-Aldrich (St. Louis, MO, USA), tetraethoxysilane (TEOS) was acquired from Merck (NJ 07033 USA), ethanol HPLC grade) was prepared from Fisher Scientific (3970 John's Suwanee, GA 30024 USA).
Preparation of formaldehyde in different phases
Formaldehyde solution: Formaldehyde stock solution (1 molL-1) was prepared by diluting 37% (w/v) solution. The standard solutions were daily prepared, by appropriate dilution of the stock solution with de-ionized water.
Gaseous formaldehyde: Gaseous standards of formaldehyde were prepared according to the method described by Dong and Dasgupta [8]. Aqueous solution of formaldehyde was employed to produce appropriate concentration of gaseous formaldehyde at equilibrium established at 20ºC by the following equation:
[HCHO(aq)] = 16650 [HCHO(g)]1.0798 1
Numerous formaldehyde solutions with different concentration were transferred in 50 mL polypropylene exposure tubes. The concentration of the formaldehyde solutions was adjusted to give the specified equilibrium concentrations of gaseous formaldehyde.
Hydrochloric Acid and Acetylacetone: Hydrochloric acid stock solution (1 molL-1) was prepared by diluting 37% w/v solution, standard working solution of hydrochloric acid was prepared by suitable diluting of the stock solution in deionized water.
To prepare acetylacetone solution, was prepared by mixing 0.50 g of ammonium acetate, 0.20 mL of acetic acid and 0.02 mL of acetylacetone were dissolved in 10 mL de-ionized water. The mixture was shaken until proper homogenization and was stored at 4ºC in dark to prevent darkening of the solution.
Sol-gel solution: Sol-gel solution was prepared by mixing TEOS, 0.04 molL-1 HCl solution, and ethanol in the ratio 2:1:2 (v/v). Then mixture was magnetically stirred for 2 h at room temperature. This solution was applied as the stock sol-gel solution throughout.
Sol-gel formaldehyde sensors: Sol-gel formaldehyde sensor was prepared by proper mixing of sol-gel and acetylacetone solutions (2:3 ratios). Then 500 μL of the formaldehyde sensing solution was carefully transferred into 2.0 mL disposable vial so that the solution did not stick on the vial walls. The mixture was left at room temperature for 30 min until a transparent gel containing trapped acetylacetone was formed. To prevent the evaporation of any components, the sol-gel was stored in a freezer. As blank sample for scanometry evaluation, in the same manner, a reference sol-gel was simultaneously prepared and stored under the same condition.
Apparatus
To measure the formaldehyde concentration, a CanoScan 4400F (Canon) scanner with a cold cathode fluorescent lamp (CCFL) and charge coupled device (CCD) as a light source and detection system were used for scanning of the samples. The CCFL was a three wavelength source for red, green and blue regions. The resolution of the scanner was regulated at 300 pixel per inch (ppi). The mechanism of scanning process usually is based on the reflection occurred by non-transparent materials, however, in the present study since the scanning material was a transparent non-turbid sol-gel, the response of the scanner was formed by combination of reflection and absorption of lights. The scanner resolution was adjusted to 300 pixels per inch (ppi) and the software written in VB 6 media converted the images obtained from scanning of the vials to red, green and blue (RGB) data.
Red, green and blue (RGB) color model: In RGB color system, red, green, and blue lights are additively combine to reproduce a wide array of colors and the color values are stored as integer numbers in the range 0 to 255. At this range, by encoding 256 distinct values a single 8-bit byte can be produced. In the RGB system, any color is regarded in the red, green and blue form and the (0, 0, 0) and (255, 255, 255) refer to black and white in order. In this system 16777216 colors can be made and by increasing the intensity of the colors, the color values are decreased. The color can be described by the following equation:
V = R + 256G + 2562B 2
Where, R, G, and B are red, green and blue values of the major colors. For black and white, V is equal to 0 and 16777216 respectively. By the following R, G and B values of V for any color can be calculated:
R = V mod 256 3
“mod” is a numeric function which refers the remainder when diving two numbers.
G= ((V - R) mod (2562 ))/256 4
B= (V - R - G ×256)/(2562) 5
One of the R, G and B color values that the same color as the solution is usually useless, because this value is often above 200, and does not significantly changed during the experiment (in the present study, the yellow color of the complex) [15]. In the present study after the scanning, the images were transferred into the computer and the color of each vial was analyzed by applying software written in VB 6 media by which the color belonged to each vial was analyzed based on the RGB system into R, G and B values. In the color analyzing programs, the specific area for analysis and the number of pixels that could be shown by this area was about 10000-300000, and the program was able calculate the average of these pixels. Therefore, the signal to noise ratio was increased very quickly. The color value difference for any color values was the difference between the color value of each color variable for the sample and the color variable blank [15,16].
In this method when the synthesized censor containing acetylacetone indicator is contacted with formaldehyde solution, the censor color change is scanned and then is analyzed by the used software. The software measure the mean number of the pixel for each images which is given as the outcome of the color model. The number of pixel are between 100000 to 300000.
The sensing performance of the sol-gel was optimized by changing of the variables and the concentration of the reagents used in sol-gel preparation, including acetylacetone, ammonium acetate and acetic acid. The optimizing process was conducted by changing one variable while other variables were constant. The concentration of ammonium acetate was optimized by changing its dose from 0.1 to 1.0 g. The acetic acid concentration varied from 0.05 to 1.0 mL, and the acetylacetone amount was changed from 0.01 to 0.1 mL.
Results and Discussion
Optimized value of different variables
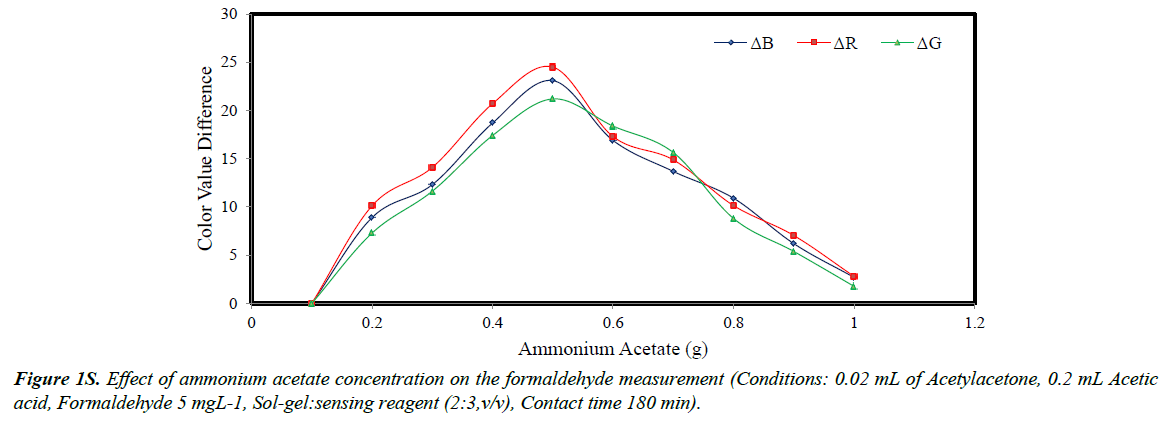
As mentioned in section “Optimizing the sensing process”, the concentration of ammonium acetate was optimized by changing its dose from 0.1 to 1.0 g. After preparation of solgel containing aqueous solutions of formaldehyde, the samples were scanned and their colors were analyzed by the software. The color value differences were plotted versus ammonium acetate concentrations (Figure 1S). It was concluded that with concentration lower than 0.5 g, the R, G and B values was increased to a maximum value and thereafter the parameters were lowered. The lower values obtained with higher concentrations was attributed to the occupation of the sol-gel bed spaces by ammonium of acetate Therefore, in the next experiments, 0.5 g of ammonium of acetate was constantly used.
In the structure of sol-gel, acetylacetone and acetic acid compete for occupation of the available spaces. Therefore, by increasing the amount of acetic acid, the number of empty spaces for acetylacetone significantly dropped and the R, G and B parameters are decreased (Figure 2S). The optimized value of acetic acid was 0.16 mL.
The color values the sol-gels containing from 0.01 to 0.1 mL of acetylacetone was plotted versus the volume of the reagent (Figure 3S). It was concluded that by increasing the acetylacetone concentration, the color values were sharply increased, and then suddenly decreased. The formation of the sol-gel depends on the concentration of acetylacetone; therefore, by increasing the acetylacetone concentration, the sol-gel was quickly formed leading to higher color values and at higher concentration the sol-gel became cloudy causing lower color change [14]. The optimized value of acetylacetone was 0.02 mL.
Optimized sol-gel to sensing reagent ratio
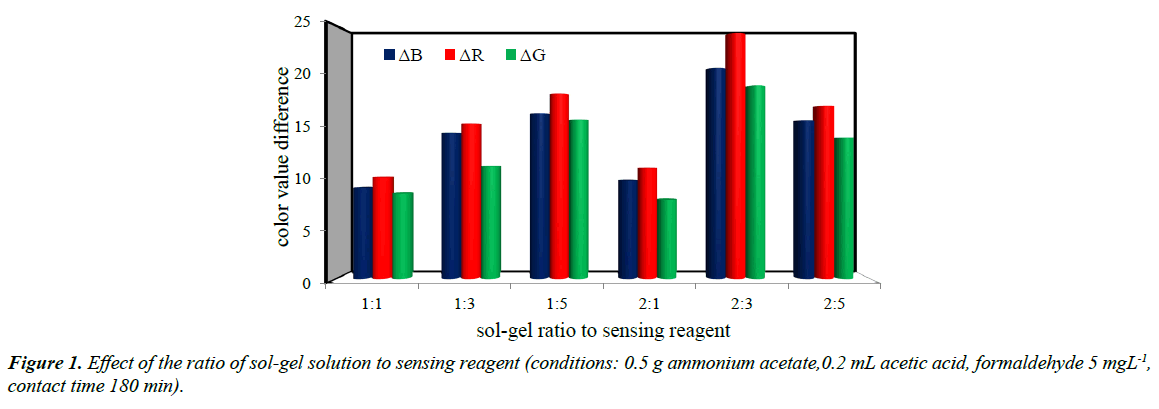
The appropriate parameters of each sol-gel formaldehyde sensor prepared with various ratios of sol-gel solution to acetylacetone were determined (Figure 1). It was concluded that by decreasing the ratio of sol-gel to acetylacetone below 2:3 a significant decrease was occurred in the measurement response. This can be attributed to the insufficient amount of acetylacetone which limited the progress of the reaction. Increasing the ratio of acetylacetone above 2:3 also decreased the response indicating that under this conditions, the sol-gel is more compact and a diffusion based problem occurred. A strong yellow band appeared at the surface of the sol-gel indicating that all the reaction was occurred in the localized near-rather than evenly through the sol-gel [14].
Optimized contact time
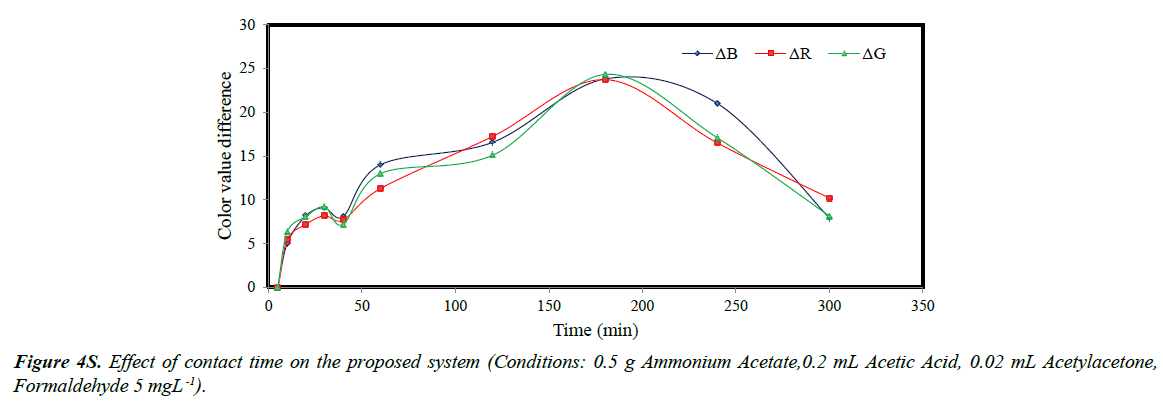
The color value change plotted versus contact time indicated that the value difference increased with increasing contact time and the maximum color value difference was observed and at 180 min (Figure 4S). The decrease obtained after 180 min was attributed to the destruction of sol-gel texture causing lower R, G and B parameters. Additionally, possible dispersion of color in the sol-gel lowered the sensitivity of the material.
Stability of sol-gel sensor
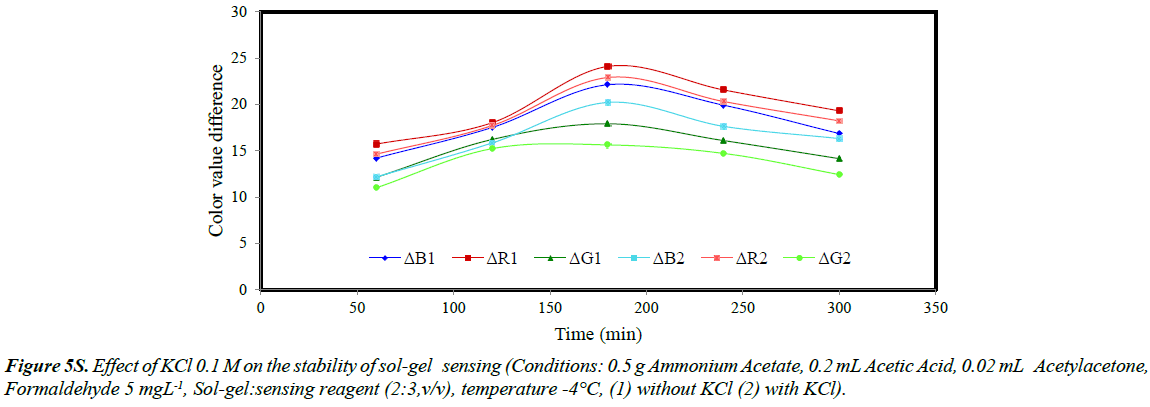
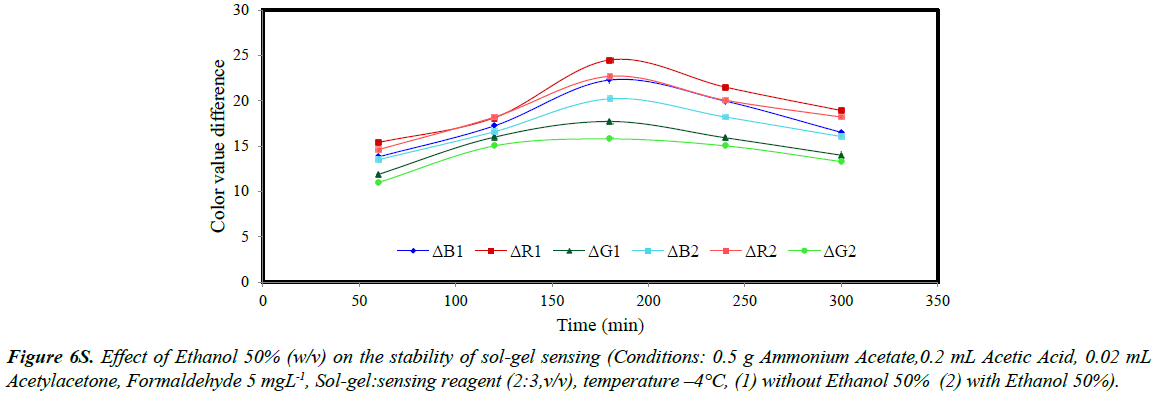
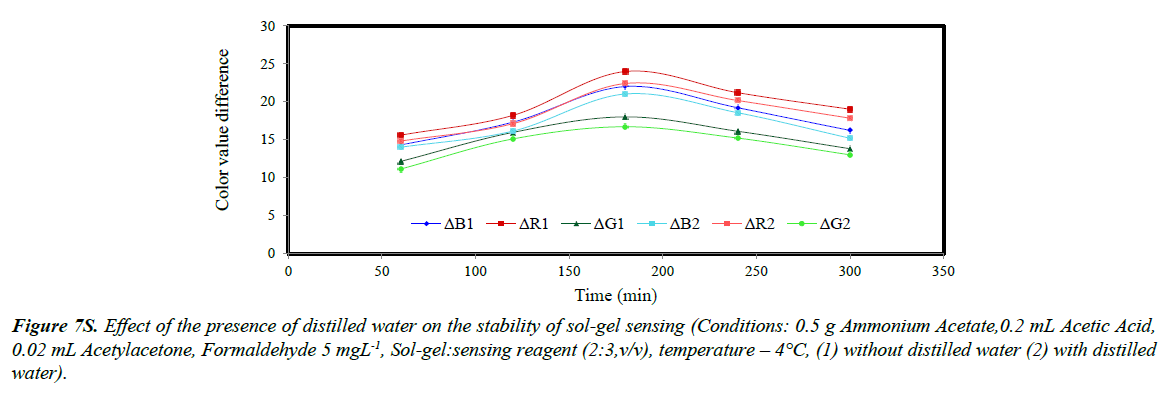
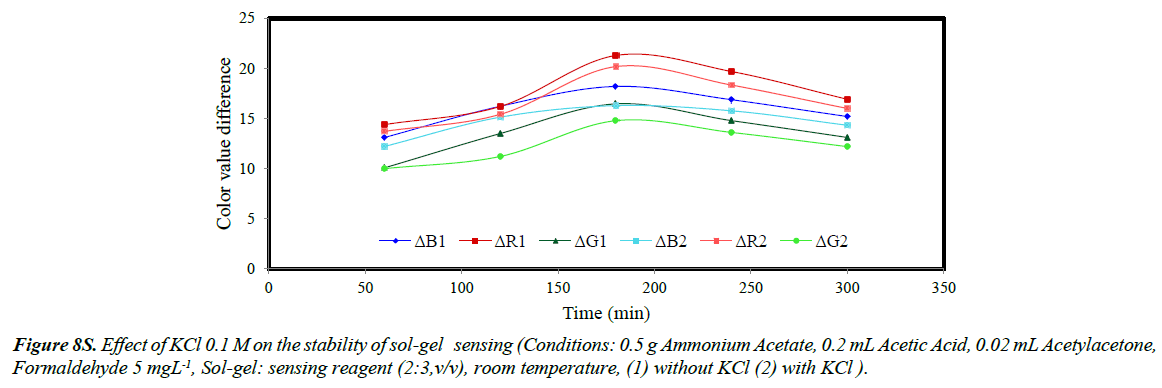
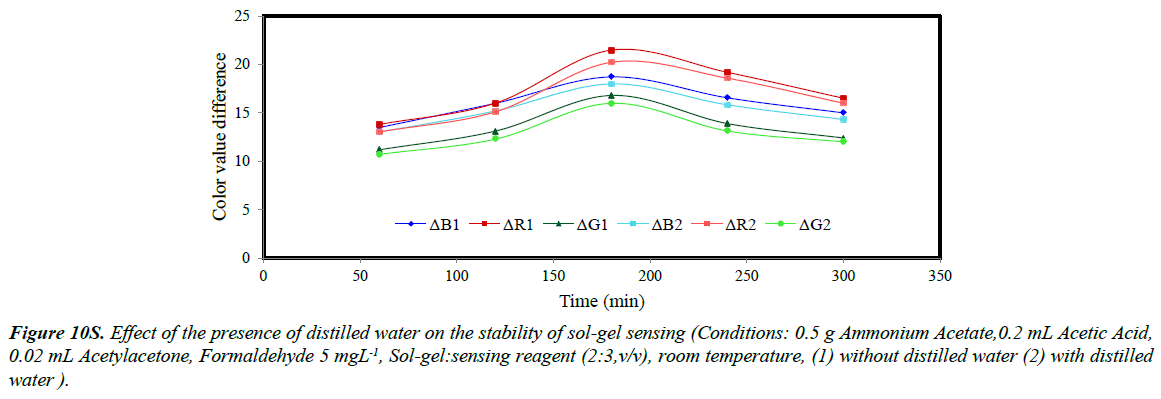
The stability of sol-gel sensor was studied in the presence of 0.1 molL-1 KCl solution, 50% (w/v) ethanol solution, de-ionized water and at two different temperatures of 25ºC and – 4ºC. The results are given in (Figures 5S-10S). The results indicated that under the studied conditions, the sol-gel structure was stable. When the sol-gel was kept at –4ºC, the G, R and B parameters were significantly enhanced. This was attributed to lower evaporation of the sol-gel constituent at this temperature.
Calibration curve, reproducibility and limit of detection
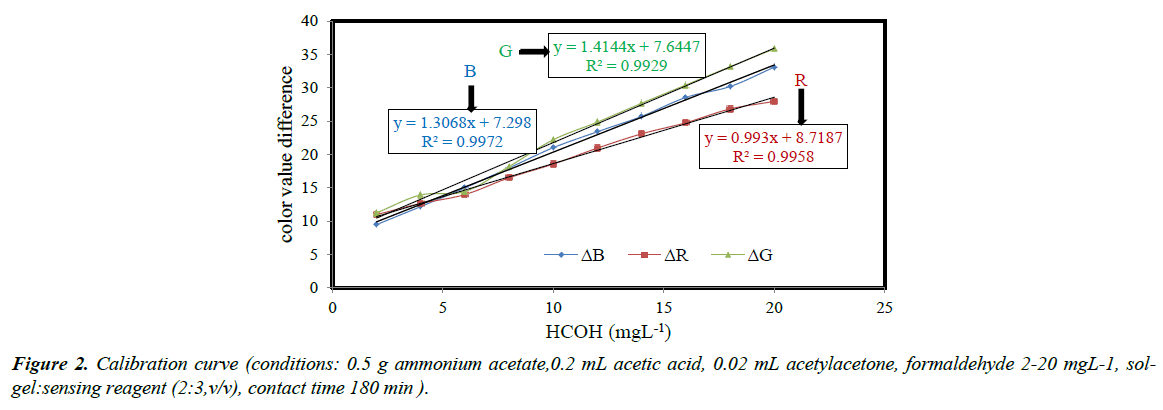
The calibration curves for response to formaldehyde vapors under optimized conditions in the concentration ranges of 2-20 mgL-1 are given in Figure 2. Acceptable linear relationship between the response and formaldehyde concentration was obtained. The regression coefficients were 0.9958, 0.9972 and 0.9929 respectively for R, B and G. To evaluate the reproducibility of the method, twenty formaldehyde sample solutions (5 mgL-1) were analyzed and the relative standard deviations (RSD) of 4.3, 6.1 and 8.5% were obtained for R, G and B color values respectively. The detection range evaluated as three times standard deviation of the blank signal from 10 replicates divided by the slope of the calibration curve (3Sb/m) was obtained as 0.1 mgL-1. The results indicated that the method established in the present research was capable to estimate the formaldehyde concentration in air below the limiting value (0.75 mgL-1).
Selectivity of method
The interference effect of carbonyl compounds such as aldehydes and ketones which are the most common interfering compounds for estimation of formaldehyde concentration was investigated and the influence of acetaldehyde, benzaldehyde, butanone and acetone with sol-gel sensors was examined. On determination of 1.0 mmolL-1 of formaldehyde at optimal condition, an error of ± 5% was considered as tolerance limit (Table 1). It was found that the proposed method was not affected by most of interference such as acetaldehyde at 200-fold, benzaldehyde at 500-fold, butanone and acetone at 1000-fold indicating that the proposed method is highly selective toward formaldehyde in the presence of the studied interferences.
| Interference species | Tolerence limita (Winterfer/WHCHO) |
|---|---|
| acetaldehyde | 200 |
| benzaldehyde | 500 |
| butanone | 1000 |
| acetone | 1000 |
aThe tolerance was defined as that ratio causing a relative error of ± 5%
Table 1: Interference effect on the determination of 1.0 mmolL-1 HCHO.
Determination of formaldehyde concentration in synthetic samples
The acetylacetone sol-gel trapped material was employed for evaluation of formaldehyde concentration in the synthetic samples. The results given in Tables 2 and 3 showed that the method was capable to determine the formaldehyde concentration sat different concentrations with reasonable accuracy.
| Sample | Actual concentration HCHO (mgL-1) |
Measured Concentration HCHO (mgL-1) | RSD (%) |
|---|---|---|---|
| 1 | 2.30 | 2.45 | 6.5 |
| 2 | 3.50 | 3.90 | 11.4 |
| 3 | 7.50 | 8.11 | 8.1 |
| 4 | 10.30 | 11.58 | 12.4 |
| 5 | 12.50 | 13.81 | 10.5 |
Table 2: Determination of formaldehyde in several synthetic samples.
| Sample | Method | Figures of merit | Matrix | Ref. |
|---|---|---|---|---|
| Dopamin Hydrazine Dopamine Fe(II) and Fe(III) Chloride Magnesium Bromocresol green Brown HT |
Scanometry Scanometry Scanometry scanner electrochemistry Scanometry Scanometry Scanometry CPE-Scanometry |
DOL= 16 µM DOL= 0.1µg /mL DOL= 0.5 µg /mL RSD% = 3.50 Error% = 4.3 RSD% = 1.90 — DOL= 0.04 mg/L |
Serum and urine Water and biological sample Bovine serum Tap water Synthetic sample Almond gum and water samples Pure water Water sample |
17 18 15 19 20 16 21 22 |
Table 3: Historical use of Scanometric Method.
Conclusions
The method suggested in the present research was based on formation of a transparent sol-gel which entrapped acetylacetone reagent as a sensing material for measurement of formaldehyde in the air. The instrumentation was very simple and the quantitative response was obtained visually by a scanner equipped with a cold cathode florescent lamp and a light source. The developed sensing device can be employed as a qualitative and screening technique for on-site analysis of formaldehyde. The method was simple, cost economic, portable, consuming small amount of low toxic reagents, operates at room temperature and needs no sample preparation step. The selectivity of the method examined in the presence of some common interfering compounds showed that the method was highly selective. The results indicated that the method established in this research was capable to estimate the formaldehyde concentration in air below the limiting value (0.75 mgL-1). The stability of sol-gel sensor examined in the presence of 0.1 molL-1 KCl solution, 50% (w/v) ethanol solution, de-ionized water showed that the sol-gel structure was stable.
The method had good reproducibility and selectivity. Other carbonyl compounds such as acetaldehyde, benzaldehyde, acetone and butanone did not interfere with the measurement. The method can be developed for measurement of different substances by modification of sol-gel composition through utilizing adequate sensitive and selective materials [17-22].
References
- Dumas T. Determination of formaldehyde in air by gas chromatography. J Chromatogr A 1982;247: 289-95.
- Hart R, Angelo T, Neimeth L. Report on the consensus workshop on formaldehyde. Environ Health Perspect 1984;58:323-81.
- Stock TH, Mendez SR. A survey of typical exposures to formaldehyde in Houston area residences. Am Ind Hyg Assoc J 1985;46:313-7.
- Feng L, Yongjun L, Xiaodong Zh, et al. The fabrication and characterization of a formaldehyde odor sensor using molecularly imprinted polymers. J Colloid Interface Sci 2005;284:378-82.
- Luo W, Hui L, Yuan Zhang CYW. Determination of formaldehyde in blood plasma by high-performance liquid chromatography with fluorescence detection. J Chromatogr B 2001;753:253-7.
- Rocha FR, Coelho LH, Lopes ML, et al. Environmental formaldehyde analysis by active diffusive sampling with a bundle of polypropylene porous capillaries followed by capillary zone electrophoretic separation and contactless conductivity detection. Talanta 2008;76:271-5.
- Korpan YI, Gonchar MV, Sibirny AA, et al. Development of highly selective and stable potentiometric sensors for formaldehyde determination. Biosens Bioelectron 2000;15:77-83.
- Dong Sh, Dasgupta P K. Fast fluorometric flow injection analysis of formaldehyde in atmospheric Water Environ Sci Technol 1987;21:581-8.
- Mitsubayashi K, Genki N, Masayuki S, et al. A bio-sniffer stick with FALDH (formaldehyde dehydrogenase) for convenient analysis of gaseous formaldehyde. Sens Actuators B 2008;130:32-7.
- Demkiv O, Oleh S, Solomiya P, et al. Reagent less amperometric formaldehyde-selective biosensors based on the recombinant yeast formaldehyde dehydrogenase. Talanta 2008;76:837-46.
- Dennison M J, Hall JM, Turner APF. Direct monitoring of formaldehyde vapour and detection of ethanol vapour using dehydrogenase-based biosensors. Analyst 1996;121:1769-73.
- Wallington SA, Telmo L, Andrea P, et al. Sol-gel entrapped materials for optical sensing of solvents and metal ions. Sens Actuators B 1997;38:48-52.
- Persad A, Chow KF, Wenqun W, et al. Investigation of dye-doped sol–gels for ammonia gas sensing. Sens Actuators B 2008;129:359-63.
- Bunkoed O, Frank D, Proespichaya K, et al. Sol-gel based sensor for selective formaldehyde determination. Anal Chim Acta 2010;659:251-7.
- Abbaspour A, Valizadeh H, Khajehzadeh A. A simple, fast and cost effective method for detection and determination of dopamine in bovine serum. Anal Methods 2011;3:1405-09.
- Shokrollahi A, Hemmatidoust K, Zarghampour F. Determination of magnesium by the solution scanometric method in a coloured titan yellow magnesium hydroxide complex form. J Taibah Uni Sci 2016;10:161-7.
- Abbaspour A, Khajehzadeh A, Ghaffarinejad A. A simple and cost-effective method, as an appropriate alternative for visible spectrophotometry: development of a dopamine biosensor. Analyst 2009;134:1692-8.
- Abbaspour A, Mirahmadi E, Khajehzadeh A. Disposable sensor for quantitative determination of hydrazine in water and biological sample. Anal Methods 2010;2:349-53.
- Abbaspour A, Khajehzadeh A, Ghaffarinejad A. Development of a new method based on scanner electrochemistry: applied for the speciation of Iron (II) and Iron (III). Anal Methods 2011:3:2268-74.
- Abbaspour A, Khajehzadeh A. End point detection of precipitation titration by scanometry method without using indicator. Anal Methods 2012;4:923-30.
- Shokrollahi A, Firoozbakht F. Determination of the acidity constants of neutral red and bromocresol green by solution scanometric method and comparison with spectrophotometric results. Beni-suef Uni J Basic Appl Sci 2016;5:13-20.
- Shokrollahi A, Ahmadi S. Determination of trace amounts of Brown HT as a food dye by CPE-Scanometry method. J Taibah Uni Sci 2017;11:196-204.
