Research Article - Journal of Biochemistry and Biotechnology (2017) Industrial Biotechnology
Determination of acarbose in tablets by attenuated total reflectance Fourier transform infrared spectroscopy
Ali Saoud1, Gabriel Akyirem Akowuah1*, Omotayo Fatokun1, Ahmad Mariam2 and Shaik Ibrahim Khalivulla11UCSI University, no.1 Jalan Menara Gading, UCSI Heights, 56000 Kuala Lumpur, Malaysia
2School of Mechanical and Aerospace Engineering, Queen’s University Belfast, Belfast, BT9 5AH, UK
- *Corresponding Author:
- Gabriel Akyirem Akowuah
UCSI University, no.1 Jalan Menara Gading, UCSI
Heights
Kuala Lumpur
Malaysia
Tel: +03-91018880;
E-mail: agabriel@ucsiuniversity.edu.my
Accepted date: August 05, 2017
Abstract
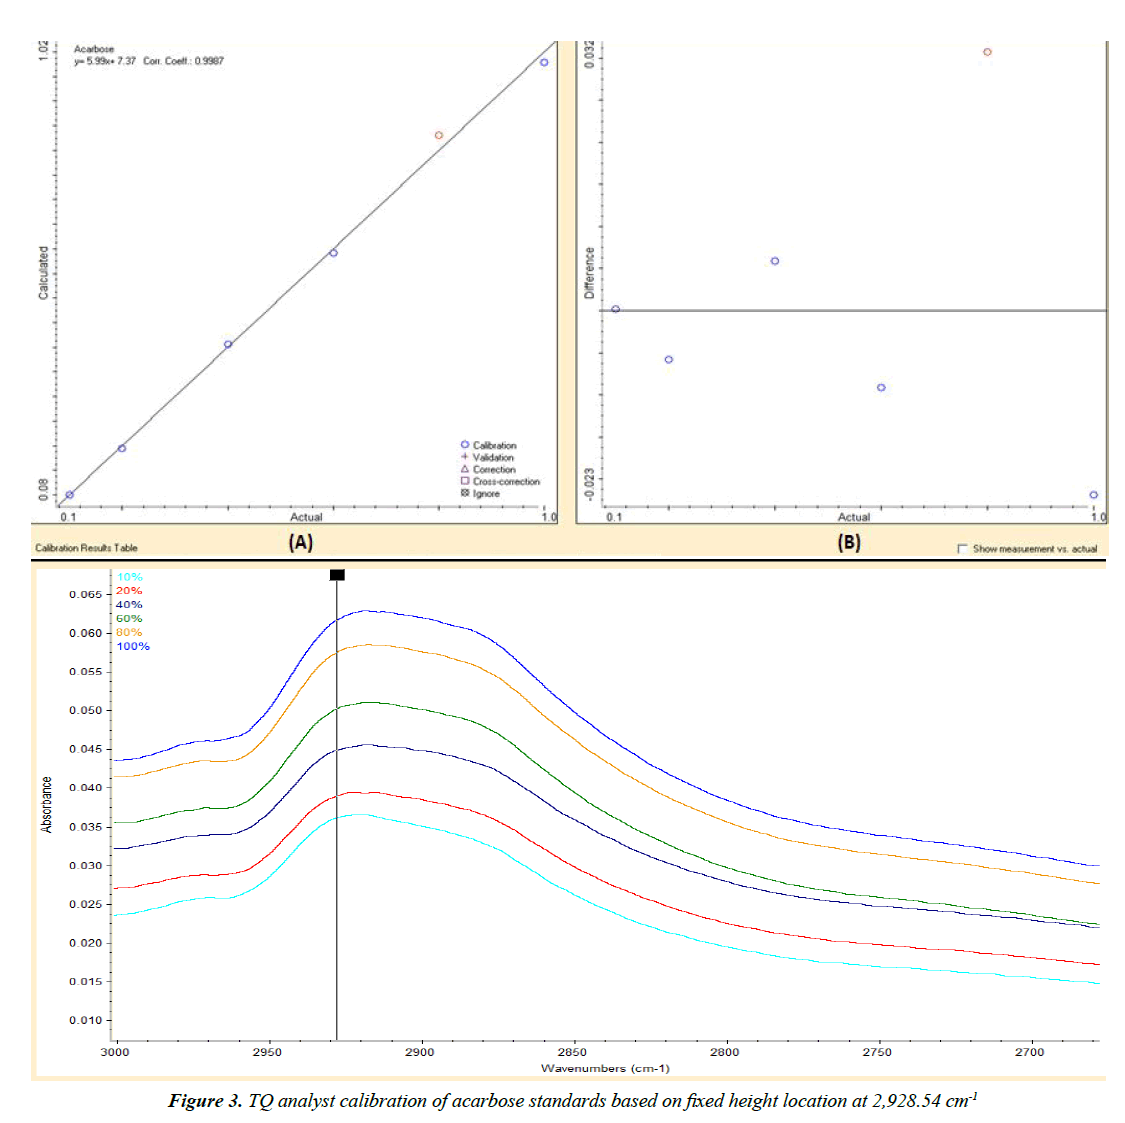
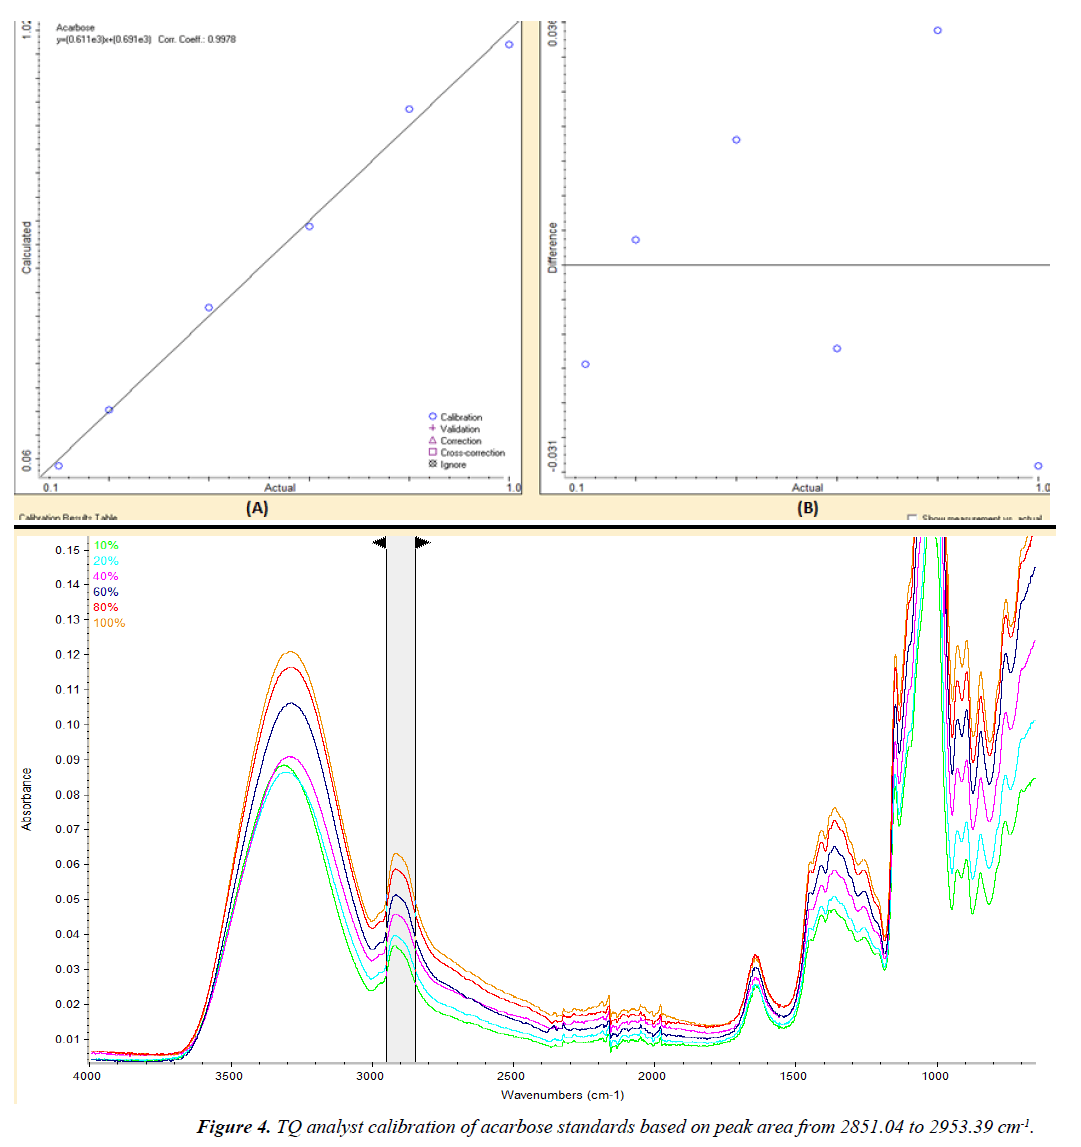
Attenuated total reflectance Fourier transform infrared (ATR- FTIR) spectroscopy method was developed for the quantitative determination of acarbose in tablets. Two calibration curves were generated. The first calibration curve was based on peak height at 2928.54 cm-1 with correlation coefficient of 0.9987. The second calibration curve was based on peak area which range from 2953.39-2851.04 cm-1 with correlation coefficient of 0.9978. The FTIR method was validated according to International Conference on Harmonization (ICH) guidelines. The method was precise over a range of 40%-100% w/w with % RSD values less than 2 for intra-day and interday precision. The accuracy of the method was expressed as the percentage recovery of the spiked acarbose standards with a mean recovery of 106.9%. The limit of detection and limit of quantification values were 0.004% and 0.012 % w/w, respectively. The validated method was used for the quantification of acarbose in tablets with good results.
Keywords
Acarbose, ATR- FTIR spectroscopy, fixed height location, peak area, tablets.
Introduction
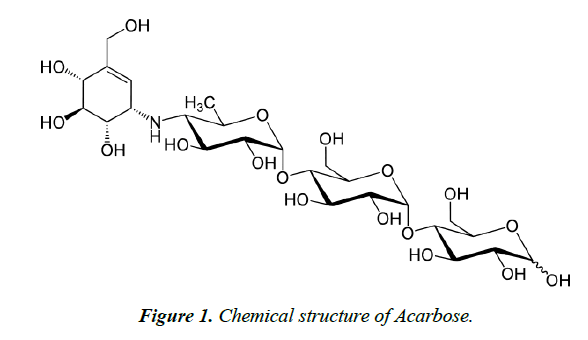
Diabetes mellitus forms a serious health problem worldwide. There are different categories of anti-diabetic drugs which are used for the management of diabetes. This includes biguanides (e.g. metformin), sulfunylureas (Glibenclamide), ithiazolidinedione (e.g. rosiglitazone), dipeptidyl peptidase-4 inhibitor (e.g. Sitagliptin) and alpha glucosidase inhibitors (e.g. Acarbose). Acarbose is an alpha glucosidase inhibitor that is used for the control of type 2 diabetes mellitus. It is a carbohydrate analogue consisting of mainly of two subunits including one maltose subunit and a pseudo-disaccharide subunit called acarviosin. The acarviosin subunit consists of 6-deoxy glucose and an amino cyclitol moiety called valienamine (Figure 1). The maltose subunit is connected to the 6-deoxy glucose by glycosidic linkage [1,2]. It acts through the competitive inhibition of alpha glucosidase enzymes found in the proximal small intestine including maltase, isomaltase, sucrase and glucoamylase which are present in intestinal brush border [3,4]. Few methods have been developed for the determination of acarbose in pharmaceutical formulations. These methods are mainly based on the use of high performance liquid chromatography [5,6], capillary electrophoresis and ultra violet (UV) spectrophotometer [7-9]. Most of the reported analytical methods required derivatization of acarbose so that it can be detected by UV or fluorescence detectors [8]. The derivatization process is time consuming in addition to the high cost due to the usage of large volume of solvents and reagents. The detection techniques of the available methods for the determination of acarbose in tablets may not be sensitive to acarbose due to the chemical structure which conjugated double bonds and phenyl groups. The methods lack the simplicity besides the requirement for extended sample preparation. As a result, there is a need for alternative methods that can carry out simple and fast determination of acarbose in tablets. Attenuated total reflectance Fourier transform infrared (ATR-FTIR) spectroscopy represents alternative method to achieve these aims. This objective of the present study was to develop fast and simple ATR-FTIR technique for the determination of acarbose in pharmaceutical formulations. The method was validated according to the ICH guidelines and was then applied for the quantification of acarbose content in commercially available tablets.
Materials and Methods
Instrumentation
Spectra were obtained with Nicolet™ iS5 FTIR spectrometer controlled by OMNIC software for spectra collection and TQ Analyst software for Data processing (Thermo scientific, USA). The instrument is equipped with iD5 ATR accessory featuring a top plate diamond crystal with a fixed angel of incidence of 42°.
Chemicals
Acarbose standard ≥ 98.0% (LKT laboratories, USA), IR grade KBr 99.999% (Merck KGaA, Germany) was used to dilute the standard. Ethanol 95% (John Kollin, Malaysia) and ultra-pure water were used to clean diamond crystal between scanning. Acarbose (100 mg) containing tablets purchased from local Pharmacy store were used for the quantitative determination of acarbose in compliance with claimed amount in the corresponding tablet.
Analytical methods
Acarbose working standards were prepared in the range from 10-100% w/w by accurately weighing different amounts of acarbose standard and mixing with weighed amounts of IR grade KBr to get a total weight of 0.1 mg of each working standard. These were kept in amber glass bottle in a dissicator to protect it from absorbing moisture. The mixing of KBr and acarbose standard was done in FTIR mortar till homogenization.
Acarbose working standards were used to plot a standard calibration curve with six points ranging from 10-100% w/w. Each working standard was applied on the ATR-FTIR to scan for its spectrum in the range of 4000 to 600 cm-1. A background scan of air was done prior to each scanning of the working standards. All spectra were recorded at 4 cm-1 resolution with average of 16 scans per spectrum. The diamond crystal of the ATR accessory was cleaned by ethanol before each application of the working standards. The calibration curve was generated through the TQ analyst software following the Beer’s Law and utilizing the FTIR spectra of the working standards generated earlier. Different wavenumbers ranging from 2970 to 600 cm-1 were selected and two types of regions including fixed height location and peak area were used in order to select the most suitable location and peak area, respectively to generate two calibration curves of which their R2 is higher than 0.99. The data for the calculated versus the actual measurements of the standards was used for the linear regression analysis [10].
Method validation
The system suitability was determined based on ICH guidelines [11] at the selected wavenumber including sensitivity, precision and accuracy. The sensitivity of the method was determined from the calibration curve with respect to limit of detection (LOD) and quantification (LOQ) as described by Boyd and Kirkwood [12].
The precision of the FTIR system was evaluated by the intra-day (repeatability) and inter-day (reproducibility) precision by using the following quality control (QC) standards: 10% w/w (low), 40% and 60% w/w (medium) and 100% w/w (high). The intraday precision was evaluated by measuring the QC standards in three replicates each on the same day. For the inter-day precision, three replicates of the QC acarbose standards were measured over three consecutive days. The relative standard deviation (%RSD) of the selected fixed location height and peak area correspondent for the two calibration curves generated respectively was used to express the precision.
The accuracy of the FTIR system was evaluated by calculating the percentage recovery of acarbose standard. One acarbose tablet was grinded to fine powder. The powder of the tablet was then spiked with accurately weighed amounts of acarbose. The tablet powder was spiked with 10, 40 and 100% w/w of acarbose standards, respectively. The FTIR spectrum of each spiked sample was collected three times and the accuracy was expressed as the mean percentage recovery of three replicates for each spiked sample. After the validation of the FTIR method, the quantification of the acarbose in tablet was carried out directly based on the calibration curves generated. Acarbose content in the tablets was determined by grinding the tablet and directly applying it on the ATR accessory to get the corresponding FTIR spectrum. The calibrator concentrations which are required to evaluate the linearity were extended to a wide calibration range and evenly distributed over it [13]. The quantification was carried out in triplicate and the results were expressed as mean ± standard deviation and % RSD [14].
Results and Discussion
Analytical method development and validation
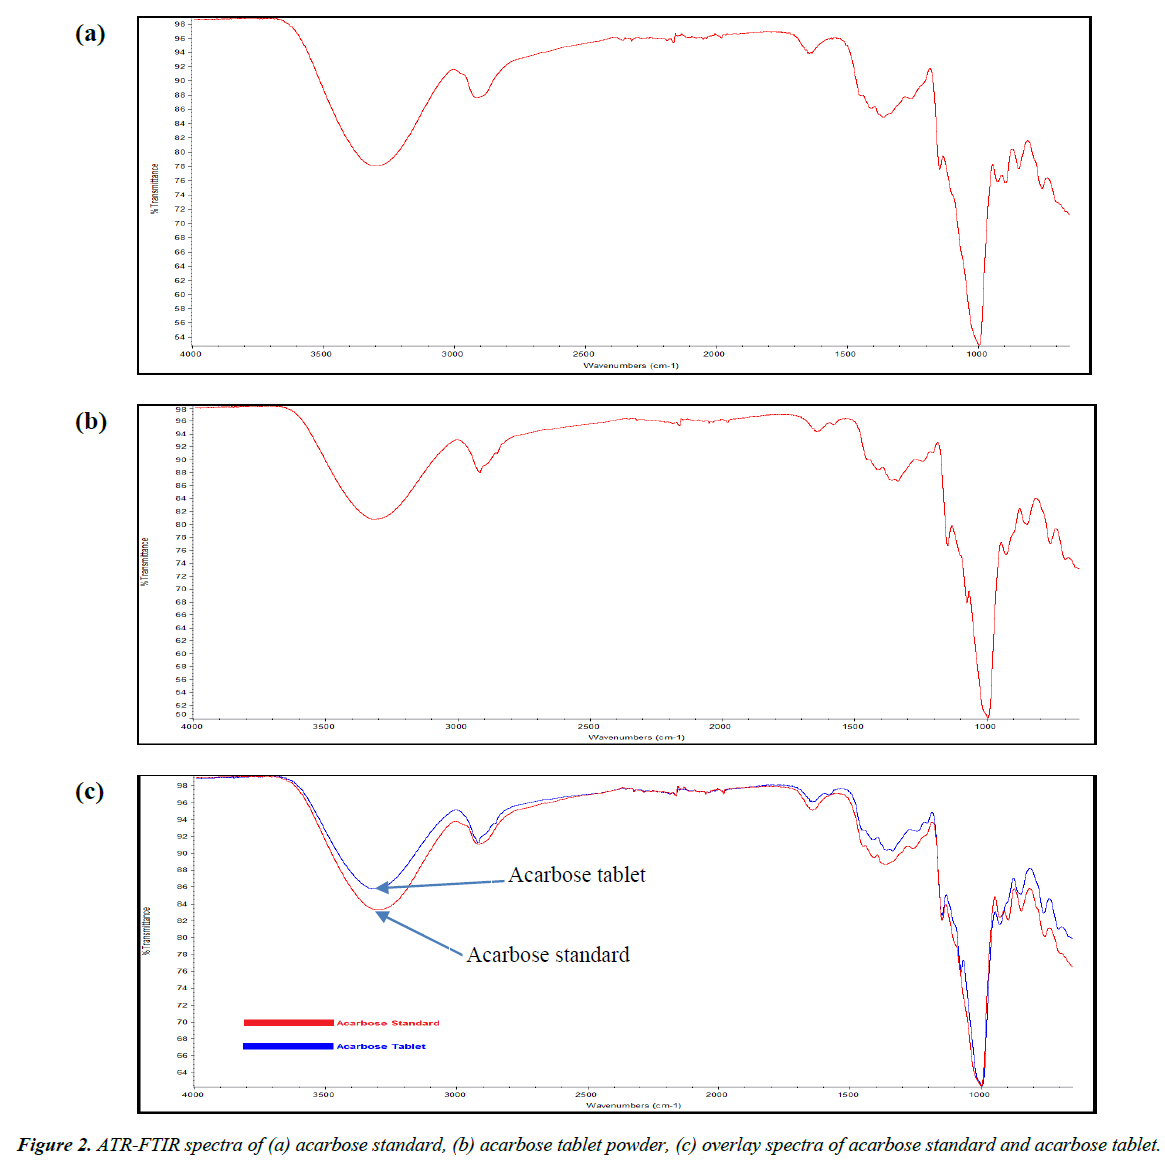
The ATR-FTIR spectrum of acarbose pure standard and acarbose tablets powder are shown in Figure 2. The method development was performed by TQ Analyst software based on Beer’s law. A set of six working standards with concentrations from 10 to 100% w/w was used for the generation of the two calibration curves by scanning the peaks from 2970 to 600 cm-1 in order to get the highest correlation coefficient with a value more than 0.99. The first calibration curve was based on peak height at 2928.54 cm-1 with correlation coefficient of 0.9987 (Figure 3). The second calibration curve was based on peak area from 2953.39-851.04 cm-1 with correlation coefficient of 0.9978 (Figure 4).
Table 1 shows the results of validation parameters for ATRFTIR analysis of acarbose in tablets. The calibration curves gave correlation coefficients greater than 0.99. The calculated LOD and LOQ were 0.004 and 0.012% w/w, respectively for peak height. By using peak area, the calculated LOD and LOQ were 0.031 and 0.095% w/w, respectively. The calculated %RSD values for inter- and intra-day precision were less than 5% for peak area and peak height, indicating good repeatability of the proposed method. Excellent mean recovery percent values close to 100% were obtained, which indicated high accuracy of the proposed method.
| Validation parameters | Region type | |||
|---|---|---|---|---|
| Fixed location height | Peak area | |||
| 2,928.54 cm-1 | 2851.04 - 2953.39 cm-1 | |||
| Linear range (%w/w) | 10 - 100 | 10 - 100 | ||
| Correlation coefficient (R2) | 0.9987 | 0.9978 | ||
| Regression equation | Slope (b) | 5.99 | 6.11 | |
| Intercept (a) | 7.37 | ####### | ||
| LOD (w/w%) | 0.004 | 0.031 | ||
| LOQ (w/w%) | 0.012 | 0.095 | ||
| Intraday precision | 10% w/w | 2.555 | 7.479 | |
| (n=3, RSD%) | 40 % w/w | 1.083 | 1.132 | |
| 60% w/w | 1.903 | 0.559 | ||
| 100 %w/w | 1.882 | 1.112 | ||
| Interday precision | 10% w/w | 1.465 | 3.285 | |
| (n=3, RSD%) | 40% w/w | 1.147 | 1.607 | |
| 60% w/w | 0.948 | 1.598 | ||
| 100 %w/w | 1.563 | 0.905 | ||
| Recovery | Mean | 104.384 | 106.901 | |
| %RSD | 2.012 | 3.659 | ||
Table 1. Validation parameters of the ATR-FTIR method based on fixed height location and peak area.
Quantification of acarbose in tablets
The validated proposed ATR-FTIR method was used for the quantitative determination of acarbose in tablets without the extraction of the active pharmaceutical ingredients. The quantification was carried out based on the two calibration curves previously generated. The tablets were grinded and scanned from 2970 to 600 cm-1. The peak height at 2,928.54 cm-1 and the peak area from 2953.393 to 2851.047 cm-1 were measured. Table 2 shows the results of quantification of acarbose in tablets. The mean percentage of labelled amount was found to be 100.675 mg for height and 100.063 mg for peak area. The tablet excipients showed no interference with the analysis.
| Quantification of acarbose in tablets | Region type | |
|---|---|---|
| Fixed location height | Peak area | |
| 2,928.54 cm-1 | 2851.04 - 2953.39 cm-1 | |
| Mean(% w/w) n=3 | 36.837 | 36.613 |
| RSD (%) | 9.364 | 10.874 |
| Amount quantified (mg) | 100.675 | 100.063 |
Table 2. ATR-FTIR quantification results of acarbose content in 100 mg tablets.
The acquisition of the acarbose spectrum provides a primary step in the quantification process. In addition, the interpretation of the FTIR spectrum is helpful in facilitating the process by providing information about the peaks available and their validity for quantification. The abundance of hydroxyl groups in the chemical structure resulted in a wide peak ranging from 3570-3000 cm-1. C-H asymmetrical stretching was expressed as a peak from about 2970 to 2800 cm-1. The sharp intense peak within the range from 1070 to 980 cm-1 is attributed to C-H bending. The only double bond in the chemical structure of acarbose resulted in C=C stretching that appeared as a weak intensity peak between 1680-1620 cm-1 [15]. Although acarbose contains a secondary amine group, however, there is no corresponding clear peak in the FTIR spectrum. This is because secondary amine group is usually explained by FTIR peak ranging from 3360 to 3310 cm-1 and in the case of acarbose, this range is totally occupied by the wide peak corresponding to O–H stretch that can extend broadly from 3570 to 3200 cm1. As a consequence, relying on the secondary amine group will not be beneficial in the quantification. During the development of the quantification method, the FTIR spectrum was scanned for important peaks that could yield a good calibration curve with a correlation coefficient higher than 0.99. The part of the spectrum scanned ranged from 2970 to 600 cm-1. The O-H stretch peak was excluded from the quantification because acarbose is a hygroscopic substance able of absorbing moisture. As a consequence, any additional moisture content during measuring the spectrum will result in increase in the O-H corresponding peak and will affect the quantification results.
The quantitative analysis was based on Beer’s Law which depends on the proportionality between the sample absorbance and its concentration. This provides quick and simple quantification method by utilizing small number of standards in order to get a linear calibration curve. The deviation from the linearity in Beer’s Law is expected with higher concentration of the sample. Hence to reduce non linearity FTIR peaks in which their absorbance exceeds 0.7 were not selected for calibration.
The developed method was validated based on ICH guidelines. The ICH guidelines present a deliberation of the characteristics for consideration during the validation of analytical methods. The objective of the ICH procedures for the validation of an analytical methods is to demonstrate that the method is suitable for its intended purpose [11]. The precision of the FTIR system was expressed by RSD%. For the FTIR method which was developed based on the fixed height location of standards spectra, the RSD% values of both the intra-day precision and inter-day precision were within the acceptable range for all, the lowest (10%), medium (40 and 60%) and highest (100%) working standards referred to the ICH guidelines [11]. On the other hand, the FTIR method developed based on the selected peak area achieved acceptable inter-day precision for all QC standards (Low, medium and high), however, the RSD% value of the intra-day precision was high for the lowest concentration (10%), while it was acceptable for medium and high concentrations. This could be explained by low signal to noise ratio due to the indeterminate instrumental noise error in which it is usually observed more often with low concentration, i.e. the intensity of incident light is almost equal to the transmitted one [16].
The calculated LOD and LOQ values of acarbose in both calibration curves based on peak area and fixed location height are acceptable as the obtained values are lower than the lowest concentration of acarbose working standard used in the generation of the calibration curves. This shows that FTIR method is sensitive enough to carry out quantitative analysis of acarbose which lack double bond conjugation system making it unsuitable for direct UV detection. Furthermore, FTIR has been successfully employed in the quantitative determination of other pharmaceutical ingredients which lack double bond conjugation system. For example, azithromycin has been successfully determined by transmission FTIR method using C=O correspondent band with LOD of 0.07 mg/ml [17]. In addition, roxithromycin and erythromycin were determined by FTIR with LOD of 0.01 and 0.006, respectively [18,19]. The accuracy of the method based on % recovery of the spiked acarbose standards showed that the percentage recovery for samples spiked with the quality control standards using peak area and fixed height location were acceptable [20,21]. Similarly, the mean percentage recovery for the samples determined based on based on both region types was also acceptable [22].
The quantitative determination of acarbose in tablets by the FTIR method was carried out without the extraction of the active pharmaceutical ingredients. It only required finely grinding the tablet and applying the powder on the ATR-FTIR instrument. The results obtained for the quantification of acarbose in tablets by FTIR method in the present study is comparable to work reported by Cherkaoui et al. [6]. In their work, they used high performance liquid chromatography equipped with evaporative light scattering detector (ELSD) for the analysis of acarbose in tablets without any derivatization procedure. Although their method is sensitive, however, it is expensive and requires more training to operate the ELSD due to its dependency on the usage of the melting point properties of the substance in which the temperature to be used in the nebulizer should be very low in comparison to the melting point of the sample being analyzed so that only the mobile phase can evaporate leaving the analyte without evaporating [23,24]. In comparison, ATR-FTIR is faster, simpler and cost efficient.
The use of ATR accessory with FTIR provides an advantage over the widely used transmission accessory with regards to handling of solid samples. The pellet formation used in transmission accessory was avoided in this method to eliminate the thickness variation of pellets. Sample preparation required mixing the analyte with determined amount of KBr and then applying it directly on the instruments with ATR which provides sufficient penetration depth of the sample and the total reflectance of the beam was assured because the refractive index of acarbose is lower than the refractive index of the diamond crystal and thus the “critical angle” will be higher than the incidence angle according to the formula:
Ɵc = Sin-1 (n2/n1); where (n2) is the refractive index of acarbose and (n1) is the refractive index of the crystal.
ATR-FTIR provides alternative approach for the quantitative determination of acarbose content in tablet formulations as a process of checking the compliance with the label-claimed content. The developed method is fast, non-destructive and sensitive over acceptable range. The sample preparation is minimized and it excludes elaborated pellet formation and use of reagents. This procedure constitutes a convenient alternative to chromatographic and separative methods for quality control analysis of acarbose in pharmaceutical formulations.
Acknowledgement
The research work was financially supported by UCSI University Research Grant Scheme (Proj-In-FPS-010) awarded by the Centre of Excellence for Research, Value Innovation and Entrepreneurship (CERVIE), UCSI University.
References
- Wang YJ, Zheng YG, Xue YP, et al. Analysis and determination of anti-diabetes drug acarbose and its structural analogs. Curr Pharm Anal. 2011;27:2-20.
- Junge B, Matzke M, Stolefuss J. Oral Antidiabetics. New York: Springer 1996.
- Krentz AJ, Bailey CJ. Oral antidiabetic agents. Drugs. 2005;65:385-411.
- Defronzo RA. Pharmacologic therapy for type 2 diabetes mellitus. Ann Intern Med.1999;131:281-303.
- Dai X, An N, Wu J, et al. Development and validation of HPLC-UV-MS method for the control of four anti-diabetic drugs in suspected counterfeit products. Acta Pharm Sin. 2010;45:347-52.
- Cherkaoui S, Daali Y, Christen P, et al. Development and validation of liquid chromatography and capillary electrophoresis methods for acarbose determination in pharmaceutical tablets. J Pharm Biomed Anal. 1998;18:729-35.
- Guo LP, Jiang TF, ZH Lv, et al. Screening α-glucosidase inhibitors from traditional Chinese drugs by capillary electrophoresis with electrophoretically mediated microanalysis. J Pharm Biomed Anal. 2010;53: 250-1253.
- Rethfeld I, Blaschke G. Analysis of the antidiabetic drug acarbose by capillary electrophoresis. J ChromatographyB1997;700:249-53.
- Ibrahim F, Ahmed S, Tolba M. Kinetic determination of acarbose and miglitol in bulk and pharmaceutical formulations using alkaline potassium permanganate. Int J Biomed Sci. 2007;3:20-24.
- Taverniers I, De Loose M,Van Bockstaele E. Trends in quality in the analytical laboratory. II. Analytical method validation and quality assurance.Trends Anal Chem. 2004;23:535-42.
- International conference on harmonization (ICH). Guideline Q2(R1), Validation of analytical procedures: Text and Methodology, ICH Geneva, 2005.
- Boyd S, Kirkwood J. Quantitative Analysis Using ATR-FTR Spectroscopy. Agilent Technologies Inc: Santa Clara 2011.
- Peters FT, Drummer OH, Musshoff F. Validation of new methods. Forensic Science International. 2007;165:216-24.
- Ordoudi SA, Pascual M, Tsimidou MZ. On the quality control of traded saffron by means of transmission Fourier-transform mid-infrared (FT-MIR) spectroscopy and chemometrics. Food Chem. 2014;150:414-21.
- Mayo DW, Miller FA, Hannah RW. Course Notes on the Interpretation of Infrared and Raman Spectra. New York: J Wiley and Sons 2004.
- Harvey D. Modern Analytical Chemistry. New York: McGraw-Hill 2000.
- Robaina NF, De Paula CER, Guardia M, et al. Novel approach for the determination of azithromycin in pharmaceutical formulations by Fourier transform infrared spectroscopy in film-through transmission mode. Microchemical J. 2013;110:301-307.
- Ali M, Sherazi S, Mahesar S. Quantification of erythromycin in pharmaceutical formulation by transmission Fourier transform infrared spectroscopy. Arabian J Chem. 2012;7:1104-109.
- Sherazi S, Ali M, Mahesar S. Application of Fourier-transform infrared (FT-IR) transmission spectroscopy for the estimation of roxithromycin in pharmaceutical formulations. Vib Spectrosc. 2011;55:115-18.
- Walfish S. Analytical Methods: A Statistical Perspective on the ICH Q2A and Q2B Guidelines for Validation of Analytical Methods. BioPharm International. 2006.
- Shabir GA. Step-by-step analytical methods validation and protocol in the quality system compliance industry.J Valid Tech. 2005;10:314-25.
- Ermer J, Miller JH. Method Validation in Pharmaceutical Analysis. A Guide to Best Practice, Weinheim: Willey-VCH Verlag GmbH 2005.
- Webster GK, Jensen JS, Diaz AR. An investigation into detector limitations using evaporative light-scattering detectors for pharmaceutical applications. J Chromatogr Sci. 2004;42:484-90.
- Young CS, Dolan JW. Success with evaporative light-scattering detection. LCGC North America. 2003;21:120-28.


