Research Article - Journal of Veterinary Medicine and Allied Science (2017) Volume 1, Issue 2
Detection of tetracycline veterinary drug residues in Egyptian poultry meat by high performance liquid chromatography.
Aman IM1*, Ahmed HF1, Mostafa NY1, Kitada Y2, Kar G2
1Faculty of Veterinary Medicine, Kafrelsheikh University, Egypt
2United Graduate School of Drug Discovery and Medical Information Sciences, Japan
- *Corresponding Author:
- Aman IM
Faculty of Veterinary Medicine
Kafrelsheikh University
Egypt
Tel: 548154464
E-mail: iaman@vet.kfs.edu.eg
Accepted Date: August 25, 2017
Citation: Aman IM, Ahmed HF, Mostafa NY, et al. Detection of tetracycline veterinary drug residues in Egyptian poultry meat by high performance liquid chromatography. J Vet Med Allied Sci. 2017;1(1):51-57.
Abstract
The aim of the study is to detect tetracyclines veterinary drug residues in poultry meat. In this study one hundred and sixtybroiler chicken carcasses each of breast muscle, thigh muscle, and liver and kidney samples were collected from Kafrelsheikh city during the period from July 2009 to August 2010. Collected samples were examined for Tetracyclines TCs (Oxytetracycline - OTC and Tetracyline -TC) veterinary drug residues using HPLC technique. The extraction of both OTC and TC from chicken samples was carried out with a mobile phase consisting of methanol: acetonitrile: 0.01 M oxalic acid dihydrate (5:18:77 v/v/v) in isocratic mode. Detection carried out by UV detector at wavelength 360 nm. The chromatographic separation was achieved using Inertsil ODS-3 column with a flow rate 1 mL/min. As well as oxytetracycline and tetracycline antibiotics showed an average retention time of 3.33 min and 4.15 min, respectively. The recovery studies of OTC drug at different concentrations (0.1, 0.2, 1.0 and 2.0 μg/g) were 86.97%, 83.39% and 83.90% for breast muscle, liver and kidney samples respectively. While TC drug showed average recovery percentages at the previous concentrations of 77.56%, 74.63% and 72.45% for chicken muscle, liver and kidney samples respectively. Residues of OTC were detected in 28.75% and 75% of breast and thigh muscles respectively, while all (100%) liver and kidney samples had OTC residues. Only 8.69%, 15.83%, 45% and 51.25% of breast muscle, thigh muscle, and liver and kidney samples, respectively exceeded the MRL set by FAO/WHO 2010. Residues of TC were detected in 5.0%, 12.5%, 13.1% and 5.0% of breast muscle, thigh muscle, liver and kidney samples respectively. None of the examined liver and kidney samples contained TC quantities above the MRL while 50% each of breast and thigh muscles contained tetracycline residues above the MRL set by FAO/WHO 2010
Keywords
Poultry meat carcasses, HPLC, TCs, TC, OTC.
Introduction
Veterinary drugs, when used for food animals, have the potential to generate drug residues in animal products. Antibiotics are introduced in veterinary medicine for more than 40 years ago; TCs are broad spectrum antibacterial drugs active against both aerobic and anaerobic bacteria and some protozoa which are probably still the most frequently used antibiotics in animal husbandry [1] and they are also effective against some pathogenic agents which mostly unaffected by other antibiotics e.g. Rickettsia, Mycoplasma pneumonia, Chlamydia spp. and Legionella spp. [2]. The most common TCs used for animal’s treatment are tetracycline (TC), Oxytetracycline (OTC), Chlortetracycline (CTC) and Doxycycline (DC). In Egypt, TC compounds are the most common antibiotics used in poultry farms (own survey) due to their relatively low cost, easily accessible and readiness availability. As a result of incorrect use of these antibiotics in veterinary practice and especially if the withdrawal times are neglected, residues of these drugs may pose a health threat to consumers [3]. In addition, to immediate adverse effects to exposure of human being to low levels of residues that are still unknown [4].
To ensure human safety, internationally recognized organizations such as World Health Organization (WHO) and Food and Agriculture Organization (FAO) have set a tolerance or Maximum Residue Limits (MRLs) for parent compounds of tetracycline and their epimers in muscle at a level of 200 μg/kg, 600 μg/kg in liver and 1200 μg/kg in kidney [5].
Several analytical procedures are available for determination of TCs residues in animal tissues. Traditionally, antibiotic residues are detected with inhibition tests, mostly agar diffusion tests as Four Plate Test (FPT), but also fast inhibition tests can be used with immunological test as Enzyme-Linked Immunosorbant Assays (ELISA) and Solid-Phase Fluorescence Immunoassays (SPFIA) [6]. However, these screening tests are not always accurate at or below the test threshold and often for drug class but not compound specific. Therefore, efficient methods are needed for determining this residue level in food.
The use of HPLC expanded during 1990, as an efficient separation technique [7]. It is a fast and reliable technique with high sensitivity for the analysis of TCs antibiotics residues (identification, confirmation and quantification), varying its efficiency according to chromatographic condition and type of detector used [8].
Different detectors have been described for analysis of TCs antibiotics in chicken tissues as Ultraviolet (UV), Diode- array (DAD), Fluorescence (FLD) and Mass Spectrometry [9].
Therefore, this study was planned to identify and the levels of TCs residues in different edible poultry meat parts (Breast muscle, thigh muscle, liver and kidney organs) sold in Kafrelsheikh city in Egypt using HPLC technique.
Material and Methods
Poultry samples
One hundred and sixty fresh slaughtered broiler poultry carcass samples each of breast muscle, thigh muscle, liver and kidney samples were randomly collected in a frozen state in colorless and labeled bags from different shops at Kafrelsheikh city during the period from July 2009 until August 2010. Samples were transferred to the laboratory and from each collected carcass; four sub-samples (breast muscle, thigh muscle, liver and kidney) were taken and examined for the presence of TCs antibiotic residues including OTC and TC.
Chemicals and solvents
Antibiotic standards:
• Oxytetracycline hydrochloride was obtained from Sigma
• Aldrich Company (Japan).
• Tetracycline hydrochloride was obtained from Nacalaitesque
• Company (Japan).
Chemicals:
• Citric acid monohydrate (C6 H8 O7. H2O) Mwt.=210.14 (Guaranteed reagent, NacalaiTesque Company)
• Di-sodium hydrogen phosphate (Na2 HPO4) Mwt.=141.96 (Guaranteed reagent, NacalaiTesque Company)
• Ethylenediamine-N, N, N´, N´-tetra acetic acid, disodium salt, dihydrate 2Na (EDTA. 2Na) C10H14N2Na2O8.2H2O Mwt.=372.24
(Doji Do Company)
• Hydrochloric acid HCl (9N)
• Sodium hydroxide NaOH (2.5N)
• Oxalic acid dihydrate (COOH)2.2H2O Mwt.=126.07
(NacalaiTesque Company)
Solvent for High Performance Liquid Chromatography (HPLC):
• Acetonitrile 99.8% CH3CN Mwt.=41.0 (NacalaiTesque Company)
• Methanol 99.7% CH3OH Mwt.=32.04 (Wako Company)
• Degassed water (CO2 free water).
All solvents and chemicals used for HPLC analysis were HPLC grade.
Apparatus: A High-Pressure Liquid Chromatography (Shimadzu Corporation, Japan), equipped with two gradient pumps, manual loop injector and a column CTO-10AVP, UV detector and a printer C-R8A Chromatopac (Shimadzu) for data analysis.
Reversed-phase column Intertsil ODS-3 (150 mm × 4.6 mm I.D., 5 μm particle size) from GL sciences company, Japan.
HPLC variables:
• Column name: Inertsil ODS-3.
• Mobile phase: Methanol: Acetonitrile: oxalic acid dihyrate 0.01M (5: 18: 77 v/v/v) pH=2 ± 0.2.
• Flow rate: 1 mL/min.
• Injection volume: 20 μL of both working standard solution and samples.
• Detector: 360 nm.
• Retention time: 3.33, 4.15 min. for OTC and TC, respectively.
• Limit of detection: 50 ng/mL.
• Run time: 7 min.
Methods
Extraction of TCs (OTC and TC) from chicken tissues
The technique used was according to that recommended by Oka et al. [10].
Preparation of antibiotic standards
Standard solutions
Stock standard solution (1000 μg/mL): One mg of tetracycline hydrochloride was weighted in volumetric flask, diluted with methanol to reach a concentration of 1000 μg/ml and stored at -20°C. Fresh solutions were prepared every 6 months.
First working solution (100 μg/mL): Ten mL of the 1000 μg/mL stock standard solution were pipetted into a 100 mL volumetric flask and diluted with methanol and stored at -20°C. Fresh solution was prepared every month.
Second working solution (10 μg/mL): One ml of the 100 μg/mL stock standard solution was transferred into a 10 mL volumetric flask and diluted to volume with methanol and stored for 1 week at -20°C.
Chromatographic standard solutions: Different concentrations of the working standard solutions including (0.05, 0.1, 0.125, 0.2, 0.25, 0.5, 1.0, 2.0 and 5.0 μg/ml) were prepared from the second working solution.
Preparation of McIlvain EDTA buffer (0.1M) (pH=4)
28.41 g of anhydrous dibasic sodium phosphate was dissolved in 1000 mL distilled water in a 1 L volumetric flask and mixed, then 21.01 g of citric acid monohydrate was dissolved in 1000 mL distilled water in 1 L volumetric flask. Combine 1000 mL citric acid solution with 625 mL phosphate solution in a 2 L Volumetric flask, then add 60.49 g of disodium EDTA dihydrate to 1.625 L McIIvain buffer pH=4.00 ± 0.05. 3.2.4. Preparation of HPLC Mobile Phase (methanol: acetonitrile: oxalic acid dihydrate 0.01M) (5: 18: 77): 1.26 g of oxalic acid dihydrate was dissolved in 770 deionized water, combined 770 mL oxalic acid solution with 180 mL acetonitrile and 50 mL methanol to prepare 1000 mL mobile phase (HPLC grade). Fresh solutions were prepared daily, Filtered and degassed.
Determination of the sensitivity of HPLC towards TCs antibiotic
In order to determine the retention time of TCs antibiotics a standard curves was prepared from different concentrations of TCs (0.05, 0.1, 0.125. 0.2, 0.25, 0.5, 1.0, 2.0 and 5.0 μg/ mL) in methanol and injected to HPLC and the peak of each concentration was recorded.
Recovery Trials
In order to detect the efficiency of the extraction procedure of tetracyclines in chicken tissues, Random samples collected from Japanese markets were used for recovery tests were. All samples were subjected to analyses by HPLC to detect the free TCs samples. Free chicken samples were spiked with different concentrations (2.0, 1.0, 0.2 and 0.1 μg/g) of both OTC and TC (3 samples each) considering the MRL of 0.2, 0.6 and 1.2 μg/g for meat, liver and kidney, respectively [5].
Spiked samples were allowed to stand at 4°C for 12 h after standard addition of TCs and then mixed prior to work up [11].
The percent of recovery for each spiked sample was measured using the following relation:

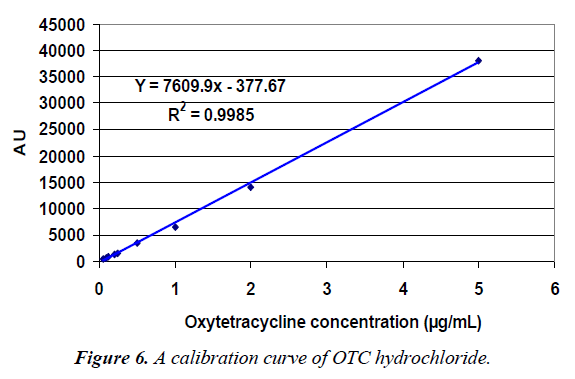
The data was determined using linear regression from Microsoft excel that uses the following equation:
Y=mx+b
Where,
Y=Peak area, x=TCs concentration (μg/kg) , m=Slope curve, b=Intercept of Y.
G. Statistical analysis:
The obtained data were subjected to analysis of variance for one way ANOVA test according to [12]. Treatment means were compared by Duncan’s Multiple Rang Test [13].
All statistical analysis was performed using analysis of variance technique by “CoStat” computer software package.
Results
From the description of Tables 1-7 it is stated that c hromatographic condition: Inertsil ODS-3 C18- 5 μm ( 150 mm × 4.6 mm I.D.; mobile phase-ACN-MeoH-(HCOO)2 (5:18:77 v/v/v ), pH=2; UV-detector- 360 nm; temperature- ambient, flow rate 1 mL/min., injection volume -20 μL. Concentrations 0.05, 0.1, 0.125, 0.2, 0.25, 0.5, 1.0, 2.0 and 5.0 μg/m.
Table 1. Retention time of OTC and TC standard solutions by HPLC.
| Type of Antibiotic | First retention time min | Second retention time min | Third retention time min | Mean ± SD |
|---|---|---|---|---|
| OTC | 3.32 | 3.29 | 3.38 | 3.33 ± 0.0507 |
| TC | 4.14 | 4.08 | 4.22 | 4.15 ± 0.0739 |
Table 2. Recovery percentages of OTC spiked poultry muscle, liver and kidney.
| Concentration µg/g | No. of replicate | Muscle samples | Liver samples | Kidney samples |
|---|---|---|---|---|
| Mean recovery % ± SD | Mean recovery% ± SD | Mean recovery% ± SD | ||
| 0.1 | 3 | 84.22 ± 0.0148 | 80.22 ± 0.0146 | 82.36 ± 0.0149 |
| 0.2 | 3 | 86.11 ± 0.0080 | 84.54 ± 0.0081 | 85.04 ± 0.0075 |
| 1.0 | 3 | 86.95 ± 0.0114 | 82.32 ± 0.0429 | 80.91 ± 0.0217 |
| 2.0 | 3 | 90.62 ± 0.1619 | 86.50 ± 0.1113 | 87.30 ± 0.0946 |
| Total | 12 | 86.97 | 83.39 | 83.90 |
Table 3. Recovery percentages of TC spiked poultry muscle, liver and kidney.
| Type of Samples | No. of examined samples | No. of positive samples | Percentage of positive samples | Conc. of OTC μg/g Min. | Max. | Mean ± SD |
|---|---|---|---|---|---|---|
| 160 samples each | 46 | 28.75 | 0.08 | 0.35 | 0.1296 ± 0.0532 | - |
| Thigh | - | 120 | 75 | 0.08 | 0.32 | 0.1618 ± 0.0532 |
| Liver | - | 160 | 100 | 0.14 | 3.36 | 0.7223 ± 0.5176 |
| Kidney | - | 160 | 100 | 0.2 | 3.83 | 1.3211 ± 0.7850 |
Table 4. Statistical analytical results of OTC residues µg/g in poultry samples.
| No. of replicates | Muscle samples | Liver samples | Kidney samples | |
|---|---|---|---|---|
| Mean recovery % ± SD | Mean recovery % ± SD | Mean recovery% ± SD | ||
| 0.1 | 3 | 81.24 ± 0.0039 | 79.82 ± 0.0051 | 80.55 ± 0.0040 |
| 0.2 | 3 | 77.76 ± 0.0017 | 75.58 ± 0.0048 | 74.17 ± 0.0117 |
| 1.0 | 3 | 73.66 ± 0.0476 | 68.31 ± 0.0581 | 69.78 ± 0.0357 |
| 2.0 | 3 | 77.58 ± 0.0840 | 74.82 ± 0.1036 | 73.40 ± 0.0997 |
| Total | 12 | 77.56 | 74.63 | 72.45 |
Table 5. Number of OTC containing samples exceeding the MRL.
| Type of Samples | No. of positive samples | No. of samples above MRL | % of samples above MRL* | MRL µg/g |
|---|---|---|---|---|
| Breast | 46 | 4 | 8.69 | 0.2 |
| Thigh | 120 | 19 | 15.83 | 0.2 |
| Liver | 160 | 72 | 45 | 0.6 |
| Kidney | 160 | 82 | 51.25 | 1.2 |
*The percentages were calculated according to the number of positive samples (WHO/FAO, 2010).
Table 6. Statistical analytical results of TC concentration µg/g in poultry samples.
| Type of Samples | No. of samples examined | No. of positive samples | Percentage of positive samples | Conc. of TC µg/g | ||
|---|---|---|---|---|---|---|
| Min. | Max. | Mean ± SD | ||||
| Breast | 160 samples each | 8 | 5.0 | 0.13 | 0.80 | 0.3905 ± 0.2633 |
| Thigh | 20 | 12.5 | 0.15 | 0.50 | 0.2720 ± 0.1281 | |
| Liver | 21 | 13.1 | 0.13 | 0.26 | 0.1734 ± 0.0327 | |
| Kidney | 8 | 5.0 | 0.14 | 0.32 | 0.2107 ± 0.0811 | |
Table 7. Number of TC containing samples exceeding the MRL.
| Type of Samples | No. of positive samples | No. of samples above MRL | (%) of samples above MRL* | MRL (μg/g) |
|---|---|---|---|---|
| Breast | 8 | 4 | 50 | 0.2 |
| Thigh | 20 | 10 | 50 | 0.2 |
| Liver | 21 | 0 | 0 | 0.6 |
| Kidney | 8 | 0 | 0 | 1.2 |
Discussion
The most common activities of residues regulating programmers is to control the presence of TCs veterinary drug residues in edible parts of chicken because the massive use of this group of antibiotics by veterinarian for treatment and for preventive measures in chicken farms due to their relatively low cost and easily accessible. Therefore, this study was carried out to determine the incidence level of TCs residues in edible chicken parts.
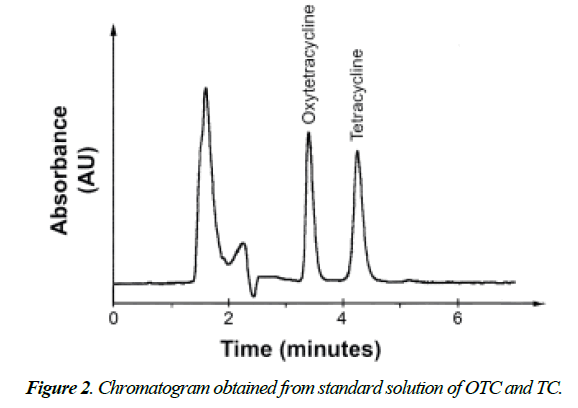
The preliminary work on TCs showed an average retention time of 3.33 ± 0.0507 min for OTC and 4.15 ± 0.0739 min after three injections each (Table 1).
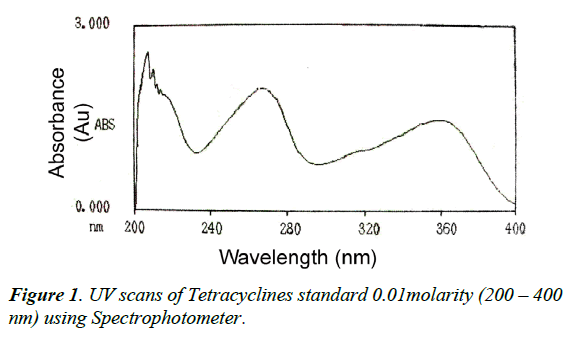
Figure 1 showed that the UV absorption values of both TCs (OTC and TC) were higher at 268 nm, more interference and non-specific absorption was obtained at this wave length. So, wavelength at 360 nm was fixed for residues analysis without any unwanted peak in its retention time. In addition, (Figure 2) showed that OTC and TC were separated from tissue matrix with good resolution and separation of both TCS and the peak shapes were obtained at flow rate of 1 mL/min.
sThere are agreement with the method developed by Biswas et al. [14] as they use the same mobile phase but with relatively low pH=1.6 and low flow rate 0.6 mL/min using an Rp-C8 phenomenex column at 35°C room temperature at 355 nm. They found that the tetracyclines compound at high flow rate could not be separated from the matrix interference due to reduce sensitivity of column. On the other hand, a mobile phase containing oxalic acid avoid forming chelate complex on RPcolumns and interact with silanols and avoid also tail peaking with good separation for tetracyclines [10,15,16].
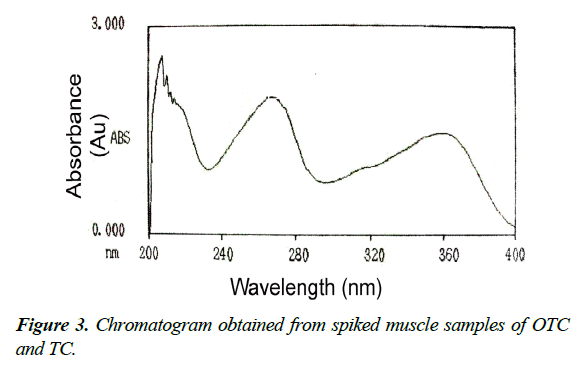
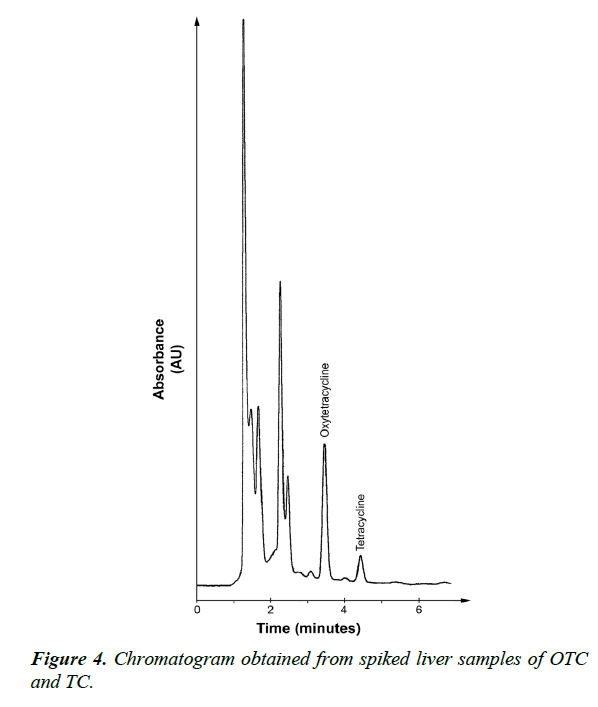
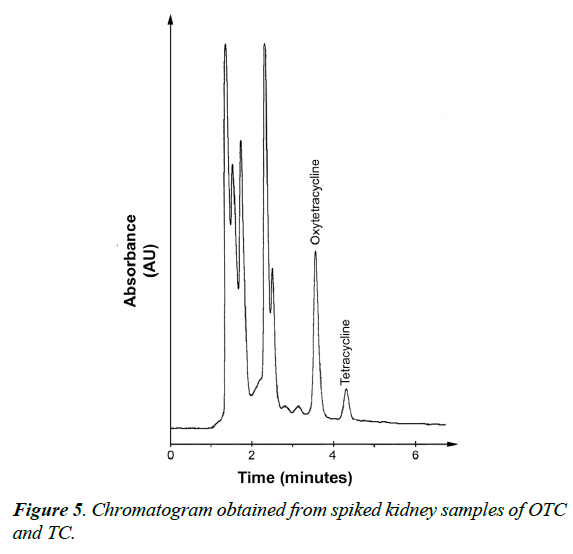
Moreover, to insure validation of analytical method and verify the absence of potential interfering substances around the retention time of both OTC and TC compounds, a number of blank and spiked chicken meat samples were analyzed in order to assess the specificity of the method. The results showed that, no interference was observed in the region where OTC and TC were eluted as shown in Figures 3-5.
Also, linear plots were obtained for both OTC and TC and the equation for the calibration curve was Y=7609.9 × -377.67, Y= 9032.2 × - 702.01 and the correlation coefficient (R2) equaled 0.9985 and 0.9979 for OTC and TC, respectively as showed in Figure 6.
Recovery trials
Table 2 summarizes the mean recovery percentage of spiked OTC samples at different concentrations of 0.1, 0.2, 1.0 and 2.0 μg/g. Chicken muscle samples showed 84.22, 86.11, 86.95 and 90.62 recovery percentages, respectively with an average of 86.97; while liver samples showed recovery of 80.22%, 84.54%, 82.32 and 86.50%, respectively with an average of 83.39%. Kidney samples had recovery of 82.36%, 85.04%, 80.91% and 87.30%, respectively with an average of 83.90%.
Regarding recovery percentages of TC spiked samples, Table 3 summarizes the recovery percentage at the same spiking levels for OTC which recorded 81.24%, 77.76%, 73.66 and 77.58% for muscle samples, respectively with an average of 77.56%. Liver spiked samples had recovery percentages of 79.82%, 75.58%, 68.31% and 74.82%, respectively with an average of 74.63%; while kidney spiked samples showed recovery percentages of 80.55%, 74.17%, 69.78% and 73.40%, respectively with an average of 72.45%. The results which declared that the method was highly sensitive for OTC than TC.
A recovery from 50% to 80% for tetracyclines and their epimers from spiked chicken muscle samples with the same mobile phase recorded by Gajda and Posyniak [16] while, higher recovery percentage (more than 91%) was recorded [3].
Incidence of Tetracycline’s veterinary drug residues in the examined samples
Incidence of OTC drug residues in the examined samples The residue concentrations of OTC were detected in 46 (28.75%) of breast muscle samples from 0.08 to 0.35 μg/g with a mean value of 0.1296 ± 0.0532. Four samples (8.69%) showed residues above the MRL as recorded [5], while the residual concentrations were detected in 120 (75%) of thigh muscle samples with quantities ranged from 0.08 to 0.32 μg/g and with a mean value 0.1618 ± 0.0532. Nineteen samples (15.83%) showed residue concentration above the MRL as set [5] (Tables 4 and 5).
All liver and kidney samples (100%) examined contained OTC. Liver samples contained OTC in quantities ranged from 0.14 to 3.36 μg/g and a mean value of 0.7223 ± 0.5176 μg/g and in quantities ranged from 0.20 to 3.83 μg/g, with a mean value 1.3211 μg/g ± 0.7850 for kidney samples. Seventy two (45%) liver samples showed residual concentration above the MRL while eighty two (51.25%) kidney samples showed residue levels above the MRL as set [5] (Tables 4 and 5).
Our findings proved that OTC percent was higher in liver and kidney samples than breast and thigh muscle samples. The results were not unusual since the liver and the kidney are the major storage and excretory organs for tetracycline’s [2] and due to general increases in the abuse of OTC antibiotic drugs in some farms where withdrawal period is not observed before slaughtering of the chicken. Moreover, Prescott and Baggot [17] stated that tetracyclines were undergo extensive entrohepatic circulation which lead to prolongation of their elimination halflifes; thus persisting in the body for long time after cessation of drug administration. Long withholding periods for oral administration of tetracyclines (up to 21 days depending on indication and type of drug) have been recommended in the USA [18].
Nearly similar results was recorded [3] who examined 100 chicken samples and found that 57.1% of the muscles were positive for OTC residues while they found lower concentrations, 23.1% and 66.7% in liver and kidney samples respectively.
Incidence of TC residues in the examined samples
The residual concentrations of TC were detected in 8(5%) of breast muscle in quantities ranged from 0.13 to 0.80 μg/g and a mean value of 0.3905 ± 0.2633. Four (50%) of the examined samples showed residues above the MRL (Tables 6 and 7). The wide variation in the quantities of residues detected in the examined breast muscle samples may be due to differences in the route of the drug administration for treatment purposes and/ or through drinking water or by addition to the animal feed as growth promoters and these indicates differences in animal husbandry practices from different farms.
The residual concentrations of TC was detected in 20 (12.5%) of thigh muscle samples with a concentration ranged from 0.15 to 0.50 μg/g and a mean value of 0.2720 ± 0.1281. Ten samples (50%) of the examined samples showed residues above the MRL (Tables 6 and 7).
In case of liver samples the residual concentrations was detected in 21 (13.1%) with a concentration ranged from 0.13 to 0.26 μg/g and a mean value 0.1734 ± 0.0327. Moreover, the residual concentration level was detected in 8 (5%) of the examined kidney samples in quantities ranged from 0.14 to 0.32 μg/g, and a mean value of 0.2107 ± 0.0811. None of the examined liver and kidney samples had residues of TC drug above the MRL (Tables 6 and 7). In spite of, tetracycline residues were detected with a high percentage in the liver samples than in the kidney samples. This could suggest that, these samples were taken at the time when drug were metabolized in the liver not yet at the stage of clearance by the kidney. Therefore, antibiotics were most often administered close to the time of slaughter.
Similar results was reported by Abdulsalam et al. [19] who recorded that tetracycline residues were found more in cattle liver (44%) than its kidney samples (12%). Muriuki et al. [20] found that the percentage of TC residues in chicken samples were 24%, 14% and 7.6% in liver, kidney and muscle samples, respectively.
Acknowledgements
The authors thank the Egyptian Ministry of Higher Education who funded the student to complete her research work at the United Graduate School of Drug Discovery and Medical Information Sciences in Japan and offer their thanks to Dr. Kitada who supervised the student during her stay in his lab in Japan.
References
- Wasch KD, Okerman L, Croubels S, et al. Detection of residues of tetracycline antibiotics in pork and chicken meat: Correlation between results of screening and confirmatory tests. Analyst. 1998;123(27):2737-41.
- Al-Ghamdi MS, Al-Mustafa ZH, El Morsy F, et al. Residues of tetracycline compounds in poultry products in the eastern province of Saudi Arabia. Public Health J. 2000;114:300-04.
- Shahid MA, Siddique M, Abubakar M, et al. Status of oxytetracycline residues in chicken meat in Rawalpindi Islamabad area of Pakistan. Asian J Poultry Sci. 2007;1(1):8-15.
- Antonio DC, Manuela N. Liquid chromatographic-mass spectrometric methods for analysing antibiotic and antibacterial agents in animal food products. Depart of Chemistry, Sapienza Univ, Piazza Aldo Moro, Rom, Italy. 2002;5(1-2):00185.
- World Health Organization/Food Agriculture Organization (WHO/FAO). Veterinary drug residues in food (Maximum Residual Limits).Codex AlimentaviusCommissin. 2010
- Okerman L, Croubels S, Cherlet M, et al. Evaluation and establishing the performance of different screening tests for tetracycline residues in animal tissues. Food additives and contaminants. 2004;21(2):145-53.
- Van penteguem C, Daeselaire E, Heeremans A. Residues of growth promotors-Food analysis by HPLC. 2nd Ed. Marcel Dekker, New York, 2000; 965 -85.
- Uekane MT, Aquino RF, Gomes LN. Development and validation of a method for the analysis of tetracyclines in chicken muscle by liquid chromatography- electrospray- mass spectrometry in tandem (LC-ESI-MS/MS). Quim Nova. 2011;34(1):43-8.
- Schneider MJ, Braden SE, Reyes-Herrera I. et al. Simltaneous determination of Fluoroquinolones and tetracyclines in chicken muscle using HPLC with fluorescence detection. J of Chromatogr B. 2007; 846:8-13.
- Oka H, Matsumota H, Uno K, et al. Improvement of chemical analysis of antibiotics: VIII. Application of pre packed C18 Cartridge for analysis of tetracycline residues in animal liver. J Chromatogr. 1985;325:65.
- Furusawa N. High-performance liquid chromatographic determination/identification of oxytetracycline and sulphadimidine in meat and eggs. Chromatographia. 1999;49:718.
- Gomez KA, Gomez AA. Statistical Procedures for Agriculture Research. 2nd Ed. Jahn Wiley Sons, New York, USA. 1984.
- Duncan DB. Multiple Rang and Multiple F-test. Biometries. 1955;11:1-24.
- Biswas AK, Rao GS, Kondaiah N, et al. A simple Multi-residue Method for determination of ox tetracycline, tetracycline and chlortetracycline in Export Buffalo Meat by HPLC-photodiode array detector. J of Food and Drug analysis. 2007;15(3):278-84.
- Dipeolu M, Kanamaru Y. The establishment of a method of analysis of tetracycline residues in meat. Res Bull Fac Agr Gifu Univ. 1996;61:141-46.
- Gajda A, Posyniak A. Tetracycline and their epimers in animal tissues by High Performance Liquid Chromatography. Bull Vet Inst Pulawy 2009; 53:263-67.
- Prescott JF, Baggot JD. Antimicrobial therapy in veterinary medicine. 2nd Ed. Iowa State Univ, Iowa. 1993;215-28.
- Sundlof SF. Antimicrobial drug residues in food producing animals. In: Prescott JF and Baggot JD (eds.), 2nd Ed. Antimicrobial therapy in veterinary medicine, Iowa State Univ, Iowa. 1993;569-591.
- Abdulsalam II, Abdukadir UJ, Muhammad KG. Multiple antibiotic residues in meat from slaughtered cattle in Nigeria. Int J of Vet Med. 2010;8(1):1-5.
- Muriuki FK, Ogara WO, Njeruh FM, et al. Tetracycline residue levels in cattle meat from Nairobi slaughter house in Kenya. J of Vet Sci. 2001;2(2):97-101.
