Research Article - Research and Reports in Immunology (2018) Volume 2, Issue 1
Derivative spectrophotometric method for the determination of clarithromycin in pharmaceutical formulation and application to in-vitro dissolution
Waseem Hassan1*, Bakht Zaman1, Bakhtiar Ali2
1Institute of Chemical Sciences, University of Peshawar, Khyber Pakhtunkhwa, Pakistan
2Department of biochemistry, Hazara University, Dhodial Khyber Pakhtunkhwa, Pakistan
- *Corresponding Author:
- Waseem Hassan
Institute of Chemical Sciences
University of Peshawar
Khyber Pakhtunkhwa
Pakistan
Tel: 0092-91-9216652
E-mail: waseem_anw@yahoo.com
Accepted date: March 16, 2018
Citation: Hassan W, Zaman B, Ali B. Derivative spectrophotometric method for the determination of clarithromycin in pharmaceutical formulation and application to in-vitro dissolution. Res Rep Immunol. 2018;2(1):1-8
DOI: 10.35841/immunology.2.1.1-8
Visit for more related articles at Research and Reports in ImmunologyAbstract
A simple spectrophotometric method has been developed and validated for quantitative determination of Clarithromycin (CLT) in pharmaceutical formulations. The method is based on derivatization of CLT with Bromotrimethylsilane (TMBS) and spectrophotometric estimation of CLT derivative at 268 nm using double beam spectrophotometer and quartz cells of 1 cm path length. Bear law obeyed over a concentration range of 5.0 to 60 μg mL-1 with specific absorbance (A=1%) of Clarithromycin derivative was 62.4 ± 0.2.0. The method was validated appropriately for accuracy, precision, linearity and specificity, according to the requirements of United State Pharmacopeia and International Conference on Harmonization guidelines for validation of analytical method (category I). The overall recovery of CLT was 100% ± 1% and RSD for precision and intra-day precision was less than 2.0%. The calibration curves were linear with correlation coefficient (R2>0.9998) and there was no interference of placebo of clarithromycin dosage form. The method was successfully used for determination of CLT in dosage form and in vitro dissolution studies.
Keywords
Clarithromycin, spectrophotometric determination, pharmaceutical dosage form, in-vitro dissolution.
Introduction
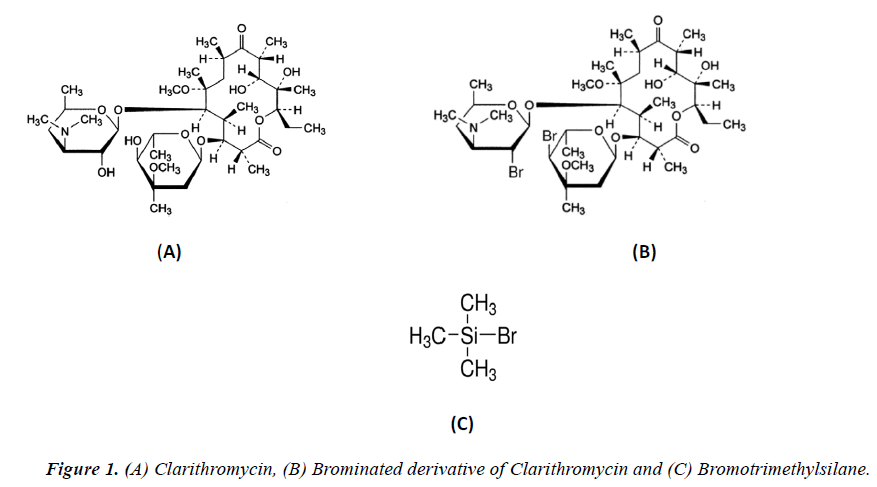
Clarithromycin (CLT-C38H69NO13) is a macrolide antibiotic (Figure 1a) derived from erythromycin with similar use and more activity than erythromycin. CLT is used in the treatment of respiratory tract infection, skin infections and soft tissue infections against susceptible Streptococci, Staphylococci, Moraxella catarrhalis, Legionella, Chlamydia trachomatis, Ureaplasma, Urealyticum and opportunistic Mycobacteria. It is more effective than azithromycin or erythromycin against Mycobacterium avium complex [1]. CLT is also used in the treatment of leprosy and in regimens for the eradication of Helicobacter pylori in peptic ulcer disease [2]. It also enhances the activity of anti-mycobacterials against mycobacterium tuberculosis [3,4]. CLT was developed in 1980 by Taisho Pharmaceutical Japan and the pharmaceutical formulation (Biaxin tablets) was approved by US FDA in October 1991 [5]. CLT is one of the important medications needed in a basic health system [6] and generic pharmaceutical formulation of CLT is now available worldwide as tablets, extended release (XL) tablets, oral suspension and powder for injection.
CLT drug substance is white or almost white crystalline powder. It is practically insoluble in water, slightly soluble in alcohol but completely soluble in acetone and in methylene chloride [7]. Due to low solubility and poor dissolution behavior CLT is classified in Biopharmaceutical Classification System (BCS) class II, having low bioavailability. CLT has better solubility under acidic conditions due to amine protonation but it is quite labile toward acid-catalyzed degradation and have poor chemical stability [8].
In-vitro dissolution studies of pharmaceutical dosage form are important and a basic criteria to evaluate the release and solubilization of the active drug substance from drug product and predict the in vivo performance of different formulations [9,10]. The In vitro dissolution studies are also important for XL dosage form to check correct release of drug substance at physiological conditions with different intervals and establish comparative studies for new formulation with existing formulation [11]. In this point of view it was considered to have an accurate, precise and rapid spectrophotometric analytical method to quantify the amount of CLT drug substance in product and dissolution medium.
Different analytical methods are described in literature for analysis of CLT bulk material, dosage form and in vitro dissolution like HPLC-UV [12] for clinical study, HPLC-UV with pre-column derivatization [13-15] for detection of CLT related compound, HPLC-UV [16,17] for clinical study, HPLCelectrochemical detection [18-22], HPLC-MS/MS [23-25], HPLC- fluorescence [26] and HPLC-amperometric detection [27] are some of the classic literature reported procedures. Spectrofluorimetric [28] and extractive spectrophotometric [29] method are also available in literature for quantification of CLT in pharmaceutical formulation. However to the best of our knowledge there is no spectrophotometric method available in literature for the study of in vitro dissolution of CLT in pharmaceutical formulations.
The aim of the present work was to develop and validate a rapid, sensitive and accurate spectrophotometric method for quantitative determination of CLT in dosage form that can be applied for routine in vitro dissolution analysis. For this purpose a simple spectrophotometric method was developed, based on derivatization of CLT TMBS (Figure 1b). Spectrophotometric determination of the derivative of CLT (Figure 1c) was achieved on 268 nm and the method was successfully validated and applied for determination of CLT in dosage form and in vitro dissolution.
Experimental
Materials and chemicals
CLT USP reference standard (Sigma-Aldrich) having purity 98.26%, CLT drug substance bulk material (Jiangsu Botai Pharmaceuticals Co. Ltd. China), excipients of tablets and dry suspension i.e carnauba wax (USP), microcrystalline cellulose (USP), titanium dioxide (USP), stearic acid (USP), calcium stearate (USP), sucrose (USP), purified talc (USP), precipitated calcium carbonate (USP), corn starch (BP), lactose monohydrate(USP), white shellac (USP), hydroxypropylcellulose (USP), povidone (USP), hydrophobic colloidal silica (USP) and generic brands of immediate release (IR) tablets 250 mg and 500 mg, XL tablets 500 mg, dry suspension 125 mg/5 mL and taste masked coated granules for dry suspension (Surge Laboratories Pak) was provided by Genome Pharmaceuticals (Pvt) Ltd.
Pharmaceutical dosage form Claritek® (Getz Pharma Pak) tablets 250 mg and 500 mg, XL tablets 500 mg and dry suspension 125 mg/5 mL, Klaricid® (Abbot Laboratories Pak) IR tablets 250 mg and 500 mg, XL tablets 500 mg and dry suspension 125 mg/5 mL was purchased from local pharmacy. TMNS, methanol analytical reagent grade (AR), sodium acetate, potassium dihydrogen phosphate, dichloromethane, and chloroform (Sigma Aldrich, Germany) were purchased from science center.
Instrumentation
Shimadzu UV-1601 PC double beam UV–visible spectrophotometer equipped with UV probe software version 1.11 (Shimadzu, Kyoto, Japan), 1-cm quartz cell, electronic balance AW-220 (Shimadzu, Kyoto, Japan), USP dissolution apparatus (Galvano Scientific Pak), ultrasonic bath Sonorex (Bandelin Germany), laboratory centrifuge (Thermofisher Scientific Inc.) millipore vacuum filtration assembly and milli-Q water distillation system (Millipore USA) was used in this work.
Sample and reference stock solution
Stock solution of CLT working standard and bulk material was prepared, by weighing a quantity of pure CLT on dried basis equivalent to 50 mg and transfered into 100 mL volumetric flask and dissolved in 5 mL methanol. The volume was brought up to 100 mL with water to make CLT 500 μg mL-1 standard stock solution. The standard stock solution was further diluted with water to a required concentration for method development and validation.
For sample solution of tablets 250 mg and 500 mg dosage form, 20 tablets of CLT each brands were crushed to make fine powder. Powder equivalent to 100 mg CLT was weighed, separately transferred into 100 mL volumetric flask and dissolved in 5 mL methanol. The volume of solution was brought up to 100 mL with water to make CLT 500 μg mL-1 sample stock solution. For sample solution of dry suspension 10 g powder was crushed to make fine powder, and preceded according to the procedure for sample preparation of tablets solution. The sample stock solution was filtered through 0.45 μm nylon filter (Millipore) and further diluted to required concentration for method development and validation.
In vitro dissolution of tablets
Dissolution parameters i.e. USP dissolution apparatus type-II (paddle type), at 50 rpm ± 4% and 900 mL ± 1% dissolution medium containing 0.1 M sodium acetate pH 5.0 ± 0.05 was followed for IR tablets and USP dissolution apparatus type-II (Paddle type), at 75 rpm ± 4% and 900 mL ± 1% dissolution medium containing 0.3 M potassium phosphate pH 6.0 ± 0.05 was selected for XL tablets, following test 1 of USP [12].
The dissolution medium was added to each of dissolution bowl and temperature was equilibrated at 37.0 ± 0.5ºC. Tablets samples were added to each of 6 dissolution bowls in series with time gap of 2 minutes to manage the accurate time of sample collection as per prescribed schedule. At specified time intervals 5, 10, 15, 20, 30 and 60 min for IR tablets and 30, 45, 60, 120 and 180 minutes accurately for XL tablets, 10 mL sample was collected from each dissolution bowl using bent SS cannula and equal volume of the dissolution medium was replaced to maintain a constant total volume in bowl. The sample aliquots were filtered through 0.45μm Nylon filter (Millipore) and extracted separately with dichloromethane for further derivatization. The content of CLT in medium was determined through CLT derivative using proposed spectrophotometric method.
Extraction and derivatization procedure
To a series of 20 mL glass centrifuge tube 2 mL aliquot portions of diluted standard and sample solutions were transferred separately, 5 mL of dichloromethane was add to each tube, shaken for 5 min, the gas was released by losing the cap and centrifuged for 5 min at 3000 rpm. After a clear separation, the water layer was separated carefully and discarded. To organic layer 0.5 mL concentrated TMBS analytical grade was added to each tube, vortexed briefly and kept at 0ºC for 10 minutes. After specified time the reaction was terminated by adding 2 mL water to each tube and vertexed for 2 minutes. The solution was centrifuged again at 3000 rpm for 5 min, the water layer was discarded and organic layer was reconstituted to 10 mL with methanol, Spectrophotometric absorbance was measured at 268 nm using blank solution prepared in the same manner without adding CLT solution.
Method validation
Different performance parameters of the analytical method were validated according to USP [31] and ICH [32] guidelines. Accuracy and recovery studies were performed on samples containing known amount of CLT (n=6) at six concentrations levels 20% to 120% ranging from 10 to 60 μg mL-1. Results of recovery were checked against acceptance limits ± 2% for relative error (RE) and accuracy were evaluated against relative standard deviation (RSD %) acceptable limits ≤ 2%. Repeatability, precision and intra-day precision were assured by analyzing replicates (n=6) reference solution at medium, high and low concentration level 20 , 60 and 120%, having known amount of CLT 10, 30 and 60 μg mL-1 at same day and different days.
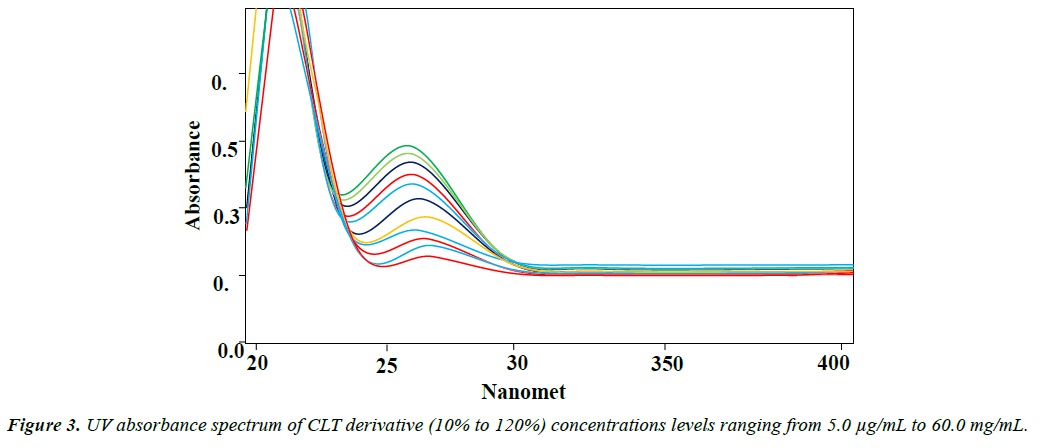
Linearity of the method was assured analyzing seven concentrations level (n=6) covering a range 10% to 120% of assay, having known concentration of CLT 5.0 to 60.0μg mL-1. UV absorbance (A) was plotted against concentration and based on least square linear regression equation and graphical presentation the relation of concentration and response was evaluated. Limit of detection LOD and Limit of quantification LOQ were calculated using expression (3.3 /slope) and (10 / slope) respectively.
Results and Discussion
Optimization of experimental conditions
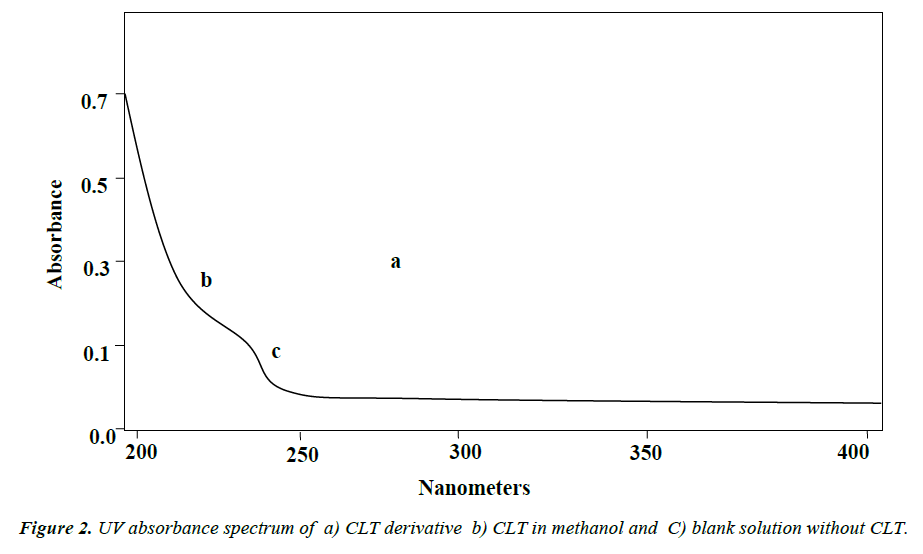
Due to lacking of chromospheres, CLT shows a weak absorbance in UV region below 220 nm (Figure 2a) that is not suitable for precise and specific spectrophotometric determination. For this purpose a chemical derivatization is required to increase detection sensitivity and improved selectivity [30]. A number of chemical derivatization procedures are reported in literature for analysis of CLT on HPLC [13-17]. For spectrophotometric detection TMBS was selected due to minimum reported optimum reaction time about 2 minutes and greater sensitivity at UV region. TMBS reacts readily with the hydroxyl groups of CLT and yields brominated derivative of CLT (Figure 2b). Absorption spectra 200-400 nm for CLT derivative solution in methanol was obtained (Figure 2c) that exhibits absorption maxima at 268 nm and 218 nm. An absorption maximum at wavelength 268 nm is suitable for specific and precise spectrophotometric detection and quantification of CLT.
A set of optimum conditions suitable for analysis of CLT dosage form and in vitro dissolution was developed considering the extraction of CLT from sample solution and dissolution medium, reaction time and stability of CLT derivative in final solution. Dichloromethane was found suitable solvent for the quantitative extraction of CLT. It required minimum time for shaking, one step extraction and clear separation of layers as compared to other organic solvents like chloroform, toluene, dichloromethane and ethyl acetate. The optimum volume 0.5 mL of TMBS is suitable for all concentration range 5 μg mL to 60 μg mL, neutralizing the excessive volume by 2 mL of water after 10 minutes reaction time at 0ºC. The optimized conditions of proposed method was further validated for accuracy, precision, linearity, and specificity, according the requirement of USP and ICH guidelines Figure 3.
Accuracy and recovery: Accuracy and recovery studies was performed on samples having known amount of CLT at six concentrations levels 20% to 12 % ranging from 10 to 60 μg mL-1. Replicates (n=6) of each solution were extracted and derivatized according to optimum conditions and recovery was checked against reference solution. Results (Table 1) showed that overall recovery of CLT was 100% ± 1% at each concentration level, the RSD% and RE% of recovery studies was less than 2.0%. The results show that the method is accurate and suitable for assay of CLT in tablets and in-vitro dissolution studies.
| Concentration Analyzed (µg/mL) n=6 |
Concentration recovered µg/mL (Mean ± SD) |
% Assay (Mean ) |
% RE | % RSD |
|---|---|---|---|---|
| 10 | 9.91 ± 0.16 | 99.1 | 0.9 | 1.61 |
| 20 | 19.92 ± 0.22 | 99.6 | 0.4 | 1.1 |
| 30 | 29.97 ± 0.14 | 99.9 | 0.1 | 0.47 |
| 40 | 39.9 ± 0.27 | 99.75 | 0.25 | 0.68 |
| 50 | 49.76 ± 0.41 | 99.52 | 0.48 | 0.82 |
| 60 | 59.89 ± 0.31 | 99.82 | 0.18 | 0.52 |
Table 1. Results of recovery studies.
Precision and repeatability: Results (Table 2) for intra-day and inter-day precision for medium, high and low concentration level 20, 60 and 120% i.e. 10, 30 and 60 μg mL-1 of CLT solution analyzed (n=6), over a period of 3 days. The RSD for Absorbance was ≤ 2.0% for all solutions. The relative standard deviations indicate the high precession and repeatability and reflect the usefulness of the method for routine analysis of CLT.
| Days | Concentration Analyzed (n=6) µg/mL |
Concentration recovered µg/mL (Mean ± SD) |
% Assay (Mean ) |
% RSD |
|---|---|---|---|---|
| Day 1 | 10 | 9.94 ± 0.14 | 99.4 | 1.41 |
| 30 | 29.81 ± 0.23 | 99.37 | 0.77 | |
| 60 | 59.7 ± 0.24 | 99.5 | 0.4 | |
| Day 2 | 10 | 9.91 ± 0.16 | 99.1 | 1.61 |
| 30 | 29.86 ± 0.26 | 99.53 | 0.87 | |
| 60 | 59.73 ± 0.46 | 99.55 | 0.77 | |
| Day 3 | 10 | 9.97 0 ± 0.12 | 99.7 | 1.2 |
| 30 | 29.89 ± 0.22 | 99.63 | 0.74 | |
| 60 | 59.83 ± 0.64 | 99.72 | 1.07 |
Table 2. Results of precision studies.
Linearity: Linearity of the method was assured from calibration curve of concentrations vs. absorbance of CLT 5, 10, 20, 30, 40, 50, and 60 μg mL-1. Based on statistical evaluation the relationship of concentration and absorption was determined. The main linear regression equation for linearity of CLT was found as (A=0.006C -0.00125), and the correlation coefficient was (R2=0.9998). The limit of detection (LOD) was 1.055 μg mL-1, and limit of quantification (LOQ) was 3.197 μg mL-1. Statistical data (Table 3) derived from linearity curve showed good linearity and reflect the suitability of the method for analysis of CLT in vitro dissolution studies.
| Correlation R2 | 0.9998 |
| Slope | 0.00625 |
| Intercept | -0.00125 |
| SD | 0.002 |
| LOD (µg/mL) | 1.055 |
| LOQ (µg/mL) | 3.197 |
Table 3. Characteristics of the analytical method derived from the calibration curve.
Selectivity and placebo interference: A mixture of all excipients of tablets and dry suspension was prepared without adding drug substance of CLT. Sample of both mixtures was prepared following the same procedure as for sample preparation and derivatization. The samples were analyzed on UV range from 200 nm to 400 nm and no absorbance was noted for both samples at wavelength above 268 nm. Specificity was also determined by spiking the sample with appropriate level of excipients that showed no significant alteration in absorbance. The results showed that there was no absorbance interference of other excipients present in tablets and dry suspension. The proposed method was specific for the analysis of CLT in the tablets and dry suspension.
Application of method and in-vitro dissolution of tablets
To demonstrate the usefulness of the analytical method, CLT pharmaceutical dosage forms collected from market were analyzed for assay determination applying the same procedure for extraction and derivatization. The results (Table 4) were compared with results obtained analyzing the same samples on HPLC using official method from USP [12]. Repeated results were obtained and the % RSD was found below 2%. The drug release profile of local generic products was compared with Klaricid® (Abbot Laboratories Pak) IR and XL tablets. The comparison of dissolution profiles was evaluated according to FDA guidelines using simple model independent approach. The values of difference factor f1 and the similarity factor f2 was evaluated against limits ≤ 15 and f2 against limits ≥ 50.
| Brand | Dosage form | Concentration Analyzed (n=3) (µg/mL) |
Proposed Method | Official HPLC Method | ||
|---|---|---|---|---|---|---|
| Recovery µg/mL (mean ± SD) | % Assay | Recovery µg/mL (mean ± SD) | % Assay | |||
| - | CLT bulk Materials | 50 | 49.61 ± 0.38 | 99.22 | 49.85 ± 0.43 | 99.7 |
| Klaricid® | Tablets 250 mg | 50 | 49.97 ± 0.46 | 99.94 | 50.12 ± 0.81 | 100.24 |
| Tablets 500 mg | 50 | 49.33 ± 0.25 | 98.66 | 49.68 ± 0.36 | 99.36 | |
| Suspension 125 mg | 50 | 50.62 ± 0.49 | 101.24 | 50.18 ± 0.29 | 100.36 | |
| Claritek® | Tablets 250 mg | 50 | 49.28 ± 0.73 | 98.56 | 49.77 ± 0.48 | 99.54 |
| Tablets 500 mg | 50 | 50.24 ± 0.44 | 100.48 | 50.65 ± 0.21 | 101.3 | |
| Suspension 125 mg | 50 | 49.76 ± 0.32 | 99.52 | 49.52 ± 0.59 | 99.04 | |
| Generic Brand | Tablets 250 mg | 50 | 50.43 ± 0.54 | 100.86 | 49.95 ± 0.75 | 99.9 |
| Tablets 500 mg | 50 | 49.63 ± 0.87 | 99.26 | 49.82 ± 0.39 | 99.64 | |
| Suspension 125 mg | 50 | 50.12 ± 1.03 | 100.24 | 49.64 ± 0.65 | 99.28 | |
Table 4. Analysis for assay of CLT bulk material and dosage form.
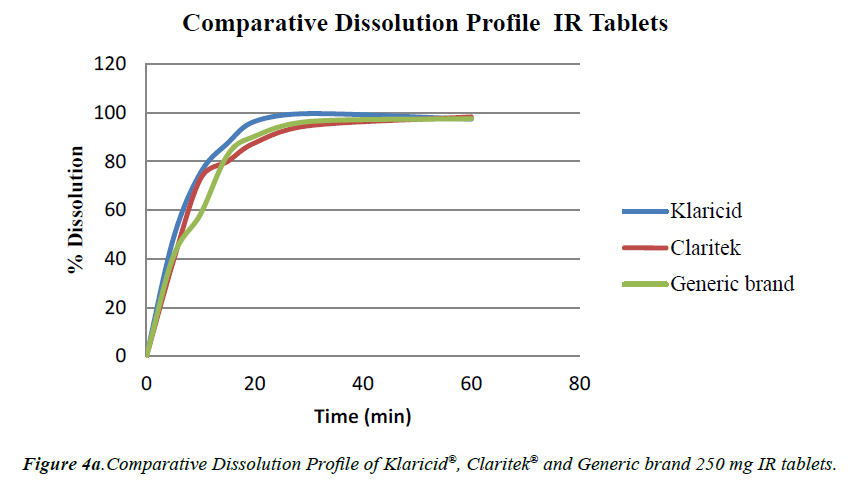
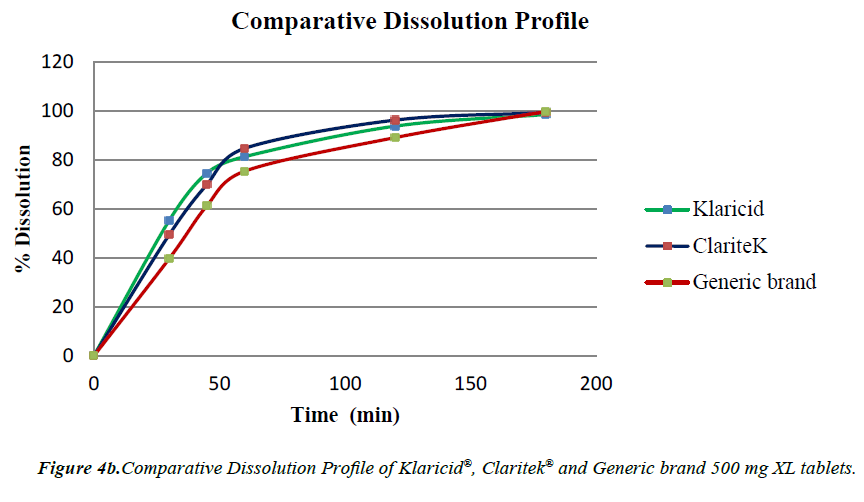
The method was also applied to recovery of CLT in dissolution samples. For this purpose comparative dissolution studies were performed on CLT 250 mg IR tablets and CLT 500 mg XL tablets of different brands using same condition for dissolution as described by USP [12] and results were summarized in Table 5. The amount of CLT dissolved in medium at physiological conditions was determined using the same validated method. The similarity factors (f2) were 55, 54 and difference factors (f1) were 7, 8 for dissolution profiles of Klaricid with Claritec and Klaricid and generic brand IR tablets respectively. Similarly the values of f2 were 70, 48 and f1 were 4,10 for XL brands respectively.
| Time (min) | Klaricid® | Claritek® | Generic brand | |
|---|---|---|---|---|
| % Dissolution CLT IR tablets (n=6) | ||||
| 5 | 48.56 ± 6.43 | 39.31 ± 4.95 | 41.17 ± 8.24 | |
| 10 | 75.35 ± 3.81 | 72.89 ± 4.12 | 58.39 ± 6.19 | |
| 15 | 87.46 ± 2.19 | 79.96 ± 3.07 | 82.68 ± 4.85 | |
| 20 | 96.38 ± 3.06 | 87.56 ± 2.66 | 9.29 ± 3.45 | |
| 30 | 99.58 ± 1.27 | 94.61 ± 2.23 | 96.33 ± 2.41 | |
| 60 | 97.33 ± 1.08 | 98.25 ± 1.76 | 97.49 ± 2.35 | |
| % Dissolution CLT XL tablets (n=6) | ||||
| 30 | 55.31 ± 4.69 | 49.42 ± 6.11 | 39.74 ± 5.78 | |
| 45 | 74.65 ± 4.78 | 69.97 ± 5.32 | 61.3 ± 4.12 | |
| 60 | 81.38 ± 3.55 | 87.75 ± 4.19 | 75.44 ± 3.56 | |
| 120 | 93.86 ± 2.76 | 96.32 ± 3.22 | 89.19 ± 2.49 | |
| 180 | 98.61 ± 3.19 | 99.4 ± 2.81 | 99.83 ± 1.73 | |
Table 5. Comparative dissolution profile of klaricid®, claritek® and generic brand 250 and XL 500 mg.
To obtain the in vitro dissolution profile of the product, the cumulative percentage of CLT released was plotted against time. The graphical presentation (Figure 4a and 4b) and statistical evaluation of results, the dissolution of all generic brands showed nearly similar behavior. Both IR and XL brands meets the USP criteria for dissolution.
Conclusion
Accurate and precise analytical method for assay determination and In vitro dissolution studies of pharmaceutical dosage form is an important tool to determine the quality of the product. In vitro dissolution is very important to evaluate the release and solubilization of the active drug substance from the drug product and predict the delivery of required dose correctly to the patients. The proposed spectrophotometric method for the quantification of CLT in dosage forms and in vitro dissolution at 268 nm based on derivatization of CLT is accurate, precise, linear and specific and successfully validated according to the requirements of USP and ICH guidelines. All the results of tests carried out for validation of the method are in complete agreement with the required limits and criteria. The method is successfully applied for analysis of CLT in dosage form and in vitro dissolution studies. It is concluded that the method is suitable for intended purpose i.e. determination of CLT in pharmaceutical dosage form and in vitro dissolution studies.
Acknowledgements
The authors are thankful to Genome Pharmaceuticals (Pvt) Ltd. for providing samples and facilitate for this study.
References
- Sweetman SC, Martindale I. The Complete Drug Reference Pharmaceutical Press, London 2004;34:192-3.
- Hassan IJ. Activities of β-Lactams and Macrolides againstHelicobacter pylori. Antimicrobial agents and chemotherapy 1999;43:1387-92.
- Cavalieri SJ, Biehle JR, Sanders WE. Synergistic activities of clarithromycin and antituberculous drugs against multidrug-resistant Mycobacterium tuberculosis. Antimicrobial agents and chemotherapy 1995;39:1542-5.
- Mor N, Esfandiari A. Synergistic activities of clarithromycin and pyrazinamide against Mycobacterium tuberculosis in human macrophages. Antimicrobial agents and chemotherapy 1997;41:2035-6.
- Greenwood D. Antimicrobial drugs: chronicle of a twentieth century medical triumph. Oxford University 2008; pp:139-40.
- WHO Model List of Essential Medicines. World Health Organization 19th edition (2015).
- British Pharmacopeia. British pharmacopeia commission London 2016;1:577-9.
- Pereira JM, Mejia-Ariza R, Ilevbare GA, et al. Interplay of degradation, dissolution and stabilization of clarithromycin and its amorphous solid dispersions. Molecular pharmaceutics 2013;10:4640-53.
- Polli JE. IVIVR versus IVIVC, Dissolution Technologies 2000;7:6-9.
- Emami J. In vitro–in vivo correlation: from theory to applications. J Pharm Pharm Sci 2006;9:169-89.
- Azarmi S, Roa W, Lobenberg R. Current perspectives in dissolution testing of conventional and novel dosage forms. International Journal of pharmaceutics 2007;328:12-21.
- Rockville MD, USP 39-NF 34. United States Pharmacopeial Convention, Inc 2016;3:3193-200.
- Li W, Jia H, Zhao K. Determination of clarithromycin in rat plasma by HPLC-UV method with pre-column derivatization. Talanta 2007;71:385-90.
- Amini H, Ahmadiani A. Sensitive determination of clarithromycin in human plasma by high-performance liquid chromatography with spectrophotometric detection. Journal of Chromatography B 2005;817:193-7.
- Bahrami G, Mohammadi B. Determination of clarithromycin in human serum by high-performance liquid chromatography after pre-column derivatization with 9-fluorenylmethyl chloroformate: application to a bioequivalence study. Journal of Chromatography B 2007;850:417-22.
- Morgan D, Cugier P, Marello B, et al. Impurity profiling of clarithromycin using high-performance liquid chromatography with ultraviolet detection. Journal of Chromatography A 1990;502:351-8.
- Morgan DK, Brown DM, Rotsch TD, et al. A reversed-phase high-performance liquid chromatographic method for the determination and identification of clarithromycin as the drug substance and in various dosage forms. Journal of pharmaceutical and biomedical analysis 1991;9:261-9.
- Niopas I, Daftsios AC. Determination of clarithromycin in human plasma by HPLC with electrochemical detection:validation and application in pharmacokinetic study. Biomedical Chromatography 2001;15:507-8.
- Wibawa JID, Shaw PN, Barrett DA. Quantification of clarithromycin, its 14-hydroxy and decladinose metabolites in rat plasma, gastric juice and gastric tissue using high-performance liquid chromatography with electrochemical detection. Journal of Chromatography B 2003;783:359-66.
- Jiang Y, Wang J, Li H, et al. Determination of clarithromycin in human plasma by liquid chromatography-electrospray ionization tandem mass spectrometry. Journal of pharmaceutical and biomedical analysis 2007;43:1460-4.
- Chu S, Sennello LT, Sonders RC. Simultaneous determination of clarithromycin and 14 (R)-hydroxyclarithromycin in plasma and urine using high-performance liquid chromatography with electrochemical detection. Journal of Chromatography B: Biomedical Sciences and Applications 1991;571:199-208.
- Pappa-Louisi A, Papageorgiou A, Zitrou A, et al. Study on the electrochemical detection of the macrolide antibiotics clarithromycin and roxithromycin in reversed-phase high-performance liquid chromatography. Journal of Chromatography B: Biomedical Sciences and Applications 2001;755:57-64.
- Peng X, Wang Z, Li J, et al. Electrochemiluminescence detection of clarithromycin in biological fluids after capillary electrophoresis separation. Analytical Letters 2008;41:1184-99.
- Van RGF, Smit MJ, de Jager AD, et al. Sensitive liquid chromatography-tandem mass spectrometry method for the determination of clarithromycin in human plasma. Journal of Chromatography B 2002;68:223-9.
- Torano JS, Guchelaar HJ. Quantitative determination of the macrolide antibiotics erythromycin, roxithromycin, azithromycin and clarithromycin in human serum by high-performance liquid chromatography using pre-column derivatization with 9-fluorenylmethyloxycarbonyl chloride and fluorescence detection. Journal of Chromatography:Biomedical Sciences and Applications 1998;720:89-97.
- Taninaka C, Ohtani H, Hanada E, et al. Determination of erythromycin, clarithromycin, roxithromycin and azithromycin in plasma by high-performance liquid chromatography with amperometric detection. Journal of Chromatography B: Biomedical Sciences and Applications 2000;738:405-11.
- Khashaba PY. Spectrofluorimetric analysis of certain macrolide antibiotics in bulk and pharmaceutical formulations. Journal of pharmaceutical and biomedical analysis 2002;27:923-32.
- Shah J, Jan MR, Manzoor S. Extractive spectrophotometric methods for determination of clarithromycin in pharmaceutical formulations using bromothymol blue and cresol red. Journal of the Chinese Chemical society 2008;55:1107-12.
- You J, Ming Y, Shi Y, et al. Development of a sensitive fluorescent derivatization reagent 1, 2-benzo-3, 4-dihydrocarbazole-9-ethyl chloroformate (BCEOC) and its application for determination of amino acids from seeds and bryophyte plants using high-performance liquid chromatography with fluorescence detection and identification with electrospray ionization mass spectrometry. Talanta 2005;68:448-58.
- Rockville MD, USP 39-NF 34. United States Pharmacopeial Convention Inc 2016;2:1640-5.
- ICH Harmonised Tripartite Guideline Q2(R1). Validation of Analytical Procedures. ICH Secretariat 9, chemin des Mines, 1211 Geneva 20, Switzerland 2015.
