Research Article - Biomedical Research (2017) Volume 28, Issue 1
De Novo transcriptome assembly for analysis and functional annotation of genes expressed in Alport syndrome iPSCs
Wenbiao Chen1#, Jianrong Huang2#, Yong Dai3*1Shenzhen Guangming New District People’s Hospital, Shenzhen, Guangdong, PR China
2The Third People’s Hospital of Shenzhen, Shenzhen, Guangdong, PR China
3Second Clinical Medical College of Jinan University, Shenzhen People’s Hospital, Shenzhen, Guangdong, PR China
#These authors contributed equally to this work
- *Corresponding Author:
- Yong Dai
The Third People’s Hospital of Shenzhen
Shenzhen, Guangdong, PR China
Accepted on June 04, 2016
Abstract
Alport syndrome (AS) is an inherited disorder of collagen that affects the kidney, eye and cochlea. About 85% of AS cases are caused by a mutation in X-linked COL4A5, which encodes the alpha 5 chain of type IV collagen. AS patients inevitably develop end-stage renal disease and need replacement therapy. The mechanism by which the gene mutation results in AS is not completely known, in part because of a lack of genomic and transcriptome information about AS. In this study, an AS family contained three generations was subjected to comprehensively analyse. We performed high-throughput transcriptome sequencing on induced pluripotent stem cells (iPSCs) from AS renal tubular cells. Transcript sequences were used for gene analysis and functional characterization. Using an Illumina sequencing platform, 26,886,745 raw reads were acquired from AS cells and 29,252,903 from normal control (NC) cells. After quality control and filtering of raw reads, we obtained 26,021,874 clean reads from AS cells and 27,551,343 from NCs. Clean reads were analyzed for differences in gene expression, gene ontology (GO) analysis, Kyoto Encyclopedia of Genes and Genomes (KEGG) pathway enrichment, alternative splicing, and novel transcript prediction. Analyses showed 1168 differentially expressed genes between AS and NC samples, with 786 upregulated and 382 down regulated. GO analysis showed that the largest proportions of differentially expressed genes were in membranes and membrane components. The mitogen-activated protein kinase (MAPK) signalling pathway had the most differentially expressed genes by KEGG analysis. We predicted 881 novel transcripts in AS cells and 963 in NCs. Novel transcripts were assessed for protein-coding potential using a coding potential calculator. We used SOAP splice to detect alternative splicing of mRNA. This study lays a foundation for further research on population genetics and gene function analysis in AS.
Keywords
Alport syndrome, Transcriptome, iPSCs, Gene ontology, KEGG pathways, Alternative splicing.
Introduction
Alport syndrome (AS) is a hereditary disease that leads to kidney failure is caused by mutations to the COL4A3, COL4A4, COL4A5 genes, and absence of collagen α3α4α5 () networks found in mature kidney glomerular membrane (GBM). About 80% of AS is X-linked, due to mutations in COL4A5, the genetic encoding the alpha 5 chain of type collagen. . Induced Pluripotent Stem Cells (iPSCs) are selfrenewable and can differentiate to different types of adult cells, which has shown great promises in the field of regenerative medicine. AS is often accompanied by progressive, high-tone sensorineural hearing loss and ocular changes in form of macular flecks and lenticonus [1,2]. AS is a heterogeneous genetic disease caused by mutations in collagen type IV. Changes in podocytes and the GBM lead to early kidney fibrosis [3,4]. AS has a prevalence of 1 in 5000, and 85% of patients have the X-linked form [5]. Patients with AS commonly require renal replacement therapy by age 20 or 30 years [6]. AS diagnosis is mainly made by history and physical examination, detailed family history, urinalysis, immunohistochemical analysis of basement membranes, and examination of renal biopsy specimens by electron microscopy [7,8]. Since early stage AS leads to end-stage renal disease, early diagnosis is important [9]. Because AS is genetically heterogeneous, it can be caused by mutations in one of several genes [10]. Molecular genetics could be a powerful tool for definitive AS diagnosis [11]. We have successfully generated iPSCs from renal tubular cells previously [12]. In this study, we performed De Novo transcriptome assembly to analyze the AS family transcriptome base on iPSCs. Our goal was to understand differences in gene expression and perform bioinformatics analysis including gene ontology (GO) enrichment and Kyoto Encyclopedia of Genes and Genomes (KEGG) pathway analysis. Our data could be an important step in establishing genetic research on AS, as well as providing insights into AS pathogenesis. Our results could contribute to potentially using genes as diagnostic or prognostic tools, or therapeutic targets for AS.
Materials and Methods
Clinical sample collection
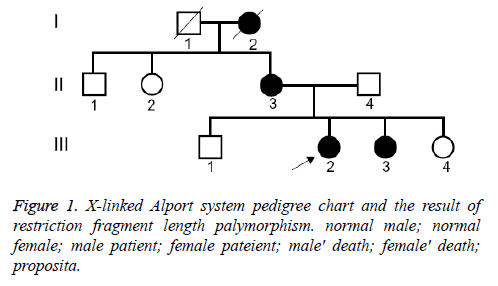
We have clinically identified AS family contained three generations (Figure 1). The propositus (III 3) who is female and 26 years old was clinically observed gross hematuria and albuminuria. She was diagnosed AS in Second Clinical Medical College of Jinan University in 2013. The propositus was subjected to kidney pathological examination and the biopsy specimens were examined under light microscope and electron microscope. The propositus grandmother (I2) was also diagnosed AS and passed away of kidney failure. The propositus mother (III 3) behaving AS symptom, included kidney failure, gross hematuria, albuminuria, sensorineural hearing loss and pathognomonic ocular lesions. Propositus sister (III 3) was also clinically observed mild gross hematuria and albuminuria. Six members from the AS family were participated in our molecular research. This study protocol and consent forms were approved by Jinan University and adhere to Helsinki Declaration guidelines on ethical principle for medical research involving human subjects. Both participants provided written informed consent.
After the AS family analysis, we selected 6 members (3 AS patient and 3 healthy people) from AS family to further research. Propositus (III 3), his mother (II 3) and his sister (III 3) acted as experimental group (AS). His sister (III 4), his brother (III 1) and his father 250 ml (II 4) acted as normal control (NC). Aseptic midstream urine was collected in the morning from each participant and was bottled into glass vials, which had been freeze-dried, c-irradiated, and filled with 5 ml penicillin-streptomycin antibiotics in temperature. Then, we separated out the renal tubular cells from urine. The renal tubular cells were reprogrammed to generate human iPSCs [12]. The iPSCs were our ultimate specimen that been used to further research in our study.
Total RNA isolation, cDNA library preparation
Total RNA was extracted from iPSCs using TRIzol reagent (Invitrogen, USA) according to the manufacturer’s protocol. We pool equivalent amount of total RNA from each sample into a single large combination to maximize the diversity of transcriptional unit’s according to same groups, respectively. DNase I (Ambion, USA) was used to remove genomic DNA from RNA samples. mRNA was purified from total RNA using oligo(dT) magnetic beads and fragmented in fragmentation buffer at 70ºC for 5 min. Cleared RNA fragments were copied into first-strand cDNA using reverse transcriptase and random primers. Second-strand cDNA synthesis used DNA polymerase I and RNase H. Synthesized cDNA was subjected to end-repair and phosphorylation, and 3’-adenylated with Klenow Exo-(3’- to-5’ exo minus, Illumina). Illumina paired-end adapters were ligated to the ends of the 3’-adenylated cDNA fragments. After agarose gel electrophoresis, cDNA libraries were constructed with 200 bp insection fragment. After validating on an Agilent 2100 bioanalyzer (Agilent Technologies, Santa Clara, CA, USA), mRNA-sequence libraries were sequencing on an Illumina HiSeq 2000 sequencing platform.
Sequence data analysis and alignment
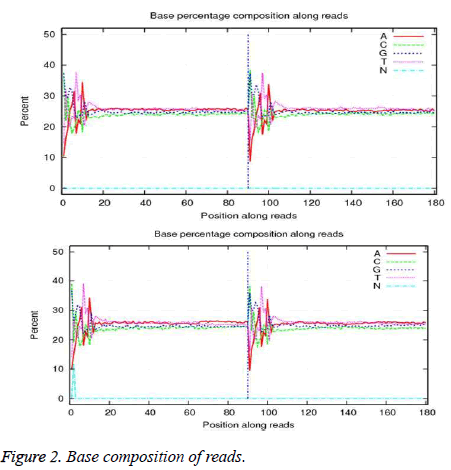
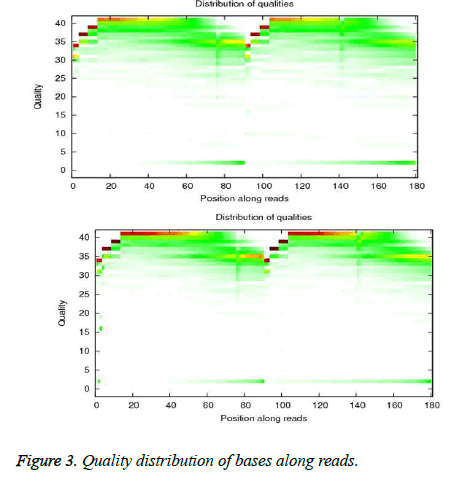
Primary sequencing data as raw reads were subjected to quality control (QC) to determine if the raw reads were suitable for mapping. QC examined base composition and base quality. Base composition is in Figure 2. The quality distribution of bases among reads is in Figure 3.
After QC procedures, raw reads were filtered by removing adapter sequences, reads in which unknown bases were greater than 10%, and reads in which more than 10% of bases had a quality score <20. The resulting clean reads were aligned to the references using SOAPaligner (http://soap.genomics.org.cn) as described by Li et al. [13]. Alignment data were used to calculate the distribution of reads on reference and for coverage analysis. Alignments that passed alignment quality control were used in downstream analyses including differential expression analysis, GO enrichment, and KEGG pathway assignment and prediction of alternative splicing and novel transcripts.
Differential gene expression
Relative transcript abundance was determined as read per kilobase of an exon model per million mapped reads (RPKM) [14], calculated as RPKM=109C/NL, where C is the number of reads that are uniquely aligned to a gene, N is the total number of reads uniquely aligned to all genes, and L is the number of bases in the gene. Differentially expressed genes between AS and NC cells were detected by IDEG6 software (http:// telethon.bio.unipd.it/bioinfo/IDEG6/) [15] using a general chisquare test based on RPKM values. Test results were corrected for false discovery rate (FDR) using FDR ≤ 0.001 and an absolute value of (log2Ratio) ≥ 1 as the threshold for significance for gene expression differences. log2Ratio was analysed as the RPKM values of the gene in one sample was at least 2 times that of the gene in another sample.
Bioinformatics analysis
The GO international gene function classification system was used to map all genes with significantly different expression in AS and NC cells to GO terms (http://www.geneontology.org/), calculating a gene number for every term. A hypergeometric test found significantly enriched GO terms. Bonferroni correction [16] was performed on calculated p-values with corrected p-value ≤ 0.05 as a threshold. GO terms with p ≤ 0.05 were defined as significantly enriched. KEGG was used to analyze for pathway enrichment of genes with significantly different expression in AS and NC cells to understand the biological functions of genes and identify significantly enriched metabolic pathways or signal transduction pathways compared with the whole genome background. Calculations were as for GO analysis with p ≤ 0.05 as the standard for significance.
Alternative splicing
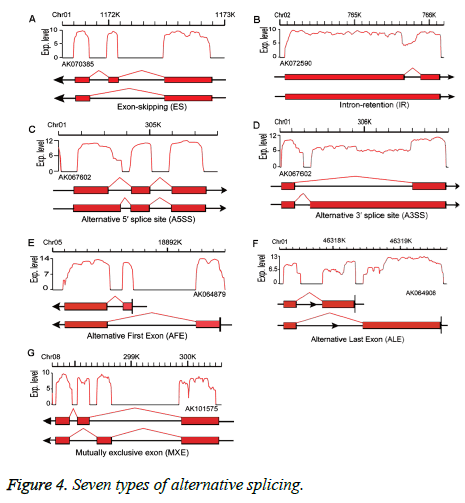
Alternative splicing generates different mRNA transcripts from a single gene that can be translated into different proteins [17]. We used SOAP splice (http://soap.genomics.org.cn/ soapsplice.html) software to identify splice junctions, predicting seven alternative splicing types: exon-skipping (ES), intron-retention, alternative 5’splice site, alternative 3’splice site, alternative first exon, alternative last exon, and mutually exclusive exon (MXE) (Figure 4) as described in Zhang et al. [18].
Novel transcript prediction and assessment of proteincoding potential
To discover novel transcribed regions, we compared assembled transcripts and annotated genomic transcripts to reference sequences. Predicted novel transcripts were required to meet three requirements: at least 200 bp from an annotated gene, more than 180 bp length, and sequencing depth no less than 2. After predicting novel transcripts, we investigated their functions. We distinguished protein-coding RNAs from noncoding RNA. We used the support-vector machine-based classifier Coding Potential (CPC) (http://cpc.cbi.pku.edu.cn/) to assess protein-coding potential. Negative scores indicated noncoding transcripts. Scores between 0 and 1 indicated weak potential for coding. Scores ≥ 1 indicated strong potential for coding.
Expression profiling by qRT-PCR
The differential expression of selection of 6 genes identified as being differentially expressed was validated by applying qRTPCR. GAPDH was selected as the internal control. In brief, 2 μg of total RNA from each sample was reverse transcribed for CDNA synthesis using a reverse transcription kit according to the manufacturer's protocol (Promega, Madison, WI). Amplification of CDNA was performed in the presence of genes specific primers and the SYBR Green PCR master mix (Applied Biosystems, Foster city, CA, USA) in MicroAmp Optical 96-well reaction plates with optical cover using an ABI prism 7500 Sequence Detector (Applied Biosystems). The sequences of the primer pairs designed using Primer Express Software V2.0 were listed in Table 1. The PCR amplification was carried out as follows: 95 for 2 min, followed by 40 cycles of amplification (94 for 10 seconds, 59 for 10 seconds, 72 for 45 seconds). The expression of each gene was confirmed in three rounds of independent qRT-PCR reaction. The relative expression level of each gene was normalized by against GAPDH. Fold change was calculated according to the 2-Ct method.
| Primer name | sequences 5' to 3' | TM |
|---|---|---|
| XIST-F | AAAGTGGCCGCCATTTTAGA | 57 |
| XIST-R | CAACAATCACGCAAAGCTCC | |
| CX3CL1F | CGTGCAGCAAGATGACATCA | 59 |
| CX3CL1R | TCCTTGACCCATTGCTCCTT | |
| LRRC55F | AATGGACACCCGAAACCTCA | 57 |
| LRRC55R | TGGCACATGGCTGAAATTGT | |
| FAM18B1 F | AATGGTTGGCCTACGTTGGT | 59 |
| FAM18B1 R | TGGACAGGCAATAAGTCCCA | |
| AURKC F | AGCGCACAGCCACGATAATA | 59 |
| AURKC R | TGCACAGACCAGCCAAAATC | |
| RPS4Y1 F | ATGGCAAGGTTCGAGTGGAT | 59 |
| RPS4Y1 R | GATGCGGTGAACAGCAAAAC | |
| GAPDH F | ACCACAGTCCATGCCATCAC | 59 |
| GAPDH R | TCCACCACCCTGTTGCTGTA |
Table 1. qRT-PCR primer used in the validation assays.
Results
Sequencing data
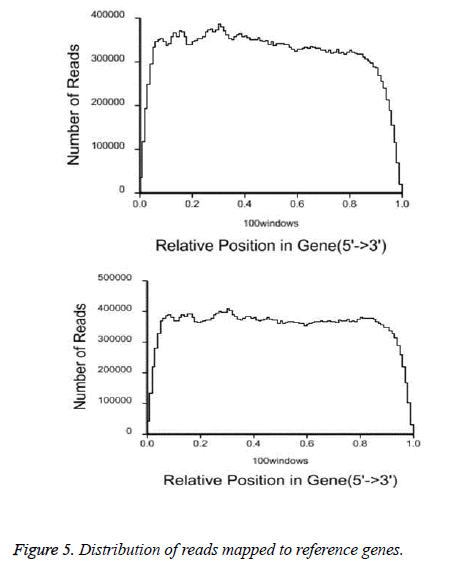
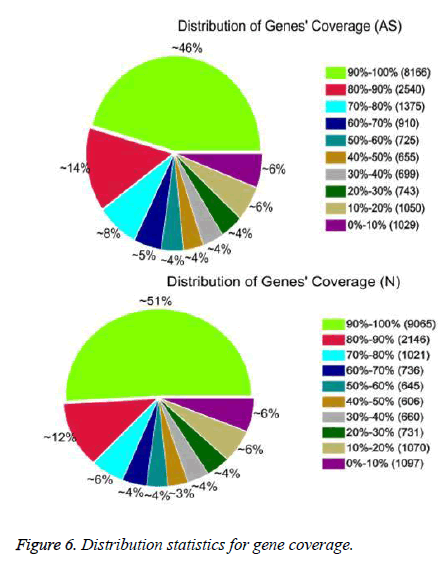
After QC analysis and filtering of raw reads, we obtained 26,021,874 clean reads from AS and 27,551,343 from NCs. We aligned clean reads onto the reference gene and reference genome. As shown in Table 2, 61.16% of AS reads mapped to the gene and 88.54% mapped to the genome, while 63.90% of NC reads mapped to the gene and 88.24% to the genome. For AS samples, 47.97% perfectly matched the reference gene and 61.12% perfectly matched the genome; For NC reads, 52.07% perfectly matched the gene and 62.84% the genome. RNA sequencing methods chemically fragmented mRNAs into short segments. If fragmenting was not random, read preference for specific gene regions might affect subsequent bioinformatics analysis. Therefore, we used the read distribution of genes to evaluate randomness and found that the reads were evenly distributed over genes from, 5’ to 3’ (Figure 5). We also determined the distribution of gene coverage in the AC and NC transcriptome. Gene coverage was defined as the percent of genes covered by the reads and the value was determined as the ratio of total bases of a gene covered by uniquely mapped reads to total bases of the gene. A high percentage of genes (46% in AS, 51% in NC) showed 90–100% coverage and most gene coverage was higher than 50% (70% in AS, 77% in NC) (Figure 6). The raw sequencing data were submitted to NCBI Sequence Read Archive (SRA, http://www.ncbi.nlm.nih.gov/ Traces/sra_sub/sub.cgi) under the accession number of SRP041474.
| Sample | AS | NC |
|---|---|---|
| Map to Gene | ||
| Total Reads | 52043748 (100.00%) | 55102686(100.00%) |
| Total BasePairs | 4683937320 (100.00%) | 4959241740(100.00%) |
| Total Mapped Reads | 31828347 (61.16%) | 35208207(63.90%) |
| Perfect match | 24963326 (47.97%) | 28689725(52.07%) |
| ≤5bp mismatch | 6865021 (13.19%) | 6518482(11.83%) |
| Unique match | 30472073 (58.55%) | 33651851(61.07%) |
| Multi-position match | 1356274 (2.61%) | 1556356(2.82%) |
| Total Unmapped Reads | 20215401 (38.84%) | 19894479(36.10%) |
| Map to Genome | ||
| Total Reads | 52043748 (100.00%) | 55102686(100.00%) |
| Total BasePairs | 4683937320 (100.00%) | 4959241740(100.00%) |
| Total Mapped Reads | 46077502 (88.54%) | 48621918(88.24%) |
| Perfect match | 31810738 (61.12%) | 34625794(62.84%) |
| ≤5bp mismatch | 14266764 (27.41%) | 13996124(25.40%) |
| Unique match | 41632944 (80.00%) | 43818058(79.52%) |
| Multi-position match | 4444558 (8.54%) | 4803860(8.72%) |
| Total Unmapped Reads | 5966246 (11.46%) | 6480768(11.76%) |
Table 2. Alignment for AS and NC.
Analysis of differentially expressed genes
We used deep RNA sequencing to determine genes differentially expressed between AS and NC. Using FDR ≤ 0.001 and the absolute value of log2ratio ≥ 1 as threshold values, 1168 genes were found to be differentially expressed, with 786 upregulated and 382 downregulated. In addition, 33 genes were expressed only in AS cells and 26 were expressed only in NC cells. Among upregulated genes, XIST was the most changed, with an expression level that increased about 11-fold (log2ratio) in AS cells compared with NCs. The most changed downregulated gene was RPS4YI, with an expression level that decreased about 17-fold (log2ratio). The top 20 upregulated and downregulated genes are in Table 3. To validate gene expression profiles, we conducted qRT-PCR to confirm the expression level of 6 selected gene (Table 4). We can see from Table 4, the genes exhibited high abundance and were differentially expression between AS and NC. The expression pattern of 6 genes was consistent with the reads abundance of deep sequencing, suggesting that the robustness of deep sequencing based expression analysis. For example, gene AURKC, RYS4Y1 and FAM18B1 were downregualted, gene XLST, LRRC55 and CX3CL1 were upregualted in microarray analysis. The qRT-PCR verification had the same expression and proved the genes were reasonable and probable.
| GeneID | Name | Gene length | N-RPKM | AS-RPKM | log2 Ratio(AS/N) | Mode | P-value |
|---|---|---|---|---|---|---|---|
| up-regulated | |||||||
| 7503 | XIST | 19271 | 0.003 | 7.22 | 11.19 | Up | 0.000110 |
| 9506 | PAGE4 | 493 | 0.001 | 1.60 | 10.64 | Up | 0.000000 |
| 100132288 | TEKT4P2 | 1640 | 0.001 | 1.40 | 10.45 | Up | 0.000031 |
| 3127 | HLA-DRB5 | 1171 | 0.001 | 1.12 | 10.13 | Up | 0.000000 |
| 727764 | MAFIP | 2293 | 0.001 | 1.09 | 10.09 | Up | 0.001174 |
| 440224 | CXADRP3 | 1613 | 0.001 | 1.06 | 10.05 | Up | 0.000234 |
| 343172 | OR2T8 | 939 | 0.001 | 1.05 | 10.03 | Up | 0.000500 |
| 164668 | APOBEC3H | 1164 | 0.001 | 0.65 | 9.34 | Up | 0.000044 |
| 154790 | CLEC2L | 1288 | 0.001 | 0.61 | 9.26 | Up | 0.000355 |
| 127064 | OR2T12 | 963 | 0.001 | 0.55 | 9.09 | Up | 0.000990 |
| 1116 | CHI3L1 | 1867 | 0.001 | 0.46 | 8.84 | Up | 0.001990 |
| 100130827 | SGK110 | 1270 | 0.001 | 0.39 | 8.60 | Up | 0.000320 |
| 79190 | IRX6 | 2337 | 0.001 | 0.35 | 8.46 | Up | 0.002000 |
| 5178 | PEG3 | 8765 | 0.001 | 0.34 | 8.43 | Up | 0.002622 |
| 440695 | ETV3L | 1977 | 0.001 | 0.33 | 8.37 | Up | 0.000000 |
| 78989 | COLEC11 | 1399 | 0.001 | 0.33 | 8.36 | Up | 0.001174 |
| 129804 | FBLN7 | 2329 | 0.001 | 0.28 | 8.14 | Up | 0.000006 |
| 54346 | UNC93A | 2132 | 0.001 | 0.26 | 8.03 | Up | 0.000622 |
| 146212 | KCTD19 | 2911 | 0.001 | 0.26 | 8.02 | Up | 0.000340 |
| 50964 | SOST | 2322 | 0.001 | 0.23 | 7.82 | Up | 0.001430 |
| down-regulated | |||||||
| 90665 | TBL1Y | 2407 | 0.605 | 0.00 | -9.24 | Down | 0.000010 |
| 64641 | EBF2 | 2297 | 0.673 | 0.00 | -9.39 | Down | 0.000001 |
| 400655 | LOC400655 | 2674 | 0.811 | 0.00 | -9.66 | Down | 0.000100 |
| 3211 | HOXB1 | 1014 | 0.821 | 0.00 | -9.68 | Down | 0.160143 |
| 7652 | ZNF99 | 3111 | 1.614 | 0.00 | -10.66 | Down | 0.000002 |
| 360205 | HOXB13-AS1 | 564 | 2.476 | 0.00 | -11.27 | Down | 0.000107 |
| 83869 | TTTY14 | 515 | 2.712 | 0.00 | -11.41 | Down | 0.000003 |
| 64595 | TTTY15 | 5262 | 2.999 | 0.00 | -11.55 | Down | 0.000000 |
| 3212 | HOXB2 | 1614 | 3.277 | 0.00 | -11.68 | Down | 0.015301 |
| 55410 | NCRNA00185 | 1508 | 3.311 | 0.00 | -11.69 | Down | 0.000000 |
| 246126 | CYorf15A | 872 | 4.123 | 0.00 | -12.01 | Down | 0.001004 |
| 9087 | TMSB4Y | 1702 | 4.295 | 0.00 | -12.07 | Down | 0.004300 |
| 8287 | USP9Y | 10048 | 5.223 | 0.00 | -12.35 | Down | 0.003184 |
| 8284 | KDM5D | 5595 | 6.814 | 0.00 | -12.73 | Down | 0.001083 |
| 6736 | SRY | 897 | 8.779 | 0.00 | -13.10 | Down | 0.003529 |
| 84663 | CYorf15B | 3315 | 10.192 | 0.00 | -13.32 | Down | 0.000067 |
| 84366 | PRAC | 403 | 11.134 | 0.00 | -13.44 | Down | 0.002000 |
| 8653 | DDX3Y | 4648 | 23.956 | 0.00 | -14.55 | Down | 0.000140 |
| 9086 | EIF1AY | 1399 | 36.364 | 0.00 | -15.15 | Down | 0.000003 |
| 6192 | RPS4Y1 | 910 | 222.870 | 0.00 | -17.77 | Down | 0.000000 |
Table 3. Top 20 differentially expressed genes between AS and NC.
| Gene | Cт | Cт Mean | Control Cт Mean | ⊿Ct | Normal control⊿Ct | ⊿⊿Ct | 2-⊿⊿Ct |
|---|---|---|---|---|---|---|---|
| AURKC AS | 24.982 | 24.851 | 17.813 | 7.038 | 7.038 | 0 | 1 |
| AS | 24.896 | 24.851 | 17.813 | 7.038 | 7.038 | 0 | 1 |
| AS | 24.675 | 24.851 | 17.813 | 7.038 | 7.038 | 0 | 1 |
| NC | 22.562 | 22.700 | 18.127 | 4.573 | 7.038 | -2.465 | 5.521 |
| NC | 22.545 | 22.700 | 18.127 | 4.573 | 7.038 | -2.465 | 5.521 |
| NC | 22.994 | 22.700 | 18.127 | 4.573 | 7.038 | -2.465 | 5.521 |
| RPS4Y1 | |||||||
| AS | 24.539 | 24.368 | 17.813 | 6.555 | 6.555 | 0 | 1 |
| AS | 24.438 | 24.368 | 17.813 | 6.555 | 6.555 | 0 | 1 |
| AS | 24.127 | 24.368 | 17.813 | 6.555 | 6.555 | 0 | 1 |
| NC | 21.994 | 22.093 | 18.127 | 3.966 | 6.555 | -2.588 | 6.015 |
| NC | 22.115 | 22.093 | 18.127 | 3.966 | 6.555 | -2.588 | 6.015 |
| NC | 22.171 | 22.093 | 18.127 | 3.966 | 6.555 | -2.588 | 6.015 |
| FAM18B1 | |||||||
| AS | 24.231 | 24.334 | 17.813 | 6.521 | 6.521 | 0 | 1 |
| AS | 24.307 | 24.334 | 17.813 | 6.521 | 6.521 | 0 | 1 |
| AS | 24.464 | 24.334 | 17.813 | 6.521 | 6.521 | 0 | 1 |
| NC | 23.665 | 23.761 | 18.127 | 5.634 | 6.521 | -0.887 | 1.849 |
| NC | 23.968 | 23.761 | 18.127 | 5.634 | 6.521 | -0.887 | 1.849 |
| NC | 23.651 | 23.761 | 18.127 | 5.634 | 6.521 | -0.887 | 1.849 |
| XLST | |||||||
| AS | 18.073 | 21.075 | 17.813 | 3.262 | 6.023 | -2.762 | 6.782 |
| AS | 18.158 | 21.075 | 17.813 | 3.262 | 6.023 | -2.762 | 6.782 |
| AS | 18.025 | 21.075 | 17.813 | 3.262 | 6.023 | -2.762 | 6.782 |
| NC | 24.030 | 24.150 | 18.127 | 6.023 | 6.023 | 0 | 1 |
| NC | 24.148 | 24.150 | 18.127 | 6.023 | 6.023 | 0 | 1 |
| NC | 24.273 | 24.150 | 18.127 | 6.023 | 6.023 | 0 | 1 |
| LRRC55 | |||||||
| AS | 16.770 | 16.583 | 17.813 | -1.230 | 4.065 | -5.295 | 39.260 |
| AS | 16.611 | 16.583 | 17.813 | -1.230 | 4.065 | -5.295 | 39.260 |
| AS | 16.368 | 16.583 | 17.813 | -1.230 | 4.065 | -5.295 | 39.260 |
| NC | 22.365 | 22.192 | 18.127 | 4.065 | 4.065 | 0 | 1 |
| NC | 22.006 | 22.192 | 18.127 | 4.065 | 4.065 | 0 | 1 |
| NC | 22.206 | 22.192 | 18.127 | 4.065 | 4.065 | 0 | 1 |
| CX3CL1 | |||||||
| AS | 17.421 | 17.525 | 17.813 | -0.288 | 5.266 | -5.554 | 46.978 |
| AS | 17.740 | 17.525 | 17.813 | -0.288 | 5.266 | -5.554 | 46.978 |
| AS | 17.414 | 17.525 | 17.813 | -0.288 | 5.266 | -5.554 | 46.978 |
| NC | 23.523 | 23.393 | 18.127 | 5.266 | 5.266 | 0 | 1 |
| NC | 23.473 | 23.393 | 18.127 | 5.266 | 5.266 | 0 | 1 |
| NC | 23.184 | 23.393 | 18.127 | 5.266 | 5.266 | 0 | 1 |
Table 4. qRT-PCR confirmation data.
GO and KEGG classification
GO analysis for cellular components, molecular function and biological processes was applied to determine significantly enriched functions for differentially expressed genes. In total, 41 GO terms were significantly enriched: 9 in cellular components, 2 in molecular function, and 30 in biological processes, using corrected p-value ≤ 0.05 as a threshold (Table 5). Among the enriched GO terms, terms intrinsic to membranes and membrane components were the most abundant in the cellular component category. The terms ion binding and cation binding were the most abundant in the molecular function category. The terms signalling, development process, multicellular organismal process, and anatomical structure development were the most abundant term in the biological process category. GO analysis networks are in Figure S1, Figure S2, Figure S3.
| Gene Ontology term | Genome frequency of use | Corrected P-value |
|---|---|---|
| cellular component | ||
| intrinsic to membrane | 5163 out of 16150 genes, 32.0% | 0.036250 |
| membrane | 7064 out of 16150 genes, 43.7% | 0.001843 |
| extracellular region part | 1092 out of 16150 genes, 6.8% | 0.005600 |
| extracellular region | 1113 out of 16150 genes, 6.9% | 0.002655 |
| extracellular matrix | 327 out of 16150 genes, 2.0% | 0.000584 |
| membrane part | 5889 out of 16150 genes, 36.5% | 0.000003 |
| integral to membrane | 1448 out of 16150 genes, 9.0% | 0.000003 |
| plasma membrane | 1313 out of 16150 genes, 8.1% | 0.011000 |
| cell periphery | 1328 out of 16150 genes, 8.2% | 0.011000 |
| molecular function | ||
| ion binding | 3916 out of 15658 genes, 25.0% | 0.020000 |
| cation binding | 3866 out of 15658 genes, 24.7% | 0.027000 |
| biological process | ||
| system development | 2497 out of 14935 genes, 16.7% | 0.014789 |
| cell communication | 778 out of 14935 genes, 5.2% | 0.032728 |
| anatomical structure development | 3031 out of 14935 genes, 20.3% | 0.000837 |
| multicellular organismal development | 2812 out of 14935 genes, 18.8% | 0.000002 |
| cell-cell signaling | 454 out of 14935 genes, 3.0% | 0.001069 |
| multicellular organismal process | 4818 out of 14935 genes, 32.3% | 0.003210 |
| nervous system development | 1029 out of 14935 genes, 6.9% | 0.000163 |
| central nervous system development | 487 out of 14935 genes, 3.3% | 0.000822 |
| developmental process | 3662 out of 14935 genes, 24.5% | 0.000047 |
| cell-cell adhesion | 267 out of 14935 genes, 1.8% | 0.010889 |
| regulation of system process | 364 out of 14935 genes, 2.4% | 0.010555 |
| organ development | 1615 out of 14935 genes, 10.8% | 0.000299 |
| signaling | 4026 out of 14935 genes, 27.0% | 0.001280 |
| behavior | 381 out of 14935 genes, 2.6% | 0.000000 |
| cell differentiation | 1403 out of 14935 genes, 9.4% | 0.043200 |
| tissue development | 825 out of 14935 genes, 5.5% | 0.000804 |
| brain development | 293 out of 14935 genes, 2.0% | 0.001000 |
| regulation of transmission of nerve impuls | 196 out of 14935 genes, 1.3% | 0.001000 |
| regulation of synaptic transmission | 176 out of 14935 genes, 1.2% | 0.001000 |
| regulation of neurological system process | 212 out of 14935 genes, 1.4% | 0.002000 |
| regulation of multicellular organismal process | 1000 out of 14935 genes, 6.7% | 0.003000 |
| cell adhesion | 467 out of 14935 genes, 3.1% | 0.010000 |
| biological adhesion | 467 out of 14935 genes, 3.1% | 0.010000 |
| cellular developmental process | 1841 out of 14935 genes, 12.3% | 0.012000 |
| anatomical structure morphogenesis | 1355 out of 14935 genes, 9.1% | 0.014000 |
| pattern specification process | 305 out of 14935 genes, 2.0% | 0.019000 |
| cell surface receptor linked signaling pathway | 1703 out of 14935 genes, 11.4% | 0.028000 |
| regionalization | 265 out of 14935 genes, 1.8% | 0.032000 |
| regulation of cell communication | 606 out of 14935 genes, 4.1% | 0.034000 |
| tissue morphogenesis | 304 out of 14935 genes, 2.0% | 0.041000 |
Table 5. GO classifications of genes significantly differentially expressed between AS and NC cells.
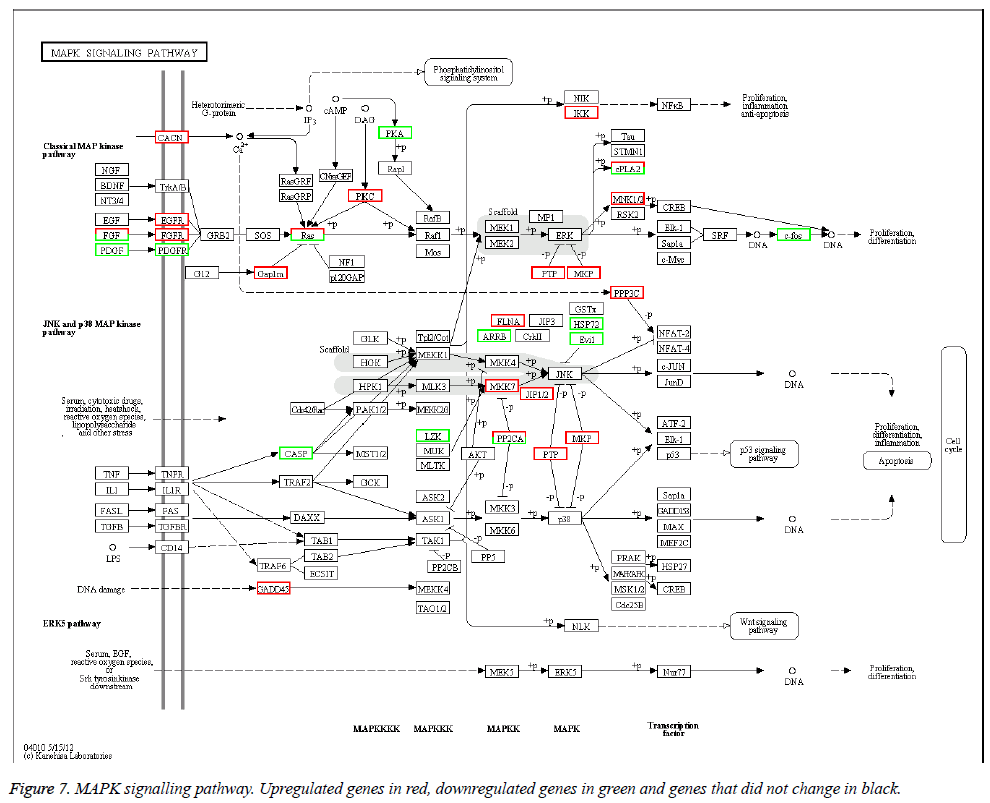
The KEGG database was used to categorize gene functions into biochemical pathways. The 1168 differentially expressed genes were assigned to 208 KEGG pathways. However, only 15 pathways contained significantly enriched terms by corrected p ≤ 0.05 (Table 6). The pathways with the highest representation of genes were MAPK signalling pathways (46 genes, 4.79%), neuroactive ligand-receptor interactions (39 genes, 4.06%), and cell adhesion molecules (38 genes, 3.95%). The MAPK signalling pathway is in Figure 7.
| Pathway | Gene with pathway annotation (961) | Corrected P-value |
|---|---|---|
| Cell adhesion molecules | 38 (3.95%) | 0.001100 |
| Neuroactive ligand-receptor interaction | 39 (4.06%) | 0.002500 |
| MAPK signaling pathway | 46 (4.79%) | 0.002600 |
| Allograft rejection | 12 (1.25%) | 0.002600 |
| Type I diabetes mellitus | 12 (1.25%) | 0.008000 |
| VEGF signaling pathway | 21 (2.19%) | 0.008000 |
| Autoimmune thyroid disease | 13 (1.35%) | 0.008000 |
| B cell receptor signaling pathway | 22 (2.29%) | 0.015200 |
| Graft-versus-host disease | 12 (1.25%) | 0.022400 |
| Axon guidance | 32 (3.33%) | 0.022700 |
| Gap junction | 19 (1.98%) | 0.023500 |
| Calcium signaling pathway | 29 (3.02%) | 0.028100 |
| Rheumatoid arthritis | 15 (1.56%) | 0.030900 |
| Wntsignaling pathway | 28 (2.91%) | 0.031300 |
| Glioma | 17 (1.77%) | 0.038200 |
Table 6. KEGG pathways with genes significantly differentially expressed between AS and NC cells.
Identification of alternative splicing
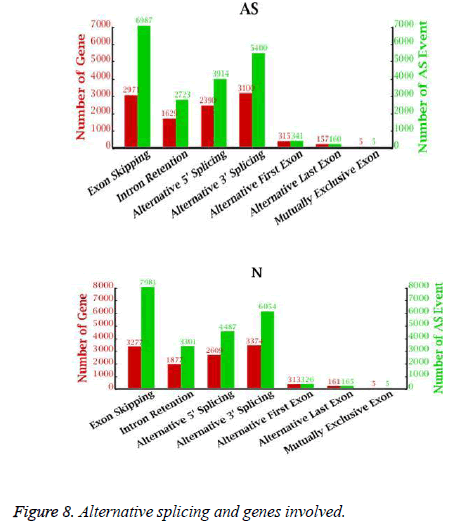
Alternative splicing generates different mRNA transcripts that are translated into distinct proteins. We determined the number of alternative splicing possibilities and the number of genes involved in alternative splicing (Figure 8). As many as 10,567 genes could be alternatively spliced in 19,530 ways in the AS libraries and 11,616 genes could be alternatively spliced in 22,319 ways in the NC libraries. ES was the major class of alternative splicing events, accounting for 35.8% (6987 in AS, 7981 in NC) of all alternative splicing in the AS and NC libraries. Only 5 examples of MXE were found in the AS and NC libraries.
Identification of novel transcript and annotation
Alignment of the sequencing data to the reference indicated 881 novel transcripts in the AS libraries and 963 in the NC libraries. About 80% of the novel transcripts (710 in AS, 794 in NC) were longer than 500 bp. Among the novel transcripts, 218 in AS and 243 in NC had the potential to encode proteins. We used CPC scores to assess protein-coding potential. The strongest potential for coding among the novel transcripts was seen for novel transcript 819 (chromosome 9, 226 bp) in the AS libraries with a score of 14, and novel transcript 586 (chromosome 22, 2771 bp) in the NC libraries with a score of 13. In the AS libraries, 115 novel transcripts had strong potential as coding transcripts (score ≥ 1), and 103 had weak potential as coding transcripts (score value 0-1). In the NC libraries, 126 transcripts had strong coding potential and 117 had weak coding potential. The top 20 novel transcripts with coding potential are in Table 7.
| Novel transcriptome ID | Chromosome | Length | Cpc score |
|---|---|---|---|
| AS | |||
| NovelTr_819 | chr9 | 2226 | 14.8984 |
| NovelTr_83 | chr10 | 2504 | 14.2614 |
| NovelTr_667 | chr6 | 1474 | 12.7469 |
| NovelTr_407 | chr19 | 3249 | 12.6963 |
| NovelTr_283 | chr16 | 1857 | 11.8018 |
| NovelTr_692 | chr6 | 2965 | 11.586 |
| NovelTr_47 | chr1 | 1259 | 11.3246 |
| NovelTr_221 | chr14 | 1009 | 10.9114 |
| NovelTr_410 | chr19 | 1424 | 10.5572 |
| NovelTr_409 | chr19 | 1057 | 10.5202 |
| NovelTr_517 | chr3 | 752 | 9.49248 |
| NovelTr_693 | chr6 | 1614 | 9.3311 |
| NovelTr_37 | chr1 | 1441 | 9.07706 |
| NovelTr_380 | chr19 | 2272 | 8.55492 |
| NovelTr_815 | chr9 | 731 | 8.0968 |
| NovelTr_783 | chr8 | 728 | 7.71177 |
| NovelTr_710 | chr7 | 4357 | 7.63221 |
| NovelTr_845 | chrX | 990 | 7.59434 |
| NovelTr_795 | chr9 | 1967 | 6.88168 |
| NovelTr_576 | chr4 | 970 | 6.79338 |
| NC | |||
| NovelTr_586 | chr22 | 2771 | 13.6726 |
| NovelTr_585 | chr22 | 2773 | 13.3342 |
| NovelTr_464 | chr19 | 3154 | 12.7105 |
| NovelTr_601 | chr3 | 840 | 10.4092 |
| NovelTr_873 | chr8 | 789 | 9.32909 |
| NovelTr_465 | chr19 | 661 | 9.1925 |
| NovelTr_34 | chr1 | 1002 | 8.95671 |
| NovelTr_620 | chr3 | 2624 | 8.83077 |
| NovelTr_872 | chr8 | 639 | 8.6662 |
| NovelTr_33 | chr1 | 1005 | 7.98502 |
| NovelTr_336 | chr16 | 695 | 7.46555 |
| NovelTr_582 | chr22 | 687 | 6.82787 |
| NovelTr_632 | chr3 | 2311 | 6.63984 |
| NovelTr_441 | chr19 | 4786 | 6.26961 |
| NovelTr_550 | chr20 | 1143 | 6.18412 |
| NovelTr_427 | chr19 | 1560 | 6.05214 |
| NovelTr_47 | chr1 | 1578 | 6.01541 |
| NovelTr_337 | chr16 | 597 | 5.85511 |
| NovelTr_269 | chr14 | 670 | 5.55965 |
| NovelTr_691 | chr4 | 2443 | 5.34056 |
Table 7. Predicted novel transcripts and their protein-coding potential.
Discussion
In previous study, we generated iPSCs from renal tubular cells in urine samples from AS and NC on AS family [12]. Unlike traditional experimental samples, iPSCs have potential for investigating human illnesses through disease modeling, tissue engineering, drug discovery, and cell therapy [19]. IPSCs can be used to analyze gene networks, microRNA, signalling pathways and transcription factors using high-throughput sequencing platforms [20]. Our study compared AS and NC iPSCs to find differentially expressed genes and their GO enrichments and KEGG pathway assignments. The results yielded an integrated and accurate database for investigation of AS pathogenesis and potential genetic therapy.
In our preliminary analysis of genes differentially expressed between AS and NC, 1168 genes showed differentia
