Research Article - Journal of Pharmaceutical Chemistry & Chemical Science (2017) Journal of Pharmaceutical Chemistry & Chemical Science 2017
Cyclobenzaprine drug assay and cyclobenzaprine-excipient interaction study by chromatography, thermal and spectral analysis.
Rajasekhar Tulasi Baru1*, Prasanth Bitla21Granada Pharma Ltd, Granada, Riyadh 3939, Saudi Arabia
2University of Hyderabad, Telangana, India
- *Corresponding Author:
- Dr. Rajasekhar Tulasi Baru
Granada Pharma Ltd, Granada, Riyadh 3939 Kingdom of Saudi Arabia
Tel: +967 1 465 803
Fax: +967 1 465 791
E-mail: barurajasekhar@gmail.com
Accepted date: September 26, 2017
Citation: Baru RT, Bitla P. Cyclobenzaprine drug assay and cyclobenzaprine-excipient interaction study by chromatography, thermal and spectral analysis. J Pharm Chem Chem Sci. 2017;1(1):1-9.
Abstract
The present study was carried out to investigate the compatibility of Cyclobenzaprine hydrochloride, a muscle relaxant and antidepressant with different pharmaceutical excipients. The study involved storing drug-excipient blends (200 mg) with 20% added moisture in closed glass vials at 100°c for 24 hours. A LC method was developed and validated for determination of cyclobenzaprine. The mobile phase consists of potassium dihydrogen phosphate buffer (20 mM, pH 3.0): methanol with flow rate 1.2 mL/min and UV detection at 289 nm. A good linearity was obtained with concentration ranging from 5-50 µg/mL. The HPLC study showed, drug interacts with some commonly used pharmaceutical excipients. The results were fairly good in agreement with the cyclobenzaprine hydrochloride-excipient interaction analysis, obtained from DSC, FTIR and UV-DRS. The HPLC method was validated as per ICH guidelines and applied for quality control of bulk and formulation of cyclobenzaprine hydrochloride.
Keywords
Cyclobenzaprine, Excipients, Degradation/Interaction Products, HPLC, DSC, UVDRS.
Introduction
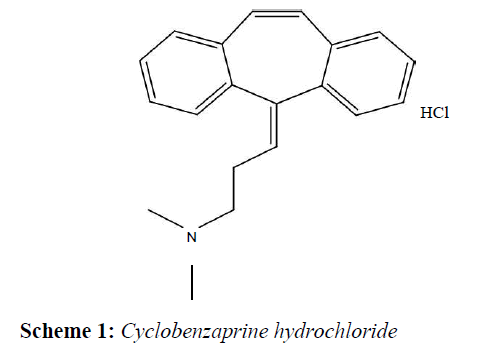
Cyclobenzaprine hydrochloride (CBZ) is widely used as muscle relaxant and antidepressant. Chemically, it is 3-(5H-dibenzo [a,d] cyclohepten-5-ylidene)- N,N-dimethyl-1-propanamine hydrochloride. In drug development process, Drug-Excipient interaction study plays an important role. The ultimate goal of adding excipients is delivery of drug in pure and safe form to the target. Drug-excipient compatibility testing at an early stage helps in the selection of excipients that increase the probability of developing a stable dosage form [1]. Ideally excipients should be chemically inert but they may alter absorption, distribution, metabolism, and excretion of drug. During preparation and storage of drug products, new impurities may be generated. The basic reason is that it may be come from interaction between drug and excipient (Scheme 1).
However these excipients can initiate, propagate and participate in chemical and physical interaction with active part of the formulation which result into interaction that affect the quality or shelf life of the drug product. This chemical interaction may lead to degradation of active ingredient of the formulation thus reduction in efficient therapeutic response. Physical interaction can affect rate of dissolution, uniformity of dose, solubility, disintegration, bioavailability of parent drug. Excipients may have functional group that interacts with Active Pharmaceutical Ingredient (API) which results into formation of degradation product.
The available literature shows that this study can be performed with the help of X- ray diffraction spectroscopy, DSC, HPLC, FT-IR spectroscopy [2-5]. Also, no attempt has been made to study the excipient compatibility of CBZ. Studies on stress degradation were found to be reported in the literature whereas no mention of excipient compatibility was elucidated [6].
The present study majorly focuses on the application of analytical techniques in reporting the incompatibilities that result due to drug- excipients in pharmaceutical formulations.
Experimental Procedure
Instruments and equipment
The various sophisticated analytical instruments were used for the study. An isocratic HPLC (Shimadzu Prominence, Japan) with single LC-20 AD pump, SPD - 20A UV visible detector, Phenomenex Luna C18 column (250 mm × 4.6 mm, 5 μm) and Rheodyne injector with a 20 μL loop was used for the injection of the sample and HPLC system equipped with LC solution (Database Version 1.24. SP1, Milford, USA) were used for whole study. Differential Scanning Calorimeter (Universal V4.5A, TA Instruments) was used for thermal study. FTIR spectrophotometer (Spectrum RXI, Perkin Elmer, USA), UVDRS (V-650, Jasco Corporation, Japan). All pH measurements were done using pH-meter (pH Tutor, Eutech Industries, Malaysia) and weighing was done using Sartorius balance (CPA225D, Germany). Digital Sonicator (Power sonic 405, Hwashin Technogy Corporation, Korea) used for sonication purpose. Digital hot air oven (Bio techniques, Mumbai, India) was used for solid state stress study.
Reagents and chemicals
Cyclobenzaprine hydrochloride was received as gift sample from Glenmark pharma limited. Pharmaceutical excipients like dibasic calcium phosphate (DCP), lactose anhydrous, corn starch, magnesium stearate (Mg stearate), silicon dioxide (SiO2), titanium dioxide (TiO2), talc, sodium carboxymethyl cellulose (NaCMC), hydroxylpropyl methylcellulose (HPMC) were obtained as gift sample from Glenmark pharma limited Hyderabad. HPLC grade methanol (SD Fine chemicals), HPLC grade water (Millipore, USA), potassium dihydrogen phosphatebuffer and ortho-phosphoric acid were obtained from SD Fine chemicals, Test samples, cyclobenzaprine hydrochloride 5 mg per tablet, purchased from local market (Flexabenz, Macleods pharmaceutical Ltd.) was used for the study.
Methods
Chromatographic condition
Phenomenex C18 (250 × 4.6 mm, 5 μm) column was used for the HPLC study. The mobile phase containing methanol: potassium dihydrogen phosphate buffer (20 mM, pH 3.0) in proportion of 65:35 (v/v) was found an precise and cheaper LC method for present study. Orthophosphoric acid was used for pH adjustment for an aqueous medium. The mobile phase was filtered through 0.45 μm Whatman Cellulose Acetate membrane filter paper and then ultrasonicated for 30 min. The flow rate was set to 1.2 mL/min. 289 nm was selected as wavelength maxima. Column temperature was kept at ambient condition throughout the analysis. Injection volume was 20 μL.
Validation of LC method and assay of drug tablet formulation
The method was validated for linearity, range, precision (interday, intra-day and intermediate precision), accuracy, LOD and LOQ, robustness, system suitability. Standard plot was constructed for cyclobenzaprine hydrochloride (R2=0.9998) in the range of 5-25 μg/mL. The experiment was repeated thrice on the same day and additionally on consecutive day to determine intra- and inter-day precision, respectively (%RSD was found <2.0%). The intermediate precision of the method was determined by repeating the experiment on two different laboratories, instruments, analysts. Accuracy was determined by spiking the mixture of synthetic mixture solutions with three known concentrations of the drugs. Further, specificity of the method was assessed by studying resolution factor of the drug peaks from nearest resolving peaks. Assay of drug tablet was carried out using cyclobenzaprine hydrochloride 5 mg per tablet (Flexabenz).
Degradation studies
Drug-excipient interaction study involved preparation of blends of drugs substances with different pharmaceutical excipients, which were mixed with 20% added water and stored in closed glass vials at 100°C for 24 hours. Samples were analyzed for chemical and physical (color, appearance, etc) stability after 24 hour of storage.
These specific study parameters were set on the basis of trials and errors. For test samples, accurately weighed amount of drug-substances were placed in 5 mL glass vials. Each vial was labeled with the amount of drugs to determine mass balance during chemical analysis and weighed amounts of excipients were then added to the vials. The total weight of drug-excipient blend in a vial was usually kept at about 200 mg. The amount of drug substance and excipients in a blend was taken in 1:1 ratio, the powder in each vial was mixed with a glass capillary (both the ends of which were heat sealed). Then 20% water (40 μL per 200 mg powder blend) was added using micro syringe. The blend was further mixed with same glass capillary and to prevent any loss of material, capillary was broken and left inside the vials. Each vial was sealed tightly with a teflon-lined screw cap and stored at 100°C for 24 hours. The same way, control samples were prepared and kept at ambient temperature, same procedure as per test sample was followed without addition of drug substance for Blank samples.
HPLC studies
The samples were observed visually for any physical changes and also analyzed by a newly developed and validated HPLC method to determine chemical changes. 3 mL of mobile phase was added into each vial. The mixture was vortexed and transferred to 100 mL volumetric flask. Each vial was rinsed with solvent (mobile phase) thrice and volume was made up to mark. The resulting samples were centrifuged and supernatant was filtered through 0.45μm cellulose acetate membrane filters. After final dilution, samples were analysed using HPLC and drug content determined using calibration curve preparation within range.
DSC studies
A differential scanning calorimeter was used for thermal analysis of drug and mixtures of drug and excipients. HPLC showed positive results for excipients like Mg stearate, NaCMC so only they were analysed by DSC for conformation study. Samples were weighed directly in the pierced DSC aluminium pan and scanned in the temperature range of 25-250°C with 100°C/min heating rate under 25 mL/min nitrogen flow rate. Thermograms obtained under given condition were observed for interaction.
FTIR spectroscopy studies
FTIR spectra of drug and drug-excipient blends were recorded on an FTIR spectrophotometer in the range of 4000-400 cm-1 using potassium bromide discs.
UV-DRS studies
UV-DRS spectra drug and drug-excipient blends were obtained on an UV spectrophotometer in the range of 210-870 nm.
Results and Discussion
Drug-excipient compatibility study
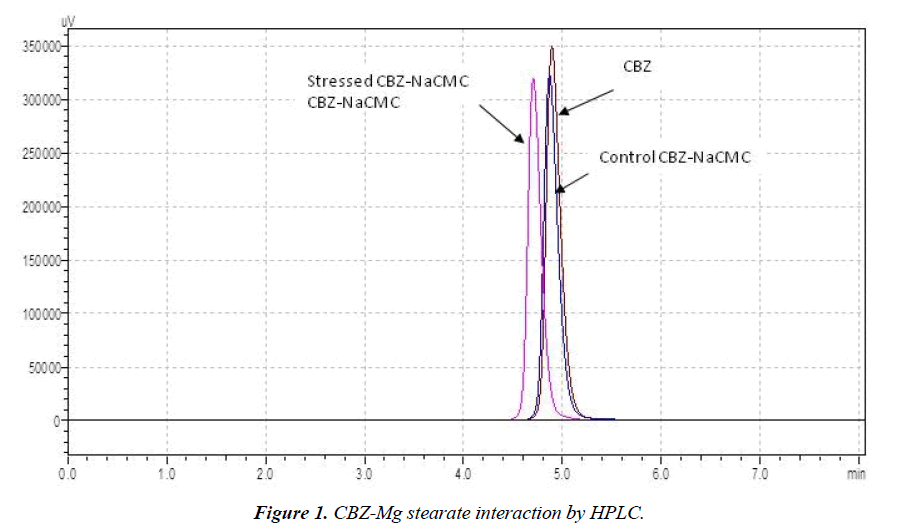
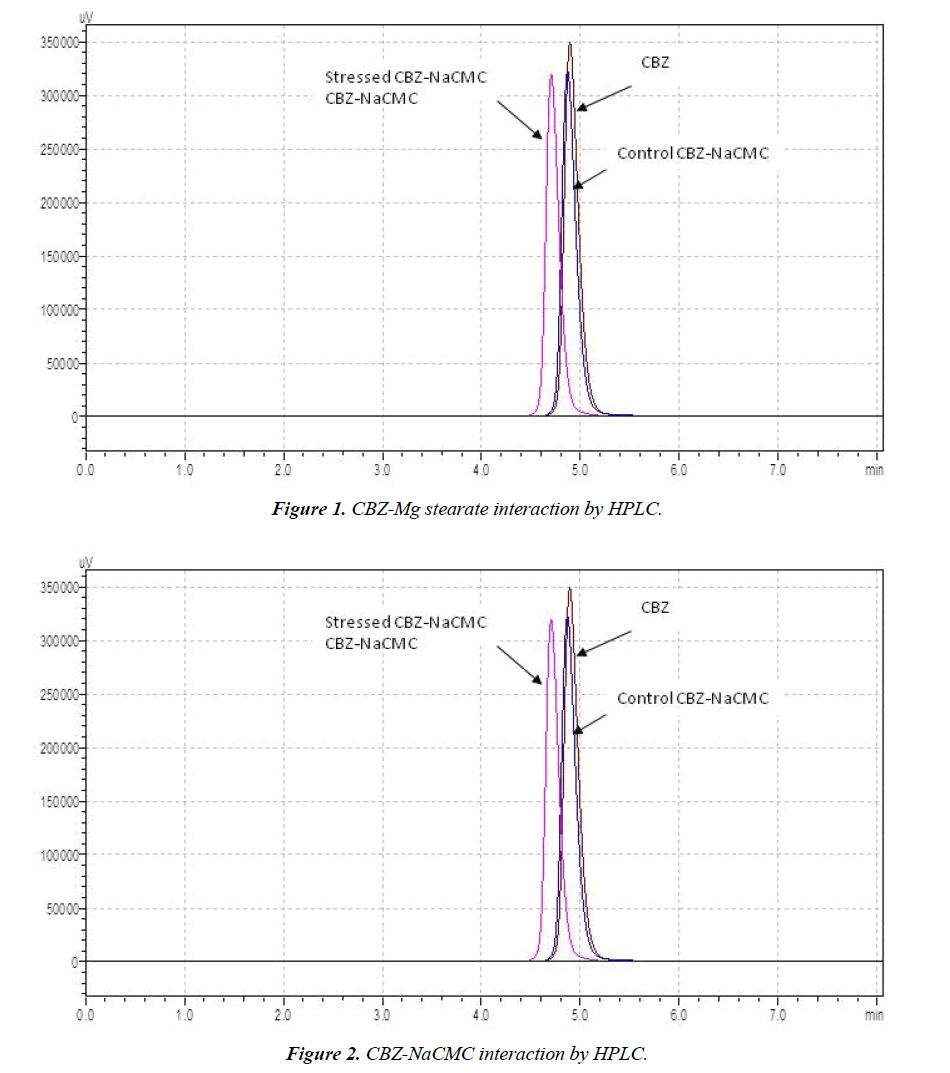
HPLC was used for quantitative study among all techniques, remaining were used for qualitative study. Figure 1 shows that stressed sample retention time and area have been changed as compare to control sample. It means drug has interacted with Mg stearate. The same way, (Figure 2) is showing changed retention time and drug peak area for stressed sample. So in the case of NaCMC also drug has degraded. % Recovery of cyclobenzaprine hydrochloride with excipients after stress condition is listed in Table 1. The Table 1 clearly indicates that cyclobenzaprine hydrochloride is not compatible with Mg stearate and NaCMC (%Recovery beyond 100±5.0) and remaining excipients showed a least interaction with CBZ. For further confirmation of interaction, study was supported by DSC, FT-IR and UV-DRS.
| Sample (Stressed) | CBZ | Mg Stearate + CBZ | NaCMC + CBZ | CBZ + Talc | CBZ + TiO | CBZ + Lactose | CBZ + SiO | CBZ + Starch | CBZ + DCP | CBZ + HPMC |
|---|---|---|---|---|---|---|---|---|---|---|
| % Recovery | 100 | 78.77 | 85.08 | 96.73 | 97.28 | 101.16 | 99.37 | 98.96 | 99.51 | 97.66 |
Table 1: % Recovery of cyclobenzaprine hydrochloride with excipients.
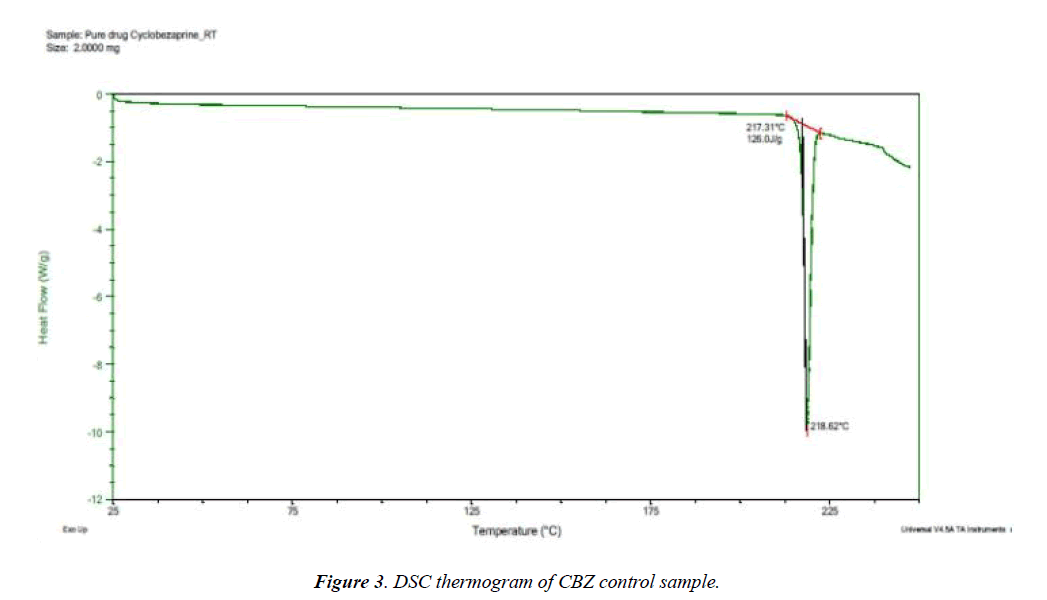
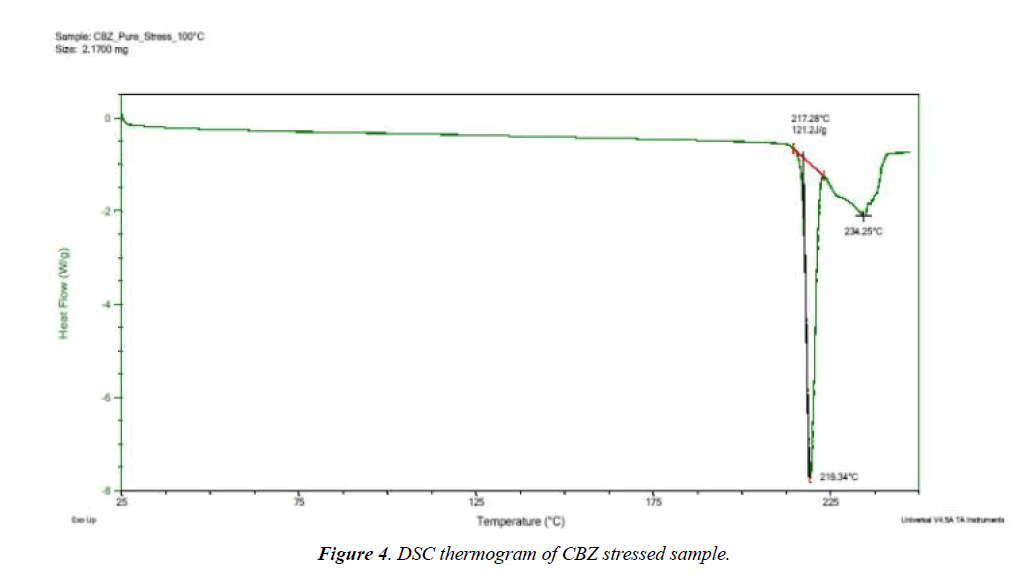
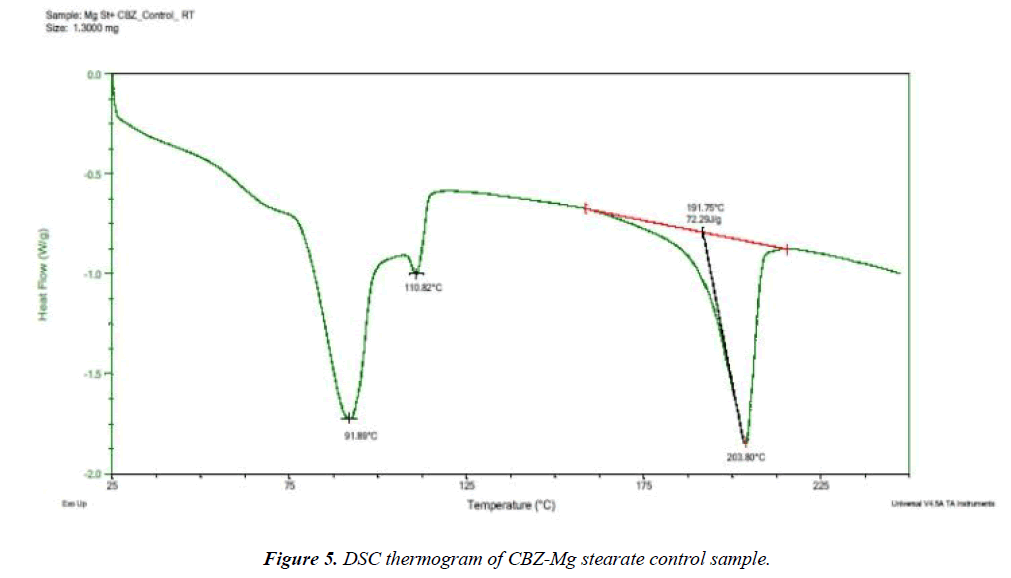
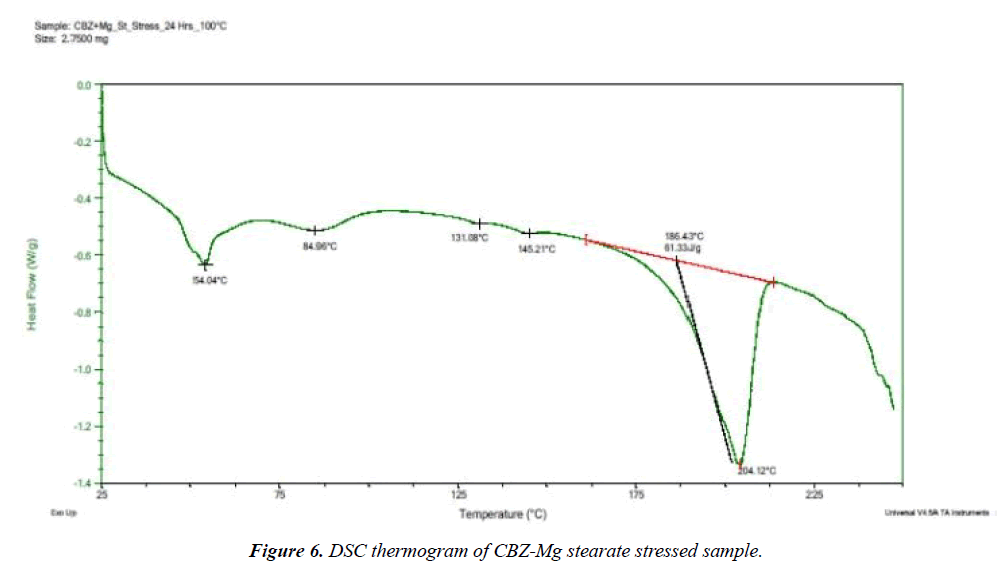
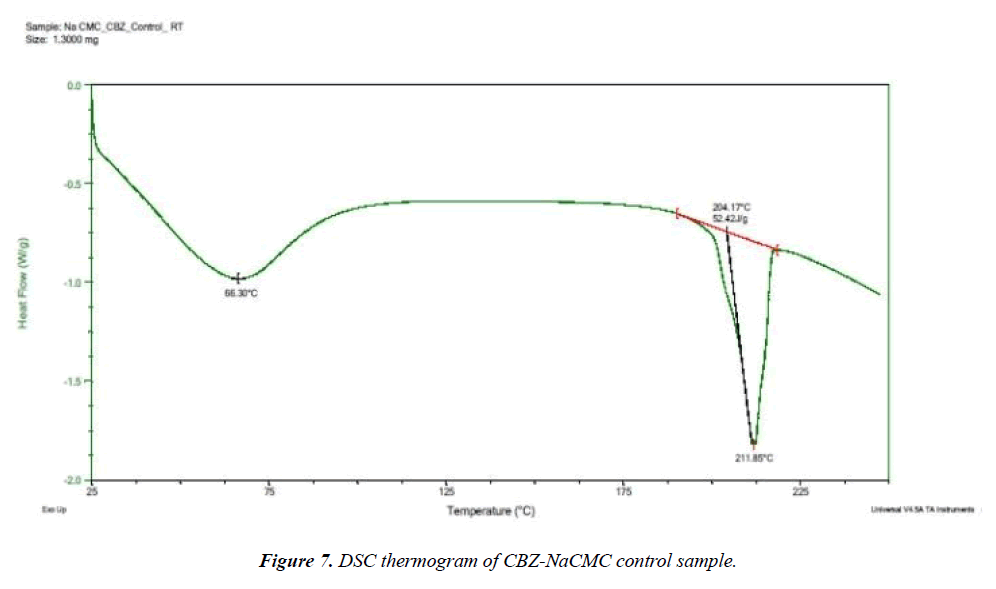
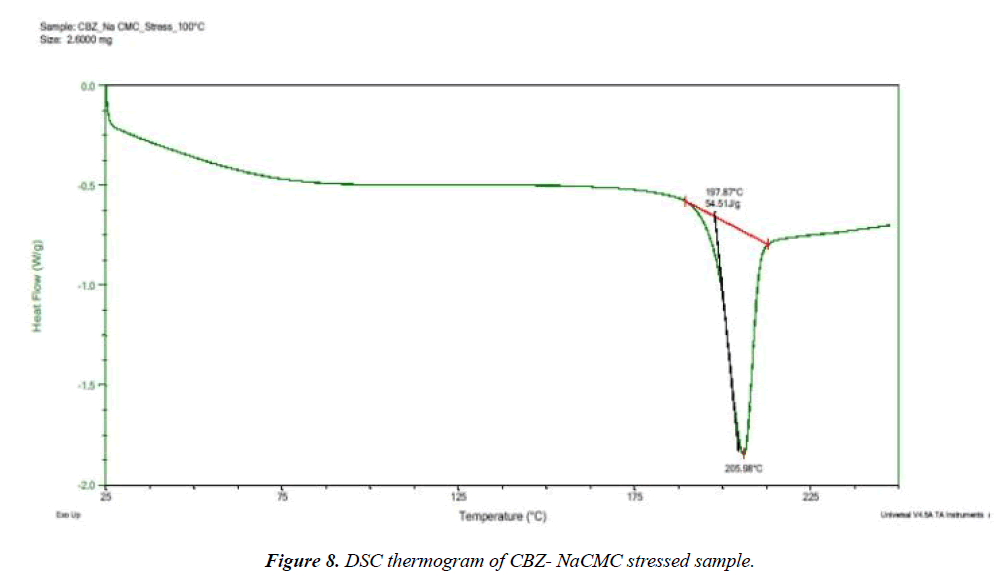
Selected drug-excipient mixtures were scanned by DSC for further confirmation as shown in (Figures 3-8). The thermal behaviour of control and stressed samples of pure drug and mixtures were checked and compared. Peak transition temperature (T-peak) and heat of fusion or enthalpy ΔHf of cyclobenzaprine hydrochloride alone and in Mg stearate and NaCMC are summarized in Table 1. The DSC trace of cyclobenzaprine hydrochloride showed a sharp endothermic peak at 218.62°C. In majority of the cases, melting endotherm of drug was well preserved with slight changes in terms of broadening of shifting towards the lower temperature [1]. It has been reported that the quantity of material used, especially in drug-excipient mixture, affects the peak shape and enthalpy [7,8]. Thus, these minor changes in the melting endotherm of drug could be due to the mixing of drug and excipient, which lowers the purity of each component in the mixture and may not necessarily indicate potential incompatibility [9-11]. The DSC thermogram (Figure 3) of control sample of drug showed a sharp endotherm at 218.62°C (starting from 217.31°C) that shows the purity of drug. There is a very minute change in DSC thermogram of stressed sample of drug that shows its thermal stability (Figure 4) The DSC thermogram of stressed CBZ-Mg stearate (Figure 6) could be compared with pure drug (Figure 4) and mixture control sample (Figure 5) for checking of interaction. The mixture stressed sample showed broadening of endotherm and shifting of peak transition temperature (from 219.34°C to 204.12°C) of drug endotherm. In addition to that, the heat of fusion was also decreased (from 121.2 J/g to 61.33 J/g) and Mg stearate endotherm shape was changed due to interaction. The same type of changes observed with the stressed CBZ-NaCMC (Figure 8) that showed broadening of endotherm and shifting of peak transition temperature (from 219.34°C to 205.98°C) of drug endotherm. The heat of fusion was also very much decreased (from 121.2 J/g to 54.51 J/g) which indicated an interaction. The individual endotherm parameters are summarised in Table 2.
| Sample | Peak starting T (°C) | Tpeak (°C) | ∆Hf (J/g) |
|---|---|---|---|
| CBZ Control | 217.31 | 218.62 | 126 |
| CBZ Stressed | 217.28 | 218.34 | 121.2 |
| CBZ + Mg stearate control | 191.75 | 203.8 | 72.3 |
| CBZ + Mg stearate stressed | 186.43 | 204.12 | 61.3 |
| CBZ + Na CMC control | 197.87 | 211.85 | 54.5 |
| CBZ + Na CMC stressed | 197.87 | 205.98 | 54.5 |
Table 2: The individual endotherm parameters achieved after the successful DSC scanning.
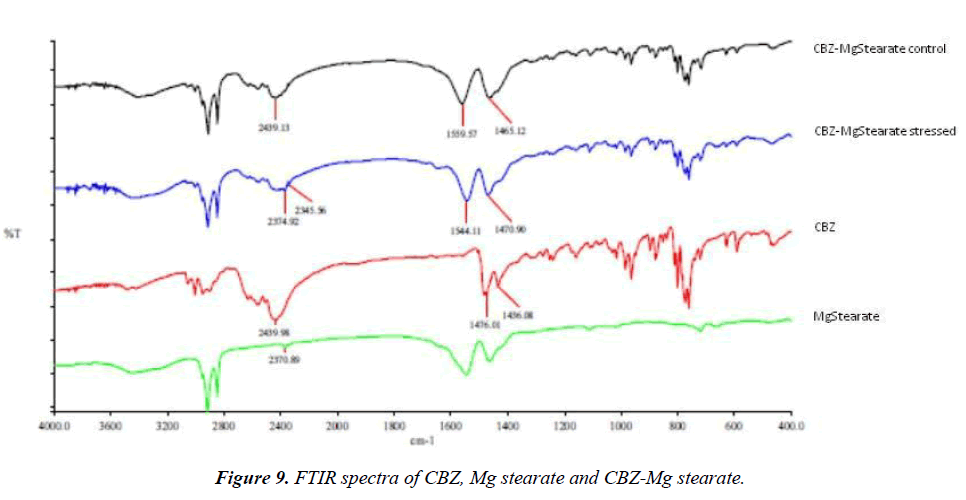
In the present study, FTIR was used for comparison of its potency towards interaction study (Figures 9 and 10). IR spectra of stressed pure drug, excipient and stressed drugexcipient mixture were recorded from 4000-400 cm-1. The IR spectra of stressed CBZ is shown in (Figure 9) and following main characteristic bands were observed 2440 (-C=C-str), 1476 (-CH3, bend) and 1436 cm-1 (-CH2, bend). Stressed CBZMg stearate (Figure 9) shown nearly same absorbance bands as obtained in pure drug IR spectra, the only difference was shifting and broadening of band at 1560 cm-1 (1460 cm-1 in pure drug). The same case was observed for control CBZ-Mg stearate (Figure 9) that shows interaction was also took place at ambient temperature.
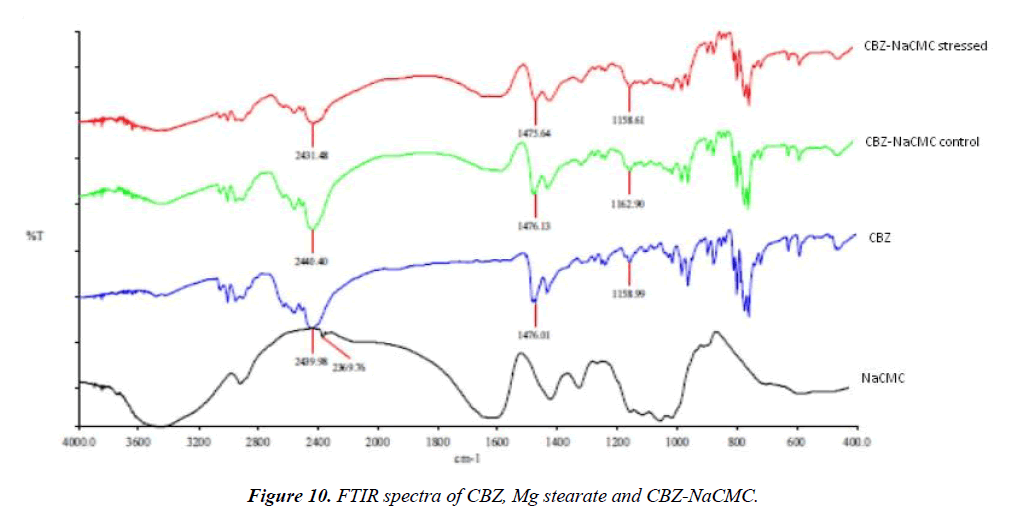
The scan of IR spectra of stressed CBZ-NaCMC was observed for following absorbance bands as shown in (Figure 10). 2431 cm-1 (-C=C- str) and 1475 cm-1 (-CH3, bend). The interaction between CBZ-NaCMC could be proved by overlaying mixture samples. The absorbance band at 2431 cm-1 in stressed mixture sample was observed broad as compare to control mixture sample (Figure 10). Remaining excipients were not showing any marked difference between pure drug and/or mixture samples under stressed condition.
UV-DRS is not widely used analytical technique for drugexcipient interaction study but it was used to solely compare its proficiency with currently available techniques in this area. The scan was achieved from 870 to 210 nm for UV-DRS spectra. Control and stressed samples of all the excipient-drug mixture were successfully scanned but no one has shown significant interaction with CBZ except NaCMC (Figure 11).
Validation and assay result
Validation of HPLC method was performed covering most of the validation parameters, as per the ICH guideline (R1). Linearity (R2) and % RSD were obtained 0.9998 and less than 1.00% (Table 3) respectively. Robustness and system suitability parameters were performed showing % RSD less than 2.00 that means the present LC method is robust (Tables 4 and 5). The assay was performed for marketed formulation (tablet) for three different concentrations. % Recovery was found within the range (Table 6).
| Parameters | Obtained values | ||
|---|---|---|---|
| Linearity | 5 –25 μg/ml | ||
| Regression Equation | y=39075 x – 3764.6 | ||
| Correlation Coefficient (R2) | 0.9998 | ||
| LOQ (µg/ml) | 1.227 | ||
| LOD (µg/ml) | 0.405 | ||
| Accuracy (µg/ml) (N = 3) | 45 | 50 | 55 |
| % Recovery | 99.98 | 99.66 | 100.266 |
| Precission (20 µg/ml) | -- | ||
| Intraday, Mean (N =6) | |||
| % RSD | 0.485 | ||
| % Recovery | 99.19 | ||
| Inter-day Mean(N =3) | |||
| % RSD | 0.713 | ||
| % Recovery | 99.25 | ||
Table 3: Validation parameters data.
| Parameters | Tailing Factor | Theoretical Plate | ||||||
|---|---|---|---|---|---|---|---|---|
| Ave. | std | % RSD | Ave. | Std | % RSD | |||
| Flow Rate | 1 | 1.286 | 0.005 | 0.383 | 7178 | 84 | 1.17 | |
| 1.4 | 1.271 | 0.001 | 0.454 | 5448 | 12 | 0.22 | ||
| Buffer Strength | 15 mM | 1.378 | 0.003 | 0.217 | 6687 | 32 | 0.48 | |
| 25 mM | 1.27 | 0.005 | 0.368 | 6679 | 9 | 0.13 | ||
| pH | 2.8 | 1.275 | 0.005 | 0.43 | 6445 | 34 | 0.53 | |
| 3.2 | 1.291 | 0.003 | 0.272 | 6371 | 25 | 0.4 | ||
| Organic phase | 62% | 1.259 | 0.02 | 1.66 | 4577 | 52 | 1.15 | |
| Content | 68% | 1.284 | 0.01 | 0.81 | 8535 | 43 | 0.5 | |
Table 4: Robustness data.
| Parameters |
Retention Time (min) |
Tailing Factor | Theoretical plate | |
|---|---|---|---|---|
| Average | 4.8413 | 1.2765 | 6462 | |
| std | 0.0106 | 0.0053 | 17 | |
| % RSD | 0.2189 | 0.4167 | 0.2632 | |
Table 5: System suitability data.
| Concentration (µg/mL) |
10 | 20 | 30 |
| % Recovery (N=3) | 100.6 | 98.04 | 99.32 |
Table 6: Assay result data.
Conclusion
The results confirmed that cyclobenzaprine hydrochloride is not compatible with Mg stearate and NaCMC out of all selected pharmaceutical excipients. The study was also aimed to compare HPLC study results with DSC, FTIR and UV-DRS results for drug-excipient interaction study. In the present study, results of HPLC with other techniques were successfully employed to assess the compatibility of cyclobenzaprine hydrochloride with the excipients used in the tablet formulation. No concrete evidence of interaction was observed between cyclobenzaprine hydrochloride and majority of the excipients used in the tablet formulation of the same drug. The comparison indicated that only HPLC results cannot be relied alone. Whenever possible, other techniques such as DSC, FTIR and UV-DRS and quantitative analysis after storage under stressed conditions should be taken in conjunction with HPLC results to reach any definite conclusion.
Conflict of Interest
The authors declare that they have no competing interest.
References
- Verma RK, Garg S. Selection of excipients for extended release formulations of glipizide through drug–excipient compatibility testing. J Pharm Biomed Anal. 2005; 38(4): 633-44.
- McDaid FM, Barker SA, Fitzpatrick S, et al. Further investigations into the use of high sensitivity differential scanning calorimetry as a means of predicting drug–excipient interactions. Int J Pharm. 2003; 252(1): 235-40.
- Thomas VH, Naath M. Design and utilization of the drug–excipient chemical compatibility automated system. Int J Pharm. 2008; 359(1): 150-7.
- Bozdağ-Pehlivan S, Subaşi B, Vural I, et al. Evaluation of drug-excipient interaction in the formulation of celecoxib tablets. Acta Pol Pharm. 2011; 68(3): 423-33.
- Stulzer HK, Rodrigues PO, Cardoso TM, et al. Compatibility studies between captopril and pharmaceutical excipients used in tablets formulations. J Therm Anal Calorim. 2008; 91(1):323-8.
- Sadanshio PP, Wankhede SB, Chaudhari PD. A validated stability indicating HPTLC method for estimation of ribavirin in capsule in presence of its alkaline hydrolysis degradation product. Anal. Chem. 2014; 4(5-6):343-58.
- Kandarapu R, Grover V, Chawla HP, et al. Evaluation of the compatibility of ketorolac tromethamine with selected polymers and common tablet excipients by thermal and isothermal stress testing. Stp Pharma Sci. 2001;11(6):449-57.
- Mura P, Manderioli A, Bramanti G, et al. Utilization of differential scanning calorimetry as a screening technique to determine the compatibility of ketoprofen with excipients. Int J Pharm. 1995; 119 (1):71-9.
- Botha SA, Lötter AP. Compatibility study between naproxen and tablet excipients using differential scanning calorimetry. Drug Dev Ind Pharm. 1990; 16(4):673-83.
- Smith A. Use of thermal analysis in predicting drug-excipient interactions. Anal Proc.1982; 19:559-61.
- Dürig T, Fassihi AR. Identification of stabilizing and destabilizing effects of excipient-drug interactions in solid dosage form design. Int J Pharm. 1993; 97(1-3):161-70.
