Research Article - Biomedical Research (2021) Volume 32, Issue 1
Comparison of analytical performance of the HbA1c assay on the fine care fluorescence immunochromatographic system.
Bandar Ali Suliman*
Department of Medical Laboratory Technology, College of Applied Medical Sciences, Taibah University, Madinah, Saudi Arabia
- Corresponding Author:
- Bandar Ali Suliman
Department of Medical Laboratory Technology
College of Applied Medical Sciences
Taibah University
Madinah
Saudi Arabia
Accepted on December 01, 2020
Abstract
Background: The Fluorescence Immunochromatographic method is a relatively new technique offering similar advantages to small clinical laboratories with the added value of reagents stability and increased precision. Here we aim to evaluate the Fluorescence Immunochromatographic method in terms of accuracy, precision, and linearity. Also, to compare its performance against the Bronate Affinity method. Methods: Reproducibility between the two methods was assessed by measuring ten prepared HbA1c reference materials with different concentrations. Additionally, the Bland-Altman Plot was also used to determine the comparability of measurements between the two methods within a 1.96 SD limit. Moreover, twenty repeated measurements of two HbA1c reference materials with different concentrations were carried out to assess accuracy and precision. Results: The “best fit values” after comparing ten measurements of the HbA1c reference materials between the two methods for the Slope of the linear regression model was 0.9764 ± 0.05566 with “Y” intercept of 0.5469 ± 0.4657, “X” intercept of -0.5601, and R2 of 0.9747. All ten results were inside the 1.96 limit of the Bland-Altman Plot. Similarly, comparison of two sets of HbA1c references materials, “Control N” and “Control P”, after twenty repeated analysis showed a Coefficient of Variation (CV) of 2.64% and 3.55% respectively. Conclusion: There is no significant difference between the two methods in detecting HbA1c. Method evaluation employing both a liner regression model of analysis as well as the Bland-Altman method showed no significant variance. This shows that the Fluorescent Immunochromatography instrument is suitable for detecting HbA1c in the clinically significant detection range.
Keywords
Glycated hemoglobin, HbA1c, Fluorescent immunochromatography, Bronate affinity, Fine care.
Introduction
Clinical laboratories use different instrument to analyse biological samples to satisfy their established scope of service. The choice of instrument is greatly influenced by the laboratory’s financial capacity and annual testing volume. There are many types of automated immunoassay testing systems available in the medical market today. Many manufacturers employ chemiluminescence detection techniques, which basically detect the emission or flight from specific chemical reactions after the addition of luminol or one of its derivatives as a substrate. These techniques require the addition of chemicals and substrate materials to the actual medium where the analyte is located, which is usually a disposable liquid phase, increasing the production and the usage costs. This explains why these manufacturers usually target medium to high throughput medical laboratories for their instruments. Chemiluminescence or Electro-Chemiluminescence is sometimes considered the industry standard in immunoassay methodology. This method, which is based on chemiluminescence microparticle, are used in the ADVIA Centaur® [1,2], Roche Cobas® [3,4], Abbott Architect® [5,6], and many other high-end automated immunoassay analyzers.
Smaller laboratories thrive to reach established quality control standards on their testing systems. The usual challenge is that they cannot afford to acquire higherend analyzers with a large community of users and a variety of quality control reference materials. They usually move towards obtaining smaller form-factor instruments that can satisfy the minimum requirements in terms of accuracy, precision, and detection limit. The Bronate Affinity method is widely used in clinical laboratory settings for the quantitative measurement of Glycated Hemoglobin (HbA1c) in patients’ blood. Many medical manufacturers choose this technology because of its ease of use and acceptable detection limits in the clinically significant range of HbA1c. The Fluorescence Immunochromatographic method is a relatively new technique offering similar advantages to small clinical laboratories with the added value of reagents stability and increased precision.
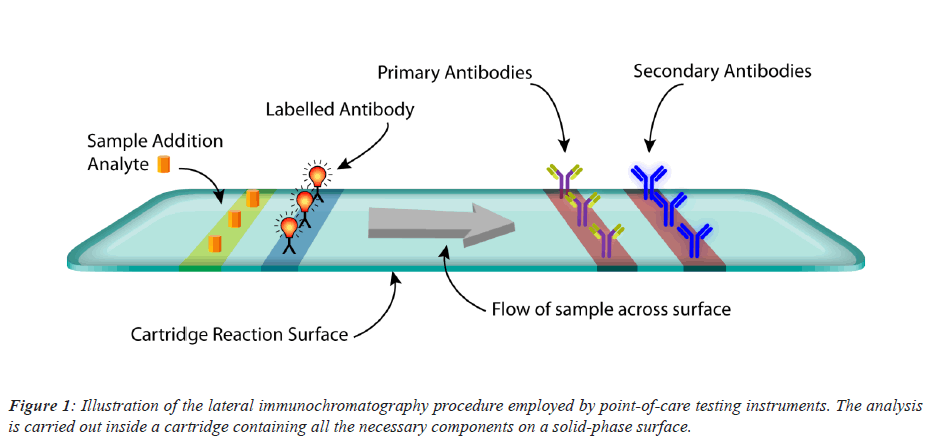
Immune chromatography assay is a combination of two commonly used medical techniques, namely: chromatography and immune sorbent essays. The cartridge of the instrument is usually composed cellulose service that is intended to transfer the sample containing the required analyte across its surface in a homogeneous manner able to react to the remaining components of the chemical reaction. The reaction begins after the immediate addition of the sample containing the analyte, where it interacts with a label conjugate containing a fluorescent molecule making up and immune complex. This complex will move towards the attached antibodies both primary and secondary. Depending on the essay specificity and antibody affinity to the specific analyte detected, a sandwich immune complex is formed and two strips in a form of visible lines are formed which then being detected through a fluorescent detection device (Figure 1).
Current scientific advancements in the area of fluorescence have made it possible for smaller form instrument platforms to detect and analyze the same analytes targeted by their larger manufacturer counterparts with comparable accuracy [7,8]. Many new instruments on the market today use this technology in the form of lateral flow immunoassay systems that can be packaged into different types of instruments. These instruments are marketed as point-of-care testing systems because of their relative ease of manufacturing and production which then can be easily scaled according to the medical laboratory needs ranging from low volume to very large continuous flow sample processing [9]. Moreover, the use of such cartridge systems is usually easy for normal laboratory personnel as well as minimally trained medical personnel making it a perfect option for small laboratories or clinic offices. This combined with a long shelf life cartridge stored under normal room temperature conditions makes it a low complexity testing system as designated by CLIA.
Here we aim to evaluate the Fluorescence Immunochromatographic method in terms of accuracy and precision, and to compare the performance of measurements between the Bronate Affinity method of the Fluorescence Immunochromatographic method.
Methods
Reference materials
HbA1c Quality Control reference materials were used as the samples for all HbA1c measurements. “Control N” and “Control P” (Cormay, Poland) with HbA1c concentration of 6.1 mmol/mol and 11.1 mmol/mol respectively were used for the precision and comparability analysis. HbA1c QC (Wondfo Biotech, Guangzhou) with a concentration of 12.6 mmol/mol was used for the accuracy and the Bland- Altman analysis. Ten serial dilutions of the HbA1c were prepared with final concentrations of: 5 mmol/mol, 5.2 mmol/mol, 5.7 mmol/mol, 6 mmol/mol, 7.5 mmol/mol, 8.2 mmol/mol, 9 mmol/mol, 11 mmol/mol, 12 mmol/mol, and 12.6 mmol/mol.
Sample preparation
HbA1c measurements were carried out using 10 μL of the designated reference material that was transferred into the reaction buffer of the HbA1c kit (Wondfo Biotech, Guangzhou). Immediately after the addition of the reference materials, reaction buffer tubes were gently mixed by multiple inversions and the left for incubation on bench-top for 1 minute at room temperature. Then, 75 μL of mixed reaction buffers containing was loaded into the sample well of the reaction cartridge. The Finecare® instrument was loaded with the accompanying ID chip of the HbA1c kit before loading the test cartridge into the instrument. Similarly, for the Clover® instrument, HbA1c kits were used to according to manufacturer’s recommendations to carry out the testing procedure for the same reference materials.
Statistical methods
Linear regression and non-linear fit tests were used to assess the HbA1c QC measurements values. Runs test, Anderson-Darling and Goodness of Fit parameters were analyzed using the GraphPad Prism software version 8.2. Compatibility of the Fluorescent Immunochromatography method to the Bronate Affinity method was assessed by analyzing HbA1c measurement of ten prepared samples from the HbA1c QC using a linear regression model. Additionally, the Bland-Altman Plotting method, a widely used comparison method in clinical settings [10], was also used to determine the comparability of measurements between the Fluorescent Immunochromatography method and the Bronate Affinity method within a 1.96 SD limit. Moreover, twenty repeated measurements of “Control N” and “Control P” were carried out to assess accuracy and precision. Measurements were analyzed using the GraphPad Prism software version 8.2 for constructing plots and calculating covariance. Results of repeated measurement were then analyzed using the “Data Analysis” tool of the Microsoft Excel software to calculate the mean, standard error, standard deviation, sample variance, and CV%.
Results
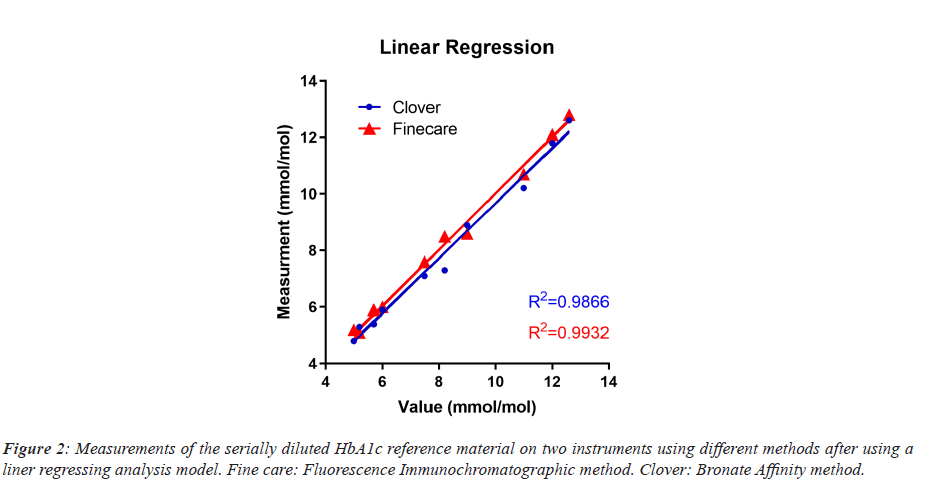
Accuracy and linearity analysis of the Fluorescent Immunochromatography method, using calculated deviations (Table 1), for the HbA1c QC showed an insignificant difference from true values using the Runs test method (P value=0.88) and the Anderson-Darling method (P value=0.18). The R2 of the repeated measurements with a 95% confidence interval was 0.9932 (Figure 2) when calculating the Y-intercept=1.002*X+0.000.
| S. No | QC Value | Clover | Fine care | ||
|---|---|---|---|---|---|
| Result | Variance | Result | Variance | ||
| 1 | 5.0 | 4.8 | 0.2 | 5.2 | -0.2 |
| 2 | 5.2 | 5.3 | -0.1 | 5.1 | 0.1 |
| 3 | 5.7 | 5.4 | 0.3 | 5.9 | -0.2 |
| 4 | 6.0 | 5.9 | 0.1 | 6.0 | 0.0 |
| 5 | 7.5 | 7.1 | 0.4 | 7.6 | -0.1 |
| 6 | 8.2 | 7.3 | 0.9 | 8.5 | -0.3 |
| 7 | 9.0 | 8.9 | 0.1 | 8.6 | 0.4 |
| 8 | 11.0 | 10.2 | 0.8 | 10.7 | 0.3 |
| 9 | 12.0 | 11.8 | 0.2 | 12.1 | -0.1 |
| 10 | 12.6 | 12.6 | 0.0 | 12.8 | -0.2 |
Table 1. Values of HbA1c QC measurements.
The “best fit values” after comparing the measurement values of HbA1c QC between Bronate Affinity method and Fluorescent Immunochromatography method for the Slope of the linear regression model were 0.9764 ± 0.05566 with “Y” intercept of 0.5469 ± 0.4657, “X” intercept of -0.5601, and R2 of 0.9747. Similarly, comparison of two sets of HbA1c references materials, “Control N” and “Control P”, after twenty repeated analysis showed a coefficient of variation (CV) of 2.64% and 3.55% respectively (Table 2).
| N | Mean | S.E. | S.D. | S.V. | CV% | |
|---|---|---|---|---|---|---|
| Control N (6.1) | 20 | 6.00 | 0.07 | 0.16 | 0.03 | 2.67 |
| Control P (11.1) | 20 | 10.98 | 0.17 | 0.39 | 0.15 | 3.55 |
Table 2. Descriptive statistics showing the measurements of two different HbA1c reference materials. N=Number of measurements; S.E.=Standard Error; S.D.=Standards Deviation; S.V=Sample Variance; CV=Coefficient of Variation.
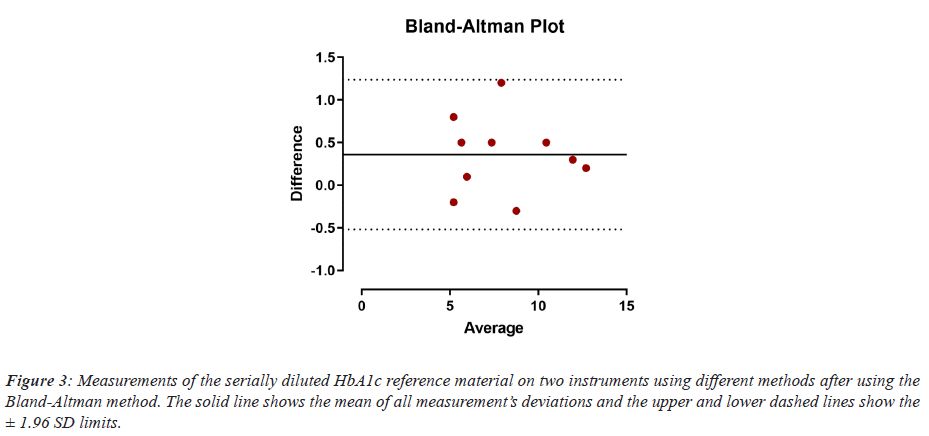
All HbA1c measurements fell within the ± 1.96 SD limit of the Bland-Altman Plotting method, which indicates the acceptance of the measurements against the mean and that there were no significant variance between the individual readings and the mean of all ten measurements (Figure 3).
Discussion
The Fluorescent Immunochromatography is a promising new technology offering low-volume medical laboratories the opportunity to compete, in providing more testing options requiring advanced immunoassay technologies, with bigger laboratories with automated or modular instrument platforms. The performance of the HbA1c testing kit was analyzed using the small form factor Finecare® Fluorescent Immunochromatography instrument. Simple accuracy, precision, and linearity assays were performed to assess the performance of the HbA1c kit. We also performed a comparability study between the Fluorescent Immunochromatography and the Bronate Affinity method by employing the Bland-Altman method. There was no significant difference between the well-established method of bronate affinity, in detecting HbA1c, and the newly developed method of Fluorescent Immunochromatography.
Conclusion
Method evaluation employing both a liner regression model of analysis as well as the Bland-Altman method showed no significant variance in results of the repeated measurements. This shows that the Finecare® Fluorescent Immunochromatography instrument is suitable option for detecting HbA1c, in the clinically significant detection range, in low-volume medical laboratories.
Acknowledgement
The author would like to thank Ms. Bushra Al-Mugari and Wardh Al-Sarrani for their help with sample preparation.
Conflict of Interest
The author declares that there is no conflict of interest or competing financial interests.
References
- Petersen AB, Gudmann P, Milvang-Grønager P, Mørkeberg R, Bogestrand S, Linneberg A. Performance evaluation of a specific IgE assay developed for the ADVIA Centaur® immunoassay system. Clin Biochem 2004; 37: 882-892.
- Chen D, Kaplan L, Liu Q. Evaluation of two chemiluminescent immunoassays of ADVIA Centaur for hepatitis B serology markers. Clin chim acta 2005; 355: 41-45.
- Wadood M, Usman M. Comparative Analysis of Electrochemiluminescence Assay and Chemiluminescent Microparticle Immunoassay for the Screening of Hepatitis C. Indian J Hematol Blood Transfus 2019; 35: 131-136.
- Serdarevic N, Smajic J. Comparison of chemiluminescent microparticle immunoassay (CMIA) with Electrochemiluminescence Immunoassay (ECLIA) for Carcinoembryonic antigen (CEA). J Health Sci 2018; 8: 94-100.
- Schmid RW, Lotz J, Schweigert R, Lackner K, Aimo G, Friese J. Multi-site analytical evaluation of a chemiluminescent magnetic microparticle immunoassay (CMIA) for sirolimus on the Abbott ARCHITECT analyzer. Clin biochem 2009; 42: 1543-1548.
- Ognibene A, Drake CJ, Jeng K-YS, Pascucci TE, Hsu S, Luceri F. A new modular chemiluminescence immunoassay analyser evaluated. Clin Chem Lab Med 2000; 38: 251-260.
- Boonlert W, Lolekha PH, Kost GJ, Lolekha S. Comparison of the performance of point-of-care and device analyzers to hospital laboratory instruments. Point of Care 2003; 2: 172-178.
- Oh SW, Moon JD, Park SY, Jang HJ, Kim JH, Nahm KB. Evaluation of fluorescence hs-CRP immunoassay for point-of-care testing. Clin Chim Acta 2005; 356: 172-177.
- Liu MY, Yang Y, Zhang LJ, Pu LH, He DF, Liu JY. Potential predictors for mental stress-induced myocardial ischemia in patients with coronary artery disease. Chin Med J 2019; 132: 1390.
- Zaki R, Bulgiba A, Ismail R, Ismail NA. Statistical methods used to test for agreement of medical instruments measuring continuous variables in method comparison studies: a systematic review. PloS one 2012; 7: e37908.


