Keywords
|
| Mammograms, Breast cancer, Enhancement, Micro-calcifications, Fusion, DCT, DWT. |
Introduction
|
| Breast cancer is the frequently diagnosed cancer, other than skin cancer, amongst females in U.S [1,2]. It is also forecasted that the breast cancer can be the foremost cause of casualties during forthcoming decades [3,4]. Various studies have demonstrated that early detection and proper treatment of breast cancer may diminish the mortality rate [5,6]. Mammography cannot stop or decrease breast cancer but are supportive only in detecting the breast cancer at early stages to increase the survival rate [2,6]. Regular screening can be a successful strategy to identify the early symptoms of breast cancer in mammographic images [7]. |
| Enhancement of digital images is the foremost challenging task in computerized diagnosis of breast cancer using mammographic images [8,9]. Because of low contrast results [10], it is complicated to handle two major concerns namely; false-positive interpretations [11] and false-negative results [12]. False-positive results lead to surgeries with benign (noncancerous) conditions. False-negatives let the early stage disease to develop to a more complicated stage with fewer rates of survival. Recently, an assortment of computer-aided methods have been examined and yielded different levels of success for the analysis of digital mammograms. They aim at highlighting to areas of interests like lesions, masses, etc, making them visible to the radiologists which are helpful in increasing the likelihood of early detection of breast cancer from mammographic images. |
| For noise restoration from mammograms, a method has been introduced by Naveed et al. [13] which are supposed to address this problem by combining various filters and neural network based noise detection. An adaptive technique based on wavelet transform was proposed by Scharcanski [14] in order to restore the noise from mammograms; a mammogram image is decomposed into many scales and at each scale, coefficients related to noise are modeled by generalized Gaussian random variables and the shrinkage function at successive scales are combined and wavelet coefficients are applied. Langarizadeh et al. [15] used Histogram Equalization stretching and median filters equalization for the diagnostic of masses and microcalcifications for the detection of breast cancer. Other findings also revealed that the quality of image is improved relatively by using selected techniques. The second pre-processing task is segmentation that is performed to delineate the unwanted regions from the mammograms which contains background removal and pectoral muscles separation [16]. An enormous part of mammogram carries background which is nothing to do with breast cancer detection so it is pertinent to remove it to restrict the region of interest where the tumor normally exists in order to obtain the better classification accuracy rate. |
| Texture features perform a significant task in CAD environment. DWT is a linear transformation where mammographic image information is divided into detailed and approximation parts. Detail components carry information of vertical, horizontal and diagonal sub-bands of the mammogram. These parts can be achieved by implementing the high pass and low pass filters on the mammogram respectively. DCT is used to convert the signal into its frequency parts. In image processing DCT is intended to decorrelate the image data. DCT features have been used for the recognition of face and some coefficients are selected to form feature vectors [17]. To reduce the dimensionality of features, Principal Components Analysis (PCA) is applied. Park et al. [18] implemented PCA to reduce the features dimensions which are fed to a classifier. PCA attempts to reduce the huge data saving time and efforts for further image processing with no loss of significant information. It is necessary that the resultant features restrain the utmost information of input image data. |
| Numerous methods have been created to classify masses into benign and malignant categories. Lahmiri and Boukadoum [19], proposed a supervised learning technique for classification using SVM classifier with DCT features in order to classify mammograms into normal and cancer images with an accuracy of around 92.98%. Another study tested the robustness of extracted DCT features to discriminate between normal and suspicious of mammograms. They implemented KNN classifier achieving the sensitivity of 98% and specificity of 66% using the MIAS [20]. |
| Zakeri et al. [21] used the shape and texture features for classification of mammograms into benign and malignant classes. They applied SVM classifier and achieved 95.00%accuracy, 90.91% sensitivity, 97.87% specificity, 96.77% positive predictive value (PPV), 93.88% negative predictive value (NPV), and 89.71% Matthew’s correlation coefficient (MCC). In another research, the authors used the Bayesian Neural Network for the classification of mammograms into normal, benign and malignant mammograms with accuracy rate of about 86.84%. The experiments were conducted using a total of 218 tissues samples including 99 normal, 68 benign and 51 malignant [22]. |
| In this paper, a new GP based enhancement technique is introduced for noise restoration. Then region of interests (ROIs) are extracted by implementing background and pectoral muscles removal techniques. Subsequently, DCT and DWT features are extracted from the ROIs and are fused to get unique features set. Finally these features set are given to the SVM classifier to classify mammograms into normal and abnormal (either benign or malignant) mammograms. |
Material and Methods
|
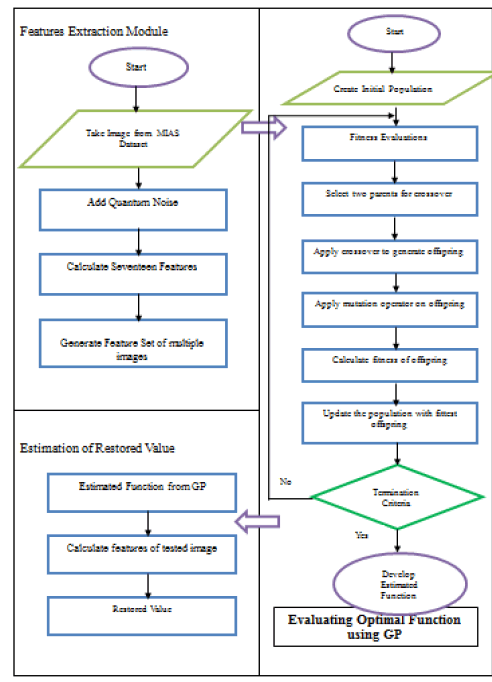
| MIAS dataset is used for experimentation purpose in this study which is a standard and publicly available dataset. The size of each mammogram is 1024 × 1024 pixels and 200 micron resolution. MIAS contains a total of 322 mammograms of both breasts (left and right) of 161 patients. Out of which 61 are labeled as benign, 54 as malignant and 207 are normal mammogram [23]. The complete scheme in this study was implemented using the Image Processing Toolbox in MATLAB 8.0. The whole methodology comprised of the four sequential steps as shown in figure 1. |
Genetic programming (GP) based quantum noise removal filter
|
| GP is a machine learning procedure which optimizes a population of computer programs in order to perform a particular assigned computational job. The best optimal solution in the numerical function form is generated through GP evolution cycle. For the proposed filter, GP is supposed to create a numerical optimal evolved expression for mammogram image restoration that optimally combines and exploits dependencies among features of the degraded/blurred mammogram image. To develop such type of function, at first stage, a set of feature vectors is generated by taking a small neighbourhood around each pixel. Then, at second stage, the estimator is trained and produced through GP procedure which has an automatic way of selecting and combining the beneficial feature information under a fitness criterion. These are the same features which make the feature vector at first level. Finally, the created function (equation 1) is used to estimate the mammogram image pixel intensity of the degraded mammographic images. The performance of the filter function is estimated using various degraded mammogram images. The proposed filter effectively removes the noise and enhances the mammograms for further processing. The newly proposed technique is divided into three parts which are described above and shown in Figure 2, Table 1 and Equation1 respectively. |
| • Features Extraction Module |
| • Evaluating Optimal Function using Genetic Programming |
| • Estimation of Restored Value |
Extracting ROIs
|
| After the noise removal from all mammograms, now they are fit for further processing so the next step is to extract ROIs. A mammogram contains background (black portion) and pectoral muscles which are not part of breast so it is necessary to remove these unwanted regions in order to focus on region of ROIs only where the probability of cancer exists. Removal of these extra regions not only increases the performance but also decreases the complexity of a classifier. The background is removed by implementing the technique used by Nagi et al. [24] and pectoral muscles are separated by using the method of Naveed et al. [13]. Now the resultant mammogram image is the breast part (ROI), this is used to extract the features in forthcoming section. |
| Error (RMSE) fitness criterion |
| F(x1,,x17)=x7+sin(x2+x6+x10+x19)+0.352 × (x17+cos(x12+((x13 × (x15+x13+x9+x2)) × x1)+(((x5 × x6) × sin(x8) × x9) × 0.419)+sin(x11+x7) × 5(x7+x8)/x9+(0.502 × ((x5+x9)+0.312)) × (x8+(x7+(x17 × (0.102 × x5)) × (x2+(x13/sin(exp(x7+x9)) +x2)+0.243)+(log(x6)+(((x13+(x12+x6))) × x14)) +sin(x11+x5) × 4(x6+x2)/x11+(0.73 × ((x4+x1)+0.816))(1) |
Features extraction
|
| The accurate classification and diagnostic rate is mainly depends upon robust features, particularly while dealing with mammograms. DWT and DCT are applied on mammographic images. Then twelve (12) DCT and eight (8) DWT features have been experimentally selected using principal component analysis (PCA). This set of 20 features has been fused (combined) to form a single vector which is fed to SVM classifier. Similarly features of all images have been extracted which are given to the classifier in order to distinguish between normal and abnormal mammograms in the subsequent section. |
Classification
|
| The process of classifying features into their respective classes, such as normal and abnormal or benign and malignant, is known as classification. In binary classification problems like normal/abnormal, SVMs perform better comparatively. SVM is implemented in this paper using hold-out technique for splitting the entire dataset into training and testing components, where 70% of the mammograms are allocated to the training set and the remaining 30% to the testing set from both classes. The results are presented in the upcoming section. |
Experimental Results
|
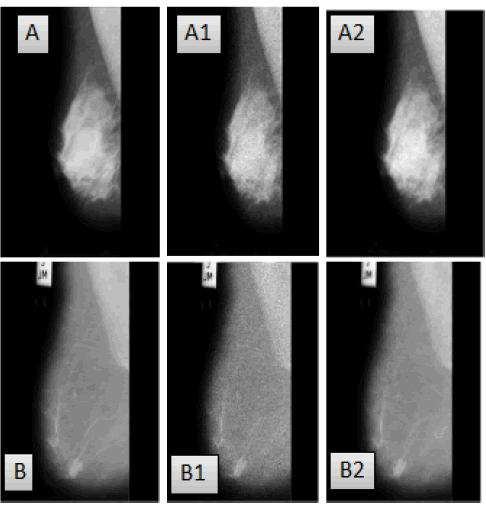
| The proposed GP filter effectively restores the noise from mammograms which is beneficial in getting higher diagnostic rate (differentiation between normal and abnormal mammograms). The images shown in figure 3 (a-b) however, are the original noise-free images and their respective noisy images are shown in figure 3 (a1-b1) where quantum noise is manually added using Matlab 8. |
| There does not exist such dataset that carry this kind of noise [24-27]. It is observable that Poisson noise has been eliminated effectively and the sharpness of the images are preserved-the images almost look like their original (Figures 3, a2-b2). This shows the efficacy of the proposed GP filter in noise removal. |
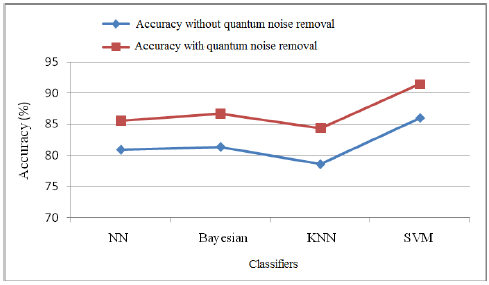
| In order to reaffirm the performance of the proposed GP filter, some further experiments were conducted. The classification accuracy in the presence/absence of quantum noise is computed using DCT features by using some famous classifiers like SVM, ANN (Artificial Neural Networks), k-NN (k-nearest neighbourhood) and Bayesian. |
| The results shown in table 2 and figure 4 have demonstrated that the proposed GP filter has successfully enhanced the classification accuracy rate by more than 6%. |
| This substantial improvement proved the supremacy of GP noise removal filter and as well as SVM classifier. It is also demonstrated that the removal of noise is very important before classification into normal and abnormal mammograms. |
| After the noise removal, the background of the image is removed which contains annotations and black portion. Once the background is removed, then the pectoral muscles have been removed since they are not part of breast. |
| Now the resultant mammogram image is the part which contains only the breast region where the probability of cancer exists. The proposed fused (DCTODWT) features from this part are extracted and fed to SVM. The results are shown below in table 3. |
| The above Table depicts the overall accuracy rate of SVM classifier with 10-fold cross validation technique to distinguish between normal and abnormal mammograms. The promising results revealed that the newly proposed features are discriminating. |
Conclusion
|
| The produced classification results are very much promising with 96.97% accuracy, 98.39% sensitivity and 94.59% specificity. Such type of encouraging results are the indicative of the state-of-the-art newly proposed GP based noise removal technique and best performance of proposed fusion of (DCTODWT) features in order to differentiate between normal and abnormal mammograms with higher accuracy rate. |
| The proposed method may provide an adequate support to the radiologists in differentiating between normal and abnormal mammograms, as a second opinion. The algorithm successfully differentiates normal and abnormal mammograms with high accuracy, sensitivity and specificity. |
Discussion
|
| In the present paper, a fully computerized classification scheme is proposed which focuses on identifying normal and abnormal mammograms. The main contribution of this paper is the newly proposed GP filter which addresses the major problem of mammograms, which is removal of noise. Then, the second contribution is the proposed fusion of (DCTODWT) features. |
| These fused features proved highly fruitful results in differentiating between normal and abnormal mammograms with higher accuracy rate. The notable advantage of this proposed classification scheme can also be the reduction in false positive rate. The limitations of this work includes the large amount of time required to train GP filter, once it is trained properly then it works efficiently and produces better results. |
Acknowledgement
|
| The authors are thankful to the Deanship of Scientific Research, King Saud University Riyadh Saudi Arabia for funding through the Research Group Project no. RG-1437. |
Tables at a glance
|
|
|
Figures at a glance
|
 |
 |
 |
 |
| Figure 1 |
Figure 2 |
Figure 3 |
Figure 4 |
|
References
|
- Jemal A, Siegel R Xu J, Ward E. Cancer statistics 2010 CA Cancer J Clin 2010; 60: 277-300.
- Siegel R, Naishadham D, Jemal A. Cancer Statistics 2013 CA Cancer J Clin 2013; 63: 11-30.
- Kolker JL, Ismail AI, Sohn W, Ramaswami N. Trends in the incidence, mortality, and survival rates of oral and pharyngeal cancer in a high-risk area in Michigan, USA Community Dent Oral Epidemiol 2007; 35: 489-499.
- Hanahan D, Weinberg RA. Hallmarks of cancer, the next generation Cell 2011; 144: 646-674.
- Kaul K, DaguilhF ML. Early detection of breast cancer, is mammography enough? Hospital Physician 2002; 38: 49-54.
- Smith RA, Cokkinides V, Eyre HJ. American Cancer Society guidelines for the early detection of cancer 2006. CA Cancer J Clin 2006; 56: 11-25.
- Zhang GP, Yan P, Zhao H. A computer aided diagnosis system in mammography using artificial neural networks. IEEE International Conference on Biomedical Engineering and Informatics, 2008; 02: 823-826.
- Mencattini AM, Salmeri M, Lojacono R, Manuela F. Mammographic images enhancement and denoising for breast cancer detection using dyadic wavelet processing. IEEE Transactions on Instrumentation and Measurement, 2008; 57: 1422-1430.
- Romualdo LS, Vieira MC, Schiabel H, Mascarenhas NDA, Borges LR. Mammographic Image Denoising and Enhancement Using the Anscombe Transformation, Adaptive Wiener Filtering, and the Modulation Transfer Function. Journal of Digital Imaging 2013; 26: 183-197.
- Kom GA, Tiedeu, et al. Computerized detection of masses on mammograms by entropy maximization thresholding.The Abdus Salam International Centre for Theoretical Physics, Trieste (Italy) 2010; 1-21.
- Brewer NT, Jessica T. DeFrankSalz JT. Systematic review, the long-term effects of false-positive mammograms. Annals of Internal Medicine 2007; 146: 502-510.
- Hui Zhi, Bing Ou, Bao-Ming Luo, Xia Feng, Yan-Ling Wen, Hai-Yun Yang. Comparison of ultrasound elastography, mammography, and sonography in the diagnosis of solid breast lesions. Journal of Ultrasound in Medicine 2007; 26: 807-815.
- Naveed N, Hussain A, Jaffar MA Choi TS. Quantum and impulse noise filtering from breast mammogram images. Computer methods and programs in biomedicine 2012; 108: 1062-1069.
- Scharcanski J. Wavelet transform approach to adaptive image denoising and enhancement. Journal of Electronic Imaging 2004; 13: 278-285.
- Langarizadeh M, Mahmud R, Ramli AR, Napis S, Beikzadeh MR, Rahman WE. Improvement of digital mammogram images using histogram equalization, histogram stretching and median filter. Journal of Medical Engineering and Technology 2011; 35: 103-108.
- Xu W, Xia S, Duan H, Xiao M. Segmentation of mass in mammograms using a novel intelligent algorithm. International Journal of Pattern Recognition and Artificial Intelligence 2006; 20: 255-270.
- Dabbaghchian S, Ghaemmaghami MP,Aghagolzadeh A. "Feature extraction using discrete cosine transform and discrimination power analysis with a face recognition technology." Pattern recognition 2010; 43: 1431-1440.
- Park MS, Na JH, Choi JY. PCA-based feature extraction using class information. IEEE International Conference on Systems, Man and Cybernetics 2005; 01: 341-345.
- Lahmiri S and M. Boukadoum. Hybrid discrete wavelet transform and Gabor filter banks Processing for features extraction from biomedical images. Journal of Medical Engineering 2013; 1-13.
- Kendall EJ and Flynn MT. Automated Breast Image Classification Using Features from Its Discrete Cosine Transform. PloS one 2014; 9: e91015.
- Zakeri FS, Behnam H,Ahmadinejad N. Classification of benign and malignant breast masses based on shape and texture features in sonography images. Journal of medical systems 2012; 36:1621-1627.
- Martins LDO, Santos AMD,Silva AC,Paiva AC. Classification of normal, benign and malignant tissues using co-occurrence matrix and Bayesian neural network in mammographic images. Neural Networks 2006.
- Suckling J, Parker J, Astley S,Dance D. The Mammographic Images Analysis Society digital mammogram database. ExerptaMedica International Congress Series 1994; 1069: 375-378.
- Nagi J, Kareem SA, Nagi F, Ahmed SK. Automated breast profile segmentation for ROI detection using digital mammograms. IEEE EMBS Conference on Biomedical Engineering and Sciences (IECBES) 2010; 87-92.
- Dos Santos Romualdo LC, da Costa Vieira MA and Schiabel, H. Mammography images restoration by quantum noise reduction and inverse MTF filtering. XXII IEEE Brazilian Symposium on Computer Graphics and Image Processing (SIBGRAPI) 2009; 180-185.
- Naseem MT, Sulong GB, Jaffar MA. Quantum Noise Removal and Classification of Breast Mammogram Images. Microscopy Research and Technique 2012; 75: 1609-1612.
- Wang , Li JB, Wu L, Gao H (2013). Mammography visual enhancement in CAD-based breast cancer diagnosis. Clinical imaging 2013; 37: 273-282.
|


