Research Article - Current Pediatric Research (2017) Volume 21, Issue 2
Body mass index, waist hip ratio and body fat percentage as early predictors of pre-diabetes and pre-hypertension in adolescents.
Ramya HS1, Goutham AS2* and Pragyee D21Assistant Professor, Department of Pediatrics, KIMS Bangalore, India.
2Postgraduate Students, Department of Pediatrics, KIMS Bangalore, India.
- *Corresponding Author:
- Goutham AS
Junior Resident, Department of Pediatrics
Kempegowda Institute of Medical Sciences
#208, KIMS Residents Quaters, KIMS Hospital
VV Puram, Bangalore, Karnataka, 560004, India.
Tel: +919590946059
E-mail: gouthamas@gmail.com
Accepted date: April 18, 2017
Abstract
Objective: The study aimed to assess the relationship between Body mass index (BMI), body fat percentage(BFP) and waist hip(WH) ratio in predicting Pre-Diabetes and Pre- Hypertension. Methods: A total of 389 adolescents aged 11–17 years were recruited from Doddaballapura government school. Body Mass Index and Waist Hip Ratio were determined using standard equipment’s. Body fat percentage was derived from a body fat analyser. Fasting blood glucose was determined by glucometer method, Blood pressure was recorded using sphygmomanometer. Results: Compare to students with normal BMI, those who are overweight had 7.19 times [95% CI: (2.25-22.96)] high odds to have pre hypertension or hypertension. Similarly compare to normal BMI students, obese students were 28.76 times high odds [95% CI: (2.5-330.27)] to have pre hypertension or hypertension. There was no significant difference between normal BMI students and underweight students in terms of Pre hypertension/ Hypertension. Compare to students with normal WH ratio, low WHR students didn’t have any significant correlation in developing Pre hypertension or hypertension. Compared to students with normal Body fat percentage, those who had a high BFP were 6.02 times high odds to have pre hypertension or hypertension similarly those who had very high BFP were 21.25 times high odds to have pre hypertension or hypertension in respect to predicting pre diabetes, BMI and waist to hip ratio were not significantly correlated, whereas high Body fat percentage had 1.46 high odds as compared to normal BFP. Conclusion: These data suggest the importance of the BMI, Body fat percentage and waist to hip ratio in adolescents, in prevention and early intervention of Obesity, Hypertension and Pre-diabetes since it may be the most cost-effective way of reducing the complications related with them.
Keywords
Hypertension, Obesity, Childhood, Body mass index.
Introduction
The unabated rise in the prevalence of overweight in children and adolescents is one of the most alarming public health issues facing the world today [1]. Among Indian children, various studies reported the magnitude of overweight to be from 9 to 27.5% and that of obesity from 1 to 12.9% [2-6]. Obesity increases the risk for many chronic diseases including diabetes mellitus, cardiovascular disease and non-alcoholic fatty liver disease, which, further decreases the overall quality of life [7-9]. Therefore, it is imperative to identify the individuals at risk at an early stage. Increasing evidence suggests that this epidemic of childhood obesity as a causative agent for premature onset of hypertension, resulting in, increased risk for adult coronary heart diseases [10,11]. The landmark Global Burden of Disease Study showed that the hypertension is leading the list of risk factors for death and disability worldwide [12].
Since the late 1990s, both the World Health Organization (WHO) and the National Heart, Lung, and Blood Institute (NHLBI) have proposed that abnormal body weight be classified according to the body mass index (BMI) and body fat distribution, measured by the abdominal circumference (AC) or the waist circumference (WC) [13,14] It is widely accepted that being overweight, traditionally defined as having a body mass index 25 kg/m2, is a major risk factor for a wide range of chronic diseases and injuries including cardiovascular disease (CVD), type II diabetes and certain site specific cancers including colorectal and breast cancer [15,16]. A recent report from the Prospective Studies Collaboration, which was based on 466 000 deaths, estimated that optimal survival is achieved at a BMI of 22.5–25 kg/m2 with reductions in life expectancy of 3 and 10 years in individuals with moderate (BMI 30–35 kg/m2) and extreme obesity (BMI 40–50 kg/m2), respectively, the latter being equivalent to the years lost by lifetime smoking (Prospective Studies Collaboration, 2009) [17-20].
Although some cohort studies have shown that the higher the BMI, the greater the likelihood of developing hypertension in adults, The WHO recommends the use of the AC, taken at half-distance between the iliac crest and the lower rib cage rim, on the horizontal plane as a measurement of obesity [17-23]. However, the NHLBI prefers using the WC, measured at the highest portion of the right iliac crest as an indicator of obesity. The guide for identification and treatment of obesity in adults, published in 1998, refers to several prospective studies showing that abdominal fat correlates with increased mortality rate and risk for diabetes, hyperlipidemia, hypertension, coronary artery disease and cerebral and peripheral disease [24]. In spite of the need to establish cut off points of WC/AC for risk prediction of obesity related complication in children and adolescents, this was not proposed until 2004, although some articles reported percentile distributions in different populations [25]. So far, the cut-off points proposed for adults by the NHLBI7 were used, with 88 centimetres for women and 102 cm for men as standards.
Paediatric hypertension is increasing along with the paediatric obesity epidemic. Blood pressure measurement neither have been included in elementary school children health examination schedule, nor have blood pressure check-up been required during paediatric medical visits in India. This has led to under diagnosis of paediatric hypertension in clinical settings [26]. Hypertension is classified as essential (primary) or secondary to underlying cause, e.g. disease of renal parenchyma, renovascular or endocrine disorders. Screening studies suggest that essential hypertension is in increase trend during late childhood and adolescence. There is increasing evidence that essential hypertension tracks into adulthood, resulting in considerable cardiovascular morbidity [27]. The objective of this present article was to assess the sensitivity and specificity of anthropometric body fat measurements in predicting hypertension and pre diabetes in a sample of school going children of Karnataka.
Materials and Methods
Study Design and Size
A cross sectional study was carried out in Doddaballapura Government school, Karnataka, in December 2015, by Department of Paediatrics of Kempegowda Institute of Medical Sciences. A total of 389 students comprising of male and female adolescents, aged 11 to 17 years. Children with chronic disease like renal, hepatic or endocrine disorders or taking treatment for the same were excluded.
Data Collection Procedure
An informed consent was taken from all the subjects/ Principal of the school and institutes ethics committee permission was obtained. School was visited 1 day prior to the pre-arranged date and instructed for overnight fasting.
Anthropometric Parameters
The study protocol included anthropometric parameters, body weight, height, waist circumference (WC) and hip circumference (HC). Adolescents weight was measured (to the nearest 0.5 kg) with the child standing motionless on the weighing scale with feet 15 cm apart and weight equally distributed on each leg. Height was measured with adolescent being bare foot (to the nearest 0.5 cm) with the child standing in an erect position against a vertical scale of portable stadiometer with the participants feet placed together with heels, buttocks and shoulder blade against the stick head positioned in Frankfurt horizontal plane. Waist circumference was measured with a non-stretchable tape (exerting the same standard pressure on the tape) at the midpoint of the lowest rib cage and the iliac crest, to the nearest 0.1 cm. Hip circumference was measured at the level of greater trochanters with the subject in standing position and both feet together. For all measurements, tape was positioned parallel to the floor.
BMI was computed by dividing weight (kg) by height square (m2). BMI categories were defined as (a) Normal weight, (b) Overweight and (c) Obese according to contemporary Indian data. Height for age, weight for age and BMI for age z-scores were computed using Indian reference data [28].
Blood pressure was measured on left arm by auscultatory method using mercury sphygmomanometer. The individual was made comfortable and seated at least for five minutes in the chair before measurement. Hypertensive and Pre- Hypertensive children considered and were checked again half an hour apart and the average of two reading was taken. Pre-Hypertension and Hypertension are diagnosed if Systolic or Diastolic blood pressure or both are >90th to <95th and >95th centile as per age and height, respectively.
Fasting plasma glucose was measured with One Touch Glucometer (Johnson & Johnson Co.) in all the subjects after an overnight 10 h fast. Later students were provided with breakfast. Pre-diabetes was defined as fasting plasma glucose between 100 mg/dl to 125 mg/dl.
Body fat percentage was measured using commercially available digital monitor Omron HBF-306 body fat monitor incorporating bioelectrical impedance(BI) analyser.
Statiscal Analysis
Data were analyzed using SPSS version 19.0.Data was expressed as mean +/- SD for quantative variables or numbers and percentage for categorical variables. Data was compared using student t-test for 2 groups and ANOVA for more than 2 groups. Multivariate regression analysis was done to estimate effect of each variable on obesity. For all test p value<0.05 was considered statically significant.
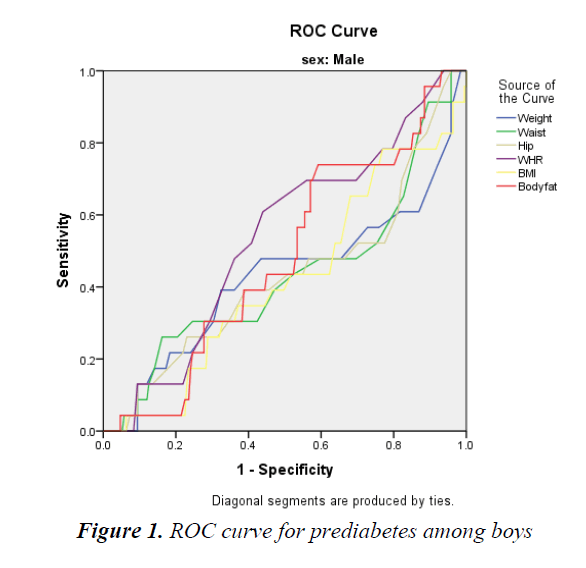
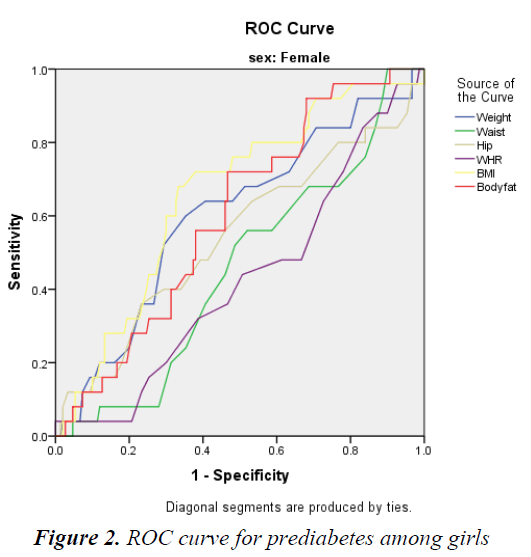
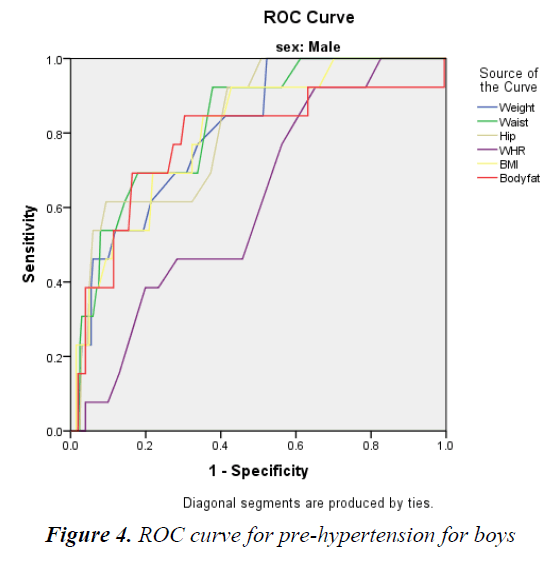
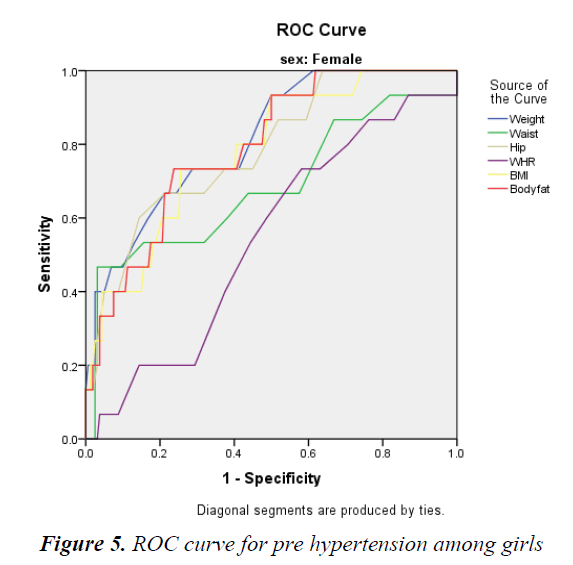
To detect the Sensitivity and Specificity of each anthropometric parameter to detect Prehypertension and Pre-diabetes ROC curve was plotted.
Results
In the present study, total 389 adolescents investigated, 45% were girls and 55% were boys (Tables 1 and 2).
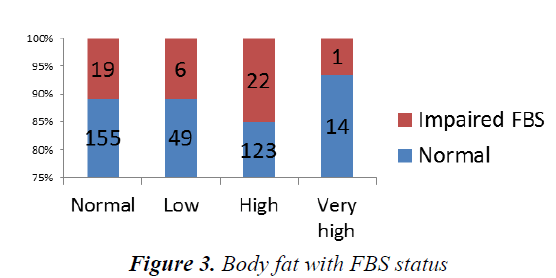
The area under the curve for waist hip ratio, waist circumference, hip circumference, weight, body fat and BMI are 0.54, 0.43, 0.43, 0.43, 0.48 and 0.42, respectively. Of these values the waist hip ratio which had relatively higher area under the curve, at the cut of 0.84, it has 61% sensitivity and 54% specificity in suspecting an individual for pre-diabetes (Table 3 and Figures 1-3).
The area under the curve for waist hip ratio, waist circumference, hip circumference, weight, body fat and BMI are 0.43, 0.46, 0.54, 0.60, 0.60 and 0.66, respectively (Table 4 and Figure 4) for hypertension in boys.
The area under the curve for waist hip ratio, waist circumference, hip circumference, weight, body fat and BMI for hypertension in girls is 0.54, 0.69, 0.79, 0.81, 0.79 and 0.78, respectively (Table 5 and Figure 5).
Interpretation
Compared to students with normal BMI, those who were overweight had 7.19 times [95% CI: (2.25-22.96)] high odds to have pre hypertension or hypertension (Table 6).
Similarly compared to normal BMI students, obese students were had 8.76 times high odds [95% CI: (2.5- 330.27)] to have pre hypertension or hypertension.
There was no significant difference between normal BMI students and underweight students in terms of Pre hypertension/Hypertension.
Compared to students with normal WH ratio, low WHR students did not have any significant correlation in developing pre-hypertension or hypertension.
Compared to students with normal body fat percentage, those who had a high BFP had 6.02 times high odds to have pre-diabetes or diabetes similarly those who had very high body fat percentage who were at 21.25 times high odds to have pre-diabetes and diabetes (Figure 3).
| Anthropometric parameters | Prehypertension/Hypertension | Normotensive | Odds Ratio (95% CI) | P value |
|---|---|---|---|---|
| N (%) | N (%) | |||
| BMI | ||||
| Normal | 21 (6.5) | 302 (93.5) | 1 (Ref) | |
| Underweight | 48 (100.0) | 0 (0.0) | 4.57 (0) | 1 |
| Overweight | 5 (33.3) | 10 (66.7) | 7.19 (2.25-22.96) | 0.001 |
| Obese | 2 (66.7) | 1 (33.3) | 28.76 (2.5-330.27) | 0.007 |
| Waist hip circumference ratio | ||||
| Normal | 14 (12.8) | 95 (87.2) | 1 (Ref) | |
| Low | 11 (4.6) | 226 (95.4) | 0.33 (0.14-0.75) | 0.009 |
| High | 3 (7.0) | 40 (93.8) | 0.51 (0.14-1.87) | 0.309 |
| Body fat | ||||
| Normal | 4 (2.3) | 170 (97.7) | 1 (Ref) | |
| Low | 1 (1.8) | 54 (98.2) | 0.79 (0.09-7.19) | 0.832 |
| High | 18 (12.4) | 127 (87.6) | 6.02 (1.99-18.23) | 0.001 |
| Very high | 5 (33.3) | 10 (66.7) | 21.25 (4.93-91.62) | <0.001 |
| Total | 28 (7.20) | 361 (92.80) | - | - |
Table 1.Association of anthropometric parameters with hypertension status of the students
| Anthropometric Parameters | Impaired FBS N (%) |
Normal FBS N (%) |
Odds Ratio (95% CI) | P value |
|---|---|---|---|---|
| BMI | ||||
| Normal | 40 (12.4) | 283 (87.6) | 1 (Ref) | |
| Underweight | 7 (14.6) | 41 (85.4) | 1.21(0.51-2.87) | 0.669 |
| Overweight | 1 (6.7) | 14 (93.3) | 0.51 (0.06-3.95) | 0.515 |
| Obese | 0 (0.0) | 3 (100) | 4.52 (0) | 0.992 |
| Waist hip circumference ratio | ||||
| Normal | 15 (13.8) | 94 (86.2) | 1 (Ref) | |
| Low | 32 (13.5) | 205 (86.5) | 0.98 (0.51-1.89) | 0.948 |
| High | 1 (2.3) | 42 (97.7) | 0.15 (0.02-1.17) | 0.070 |
| Body fat | ||||
| Normal | 19 (10.9) | 155 (89.1) | 1 (Ref) | |
| Low | 6 (10.9) | 49 (89.1) | 1.01(0.38-0.64) | 0.998 |
| High | 22 (15.2) | 123 (84.8) | 1.46 (0.76-2.82) | 0.260 |
| Very high | 1 (6.7) | 14 (93.3) | 0.58 (0.07-4.68) | 0.611 |
| Total | 28 (7.20) | 361 (92.80) | - | - |
Table 2.Association of anthropometric parameters with diabetes status of the students
| Anthropometric parameter | Cut off point to predict pre diabetes among girls | Sensitivity at this cut-off point to predict pre-hypertension | Specificity at this cut-off point to predict pre-hypertension |
|---|---|---|---|
| Weight | 41.5 | 68% | 46 |
| Hip circumference | 80.5 | 68% | 33% |
| BMI | 18.5 | 72% | 56% |
| Body fat | 22.7 | 72% | 54% |
Table 3. Interpretation ROC curve for prediabetes among girls
| Anthropometric parameter | Cut off point to predict hypertension among boys | Sensitivity at this cut-off point to predict pre-hypertension | Specificity at this cut-off point to predict pre-hypertension |
|---|---|---|---|
| Weight | 45.50 | 85% | 59% |
| Waist circumference | 68.5 | 92% | 63% |
| Hip circumference | 81.5 | 89% | 59% |
| Waist hip ratio | .82 | 92% | 35% |
| BMI | 17.9 | 92% | 58% |
| Body fat | 22.2 | 85% | 70% |
Table 4. Interpretation ROC curve for pre-hypertension for boys
| Anthropometric parameter | Cut off point to predict hypertension among boys | Sensitivity at this cut-off point to predict pre-hypertension | Specificity at this cut-off point to predict pre-hypertension |
|---|---|---|---|
| Weight | 43.5 | 87% | 53% |
| Waist circumference | 64.5 | 87% | 29% |
| Hip circumference | 84.5 | 73% | 63% |
| Waist hip ratio | 80.5 | 73% | 47% |
| BMI | 18.7 | 80% | 60% |
| Body fat | 23.6 | 80% | 58% |
Table 5. Interpretation ROC curve for pre hypertension among girls
Discussion
Vague was first to realize that different body morphology or types of fat distribution were related to various risks associated with obesity [29]. Our study comprising of 214 males and 175 females showed the prevalence of overweight and obesities among preparatory adolescents in government school of Karnataka was 3.9% and 0.8%, respectively.
There is a high incidence of Diabetes in India which is increasing rapidly. International Diabetes Association has estimated that there would be around 70 million cases of Diabetes mellitus in India by the year 2025 [30,31]. Also, studies have shown that diabetes sets in a decade earlier in Indians than West [32]. Abnormal anthropometric indicators like WHR and BMI are associated with a greater possibility of development of DM and metabolic syndrome. Students having a WHR of more than 0.8 were categorised as having high WHR. However, cut-off values of WHR are not prescribed by WHO for children. But previous studies have shown WHR values for children whose weight for age was between 50th to 97th percentile were between 0.8-0.9, which is closer to the WHR cut-off values for adults as per WHO guidelines [33]. In our study, number of students with high waist-hip-ratio especially was 11.1% (43 participants). Significant correlation was found between WHR and pre-diabetic status (p value=0.07) (Table 6). As overweight condition and obesity are risk factors for diabetes, a high waist measurement and a high WHR might serve as a good indicator in recognizing cases at high risk that might progress to pre-diabetic state and later Diabetes mellitus. No correlation was found between pre-diabetes with overweight or obesity. This might be due to the fact that insulin resistance is a common feature even in non-obese Asian Indian subjects with a specific "Asian Indian Phenotype" that refers to certain unique clinical and biochemical abnormalities in Indians which include increased insulin resistance, greater abdominal adiposity, i.e., higher waist circumference despite lower body mass index, lower adiponectin and higher high sensitive C-reactive protein levels. This phenotype makes Asian Indians more prone to diabetes and premature coronary artery disease. At least a part of this is due to genetic factors. This observation is also in accordance with the study done by Narayanappa et al. [32,34,35]. However, the primary drive for the epidemic of diabetes is the rapid epidemiological transition associated with changes in dietary patterns and decreased physical activity as evident from the higher prevalence of diabetes in the urban population which in recent times is also seen in rural areas.
| Study | Year of Study | Place of Study | Prevalence of Hypertension in Obesity |
|---|---|---|---|
| Gupta et al. [42] | 1990 | India | 0.34% |
| Verma et al. [36] | 1994 | Punjab, India | 13.7% |
| Anand et al. [37] | 1996 | Amritsir ,India | 0.23% |
| Macedo et al. [38] | 1996 | North Portugal | 5.2% |
| Sorof et al. [39] | 2002 | Texas, USA | 19.4% |
| Present study | 2015 | Banglore, India | 7.2% |
Table 6: Similar studies
At third screening, a total of 28 cases (7.2%) had abnormal blood pressure of which 5.1% were in pre hypertension group and 2.1% in hypertension. The prevalence in various other studies ranged from 0.46% to 19% as shown in. This wide difference could be due to different standards used for the diagnosis of hypertension and also, due to variations in the regions. Also, there is higher prevalence of hypertension in southern India probably because of influencing factors like genetic inheritance, dietary habits and lifestyle factors.
According to NHBPEP, pre-hypertension defined if BP is between 90th and 95th percentile. Stage I hypertension is BP from 95th percentile to <99th percentile plus 5 mm of Hg. Stage II hypertension is BP more than 99th percentile plus 5 mm of Hg. Prehypertension and stage I hypertension need only weight and dietary management. Stage II hypertension needs pharmacological therapy in addition to weight and diet management. Our cases were managed accordingly.
Anthropometric Risk Factors
Pre-hypertension and hypertension were directly proportional to weight for age (p<0.05). Also it was noted that, high body fat had significant association to incidence of pre hypertension and hypertension. Hypertension in obese children could be due to increased cardiac output, increased blood volume, excessive sodium intake, increased steroid production and alteration in receptors for various presser substances [40].
Body mass index and increased weight and height had a significant association with hypertension in our study (p ≤ 0.001), similar results obtained in Anand et al. [37] Chadha et al. [40] study. The results also showed that lower the BMI, lessen the chances of hypertension. Obesity in childhood is a well-established risk factor for hypertension. In our study, prevalence of HTN in obese children is 11.1% which is statistically significant. Sorof et al. [39] Verma et al. [36] have shown that 19.4% and 13.7% of obese children had hypertension, respectively.
No association was found between waist hip ratio and hypertension, it correlates with studies done by Chaddha et al. and Moussa et al. [40,41].
Limitations
The sample size in the present study was small and there are no standard charts available for the local population from which the sample has been taken. Blood pressure is also influenced by various other factors such as ambience, fasting vs. non fasting state, psychological stress, which could not be controlled in our study.
Recommendations
Regular anthropometric and blood pressure monitoring at least once in a year on an outpatient basis or in routine school health check-up should be incorporated in early life.
Serial blood pressure measurements are required to diagnose hypertension than single reading and children with significant clinical history should be screened at the earliest.
Studies involving a larger population are required to prepare standard centile charts for the local population.
What is Already Known?
Extensive studies have been done to establish relation between waist hip ratio with prehypertension and prediabetes in western country. Those studies correlate faulty food habits and sedentary lifestyle with obesity associated comorbidity.
What this Study Adds?
So far very few similar studies have been done in school going children in India, and study in rural parts of India are very rare. Among the studies which are done, many of them do not include BMI, Waist hip ratio and Body Fat percentage all together to correlation for pre-hypertension and pre-diabetes in a single subjected population sample. Our study establishes this relation in school going children of rural part of Karnataka. It was an extensive study which concluded BMI, Waist hip ratio and Body Fat percentage are early Predictors of Prehypertension and Hypertension. Our results are comparable to studies done at urban scales. Early incidence can prevent this epidemic rise in obesity and associated comorbidities in new India.
Conclusion
Hypertension and Diabetes is a significant problem in the school going adolescents of developing countries. Obesity, waist hip ratio, and increased body mass index are significant anthropometric risk factors for hypertension and diabetes. Using simple screening methods in younger ages itself like measuring BMI, WHR and FBS, it is possible to identify individuals at high risk at an early age and accordingly lifestyle modifications can be adopted to postpone the onset of the disease and reduce the burden on the community and the nation.
References
- Weiss R, Caprio S. The metabolic consequences of childhood obesity. Best Pract Res Clin Endocrinol Metab 2005; 19: 405-419.
- Kapil U, Singh P, Pathak P, et al. Prevalence of obesity among affluent adolescent school children in Delhi. Indian Pediatr 2002; 39: 365-368.
- Sidhu S, Kaur N, Kaur R. Overweight and obesity in affluent school children. Ann Hum Biol 2006; 33: 255-259.
- Chhatwal J, Verma M, Rair SK. Obesity among preadolescent and adolescents of a developing country (India). Asia Pac J Clin Nutr 2004; 13: 231-235.
- http://www.cdc.gov/growthcharts
- Sharma A, Sharma K, Mathur KP. Growth pattern and prevalence of obesity among affluent school children in Delhi. Public Health Nutr 2007; 10: 485-491.
- Bose K, Bisai S, Mukhopadhyay A, et al. Overweight and obesity among affluent Bengalee school girls of Lake Town, Kolkata, India. Matern Child Nutr 2007; 3: 141-145.
- Berenson GS, Srinivasan SR, Wattigney WA, et al. Obesity and cardiovascular risk in children. Ann NY Acad Sci 1993; 699: 93-103.
- Berenson GS, Srinivasan SR, Bao W, et al. Association between multiple cardiovascular risk factors and athero-sclerosis in children and young adults. The Bogalusa heart study. New Engl J Med 1998; 338: 1650-1656.
- Mahoney LT, Burns TL, Stanford W. Coronary risk factors measured in childhood and young adult life are associated with coronary artery calcification in young adults: the Muscatine study. J Am Coll Cardiol 1996; 27: 277-284
- 11.Baker JL, Olsen LW, Sorensen TI. Childhood body-mass index and the risk of coronary heart disease in adulthood. N Engl J Med 2007; 357: 2329-2337.
- Bibbins-Domingo K, Coxson P, Pletcher MJ, et al. Adolescent overweight and future adult coronary heart disease. N Engl J Med 2007; 357: 2371-2379.
- Lim SS, Vos T, Flaxman AD, et al. A comparative risk assessment of burden of disease and injury attributable to 67 risk factors and risk factor clusters in 21 regions, 1990-2010: A systematic analysis for the Global Burden of Disease Study 2010. Lancet 2012; 380: 2224-2260.
- World Health Organization Consultation on Obesity. Obesity: Preventing and Managing the Global Epidemic. Geneva, Switzerland: Division of Non Communicable Diseases, Program of Nutrition, Family and Reproductive Health, World Health Organization 1998.
- Chouraki V, Wagner A, Ferrie`res J, et al. Smoking habits, waist circumference and coronary artery disease risk relationship: the PRIME study. Eur J Cardiovasc Prev Rehabil 2008; 15: 625-630.
- Connolly BS, Barnett C, Vogt K, et al. A meta-analysis of published literature on waist-to-hip ratio and risk of breast cancer. Nutr Cancer 2002; 44: 127-138.
- Katzmarzyk PT, Tremblay A, Pérusse L, et al. The utility of the international child and adolescent overweight guidelines for predicting coronary heart disease risk factors. J Clin Epidemiol 2003; 56: 456-462.
- Kawada T. Body mass index is a good predictor of hypertension and hyperlipidemia in a rural Japanese population. Int J Obes Relat Metab Disord 2002; 26: 725-729.
- Nemesure B, Wu SY, Hennis A, et al. The relationship of body mass index and waist-hip ratio on the 9-year incidence of diabetes and hypertension in a predominantly African-origin population. Ann Epidemiol 2008; 18:657-663.
- Nguyen TT, Adair LS, He K, et al. Optimal cut-off values for overweight: using body mass index to predict incidence of hypertension in 18- to 65-year-old Chinese adults. J Nutr 2008; 138: 1377-1382.
- Pang W, Sun Z, Zheng L, et al. Body mass index and the prevalence of prehypertension and hypertension in a Chinese rural population. Intern Med 2008; 47: 893-897.
- Shuger SL, Sui X, Church TS, et al. Body mass index as a predictor of hypertension incidence among initially healthy normotensive women. Am J Hypertens 2008; 21: 613-619.
- Chei CL, Iso H, Yamagishi K, et al. Body fat distribution and the risk of hypertension and diabetes among Japanese men and women. Hypertens Res 2008; 31: 851-857.
- National Institutes of Health (NIH). National Heart, Lung and Blood Institute. Obesity Education Initiative Expert Panel. Clinical guidelines on the identification, evaluation and treatment of overweight and obesity in adults ? The evidence report. Obes Res 1998; 6: 51S-209S.
- Katzmarzyk PT, Sathanur R, Srinivasan WC, et al. Body mass index, waist circumference and clustering of cardiovascular disease risk factors in a biracial sample of children and adolescents. Pediatrics 2004; 114: 198-205
- Hansen ML, Gunn PW, Kaelber DC. Under diagnosis of hypertension in children and adolescents. JAMA 2007; 298: 874-879.
- Lane DA, Gill P. Ethnicity and tracking blood pressure in children. J Human Hypertension 2004; 18: 223-228.
- Khadilkar VV, Khadilkar AV, Borade AB, et al. Body mass index cut-offs for screening for childhood overweight and obesity in Indian children. Indian Pediatr 2012; 49: 29-34.
- Vague J.The degree of masculine differentiation of obesities: A factor determining predisposition to diabetes, atherosclerosis, gout and uric calculus disease. Am J Clin Nutr 1956; 4: 20-34.
- Sicree R, Shaw J, Zimmet P. Diabetes and impaired glucose tolerance. In: Gan D, editor. Diabetes Atlas. International Diabetes Federation. 3rd ed. Belgium: International Diabetes Federation 2006: 15-103.
- Mohan V, Sandeep R, Shah DB, et al. Epidemiology of type 2 diabetes: Indian scenario. Indian J Med Res 2007; 125: 217-230.
- Narayanappa D, Rajani HS, Mahendrappa KB, et al. Prevalence of prediabetes in School Going Children. Indian Pediatr 2010; 48: 295-299.
- Mushtaq MU, Gull S, Abdullah HM, et al. Waist circumference, waist-hip ratio and waist-height ratio percentiles and central obesity among Pakistani children aged five to twelve years. BMC Pediatrics 2011; 11: 105.
- Ramachandran A, Snehalatha C, Satyavani K, et al. Type 2 diabetes in Asian Indian urban children. Diabetes Care 2003; 26: 1022-1025.
- Ramachandran A. Diabetes and Obesity. The Indian angle. Indian J Med Res 2004; 120: 437-439.
- Verma M, Chhatwal J, George SM. Obesity and hypertension in children. Indian Pediatr 1994; 31: 1065-1069.
- Anand NK, Tandon L. Prevalence of hyper-tension in school going children. Indian Pediatr 1996; 33: 376-380.
- Macedo ME, Lima MJ, Silva AO, et al. Prevalence, awareness, treatment and control of hypertension in Portugal: The PAP study. Rev Port Cardiol 2007; 26: 21-39.
- Sorof J, Daniels S. Obesity hypertension in children: A problem of epidemic proportions. Hypertension 2002; 40: 441-447.
- Chadha SL, Tandon R, Shekhawat S, et al. An epidemiological study of blood pressure in school children (514 years) in Delhi. Indian Heart J 1999; 51: 178-182.
- 41.Moussa MA, Skaik MB, Selwanes SB, et al. Contribution of body fat and fat pattern to blood pressure level in school children. Eur J Clin Nutr 1994; 48: 587-590.
- 42.Gupta AK. Childhood obesity and hypertension. Indian Pediatr 1990; 27: 333-337.
