Research Article - International Journal of Pure and Applied Zoology (2018) Volume 6, Issue 2
BLOOD GROUPS DISTRIBUTION PATTERN AMONG LIMITED ADULT HUMAN POPULATION OF DISTRICT GILGIT, GILGIT-BALTISTAN, PAKISTAN
Iftikhar Hussain1*, Arif-un-Nisa Naqvi1, Saira Amir2, Ghulam Abbas2 and Qayaim Mehdi2
1Department of Biological Sciences Karakorum International University Gilgit-Baltistan, Pakistan
2Department of Bio Sciences Comsats Institute of Information Technology, Islamabad, Pakistan
- *Corresponding Author:
- Mbamalu ON
Department of Biological Sciences Karakorum International University Gilgit-Baltistan, Pakistan
Tel: +27219593229/2190
Fax: +278615107002
E-mail: ombamalu@uwc.ac.za
Received 15th March 2018; Accepted 24th July, 2018; Published 31st July, 2018
Abstract
The study was carried to find out the distributional pattern of blood groups of a random population samples from the area of Danyore and Gilgit, Pakistan. The blood samples were taken randomly from population .This study is aimed to determine and find significance valve of blood groups with gender and location. The total of 150 limited blood groups were taken and studied, comprising by 56 males population (37.4%) and 94 females population (62.6%). Among 08 blood groups A+ve has highest count in the total of 150 Population of district Gilgit while Blood Group B-ve and AB-ve has least. The total number of observation for Blood Group A+ve were 34 (22.7%), among these 8 was males and remaining 26 females. This shows that among A+ve Blood Group female were dominate as camper to male. The total number of observation for the Blood Group A-ve were 24 (16%),among these 13 were male and 11 were females. The number of observation for the Blood group B+ve were 28 (18.7%), among these 12 was males and 16 were females. The total number of observation for the Blood Group B-ve were 7 (4.7%),among these 5 were male and only 2 were females whereas the mean number of investigated for the Blood Group AB+ve were 21 (14%), among these 7 were male and 14 were females. The total numbers of the observation for the Blood Group AB-ve were 8 (5.2%), among these studied individual 3 were male and 5 were females. The total number of observation for the Blood Group O+ve were 18 (12%) among these 5 were males and remaining 13 were females similarly the mean observation for the Blood Group O-ve were 10 (6.7%) among these 3 were males and 7 were females.
Keywords
Blood; Blood grouping; Human population; District gilgit
Introduction
To study blood groups in the population is very difficult job because there is about 7.046 billion of world population (reported in 2012) and every human have different blood groups (Hoshi, 2008).The allelic frequencies of ABO groups have been reported for many populations of the world, including Iraq, Saudi Arabia, India and Pakistan (Bhatti, 2004). The ABO blood groups systems are the first recognized human polymorphisms at the molecular level. These polymorphisms have been extensively used as genetic markers to study population characters. They also employed in the anthropological studies to appreciate differences between ethnic groups as well as for forensic purpose (Khalid and Qureshi, 2006).
Since 1901, more than 20 distinct blood group systems have been characterized but the ABO and RH blood groups the most important clinically, The distribution of these two blood groups have been repeatedly investigated in various human population in all over the locations of the world during last century. The most important thing is that the frequencies exhibit the considerable variations in different geographic location, reflecting the underlying genetic and ethnic diversity in human populations It is therefore very most important to record and document the different frequencies of ABO and RH blood groups in the different geographical regions of the Pakistan (Aness and jawed, 2011).
The ABO blood group is the one of the most important among the 30 blood group systems. After the discovery of ABO antigens on red blood cells from serological differences in human blood by Landsteiner in 1900, the ABO blood group was classified into four antigens (A, B, O, and AB) and six genotypes (A/A, A/O, B/B, B/O, O/O, and A/B) in 1924 (Aki et al., 2014).
The blood plays more roles than one might expect, it is involved in respiration, nutrition, waste elimination, thermoregulation, immune defense, water and acid-base balance, and internal communication (Atire, 2015). There are four basic blood groups found in human population named blood group A, B, AB and O. Human body carries about 4-6 liter blood in it which is made up of red blood cells, white blood cells and platelets in a liquid called plasma is 90% water but contain proteins, hormones and waste products. Blood is made up of 60% plasma and 40% blood cells.
Many diseases and genetic disorders are associated with ABO and Rh systems of blood antigens.
The importance of ABO cannot be over ruled in blood transfusion and in some cases in paternity assessment. Like ABO system, Rhesus antigen (afterward called as Rh antigen) is also equally significant in terms of clinical blood transfusion or tissue transplant (Ahmed, 2015). The diseases like duodenal ulcer, urinary tract infection and diabetes have some association of incompatibility of newborn babies. It is most common that all humans share the same blood groups systems but can differ in the frequencies with special respect of their types. Even in Pakistan there are some variations in different areas reflecting the racial differences, evolution, their relationship to different disease and environment is being increasingly sought in modern medicine.
A Blood type is the Classification of blood which is based on the presence or absence of inherited antigenic substances on the surface of red blood cells(RBCs).The inherited antigenic substances are may be proteins, carbohydrates, glycoprotreins or glycolipids.
According to International Society of Blood Transfusion (ISBT), a Total of 35 human blood groups are now recognized and out of these 35 human blood groups there are two important onces which are ABO and RH factor. The ABO blood group system determine the different blood groups in Human population and these different blood groups are A,B,AB and O while RH factor determine the positive, negative or null status of different human blood groups.
Materials and Methods
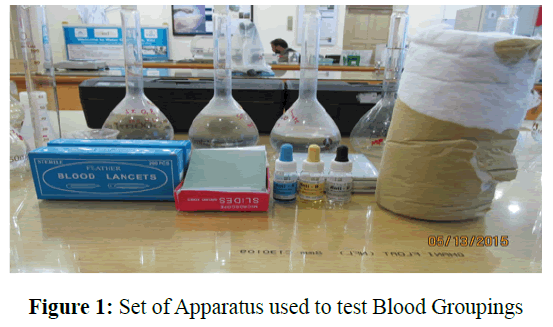
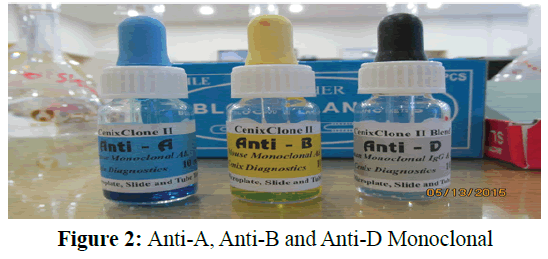
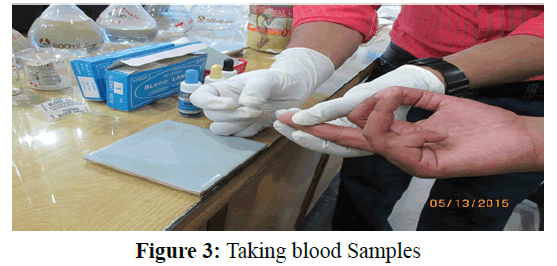
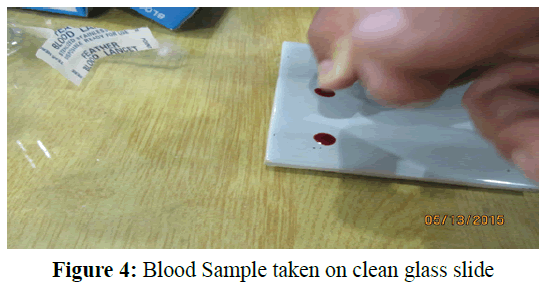
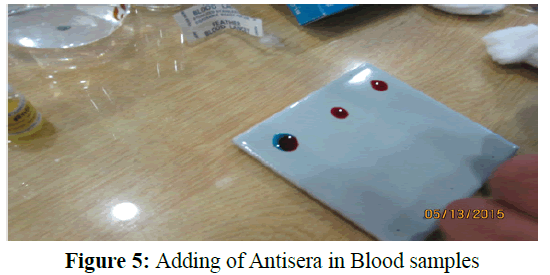
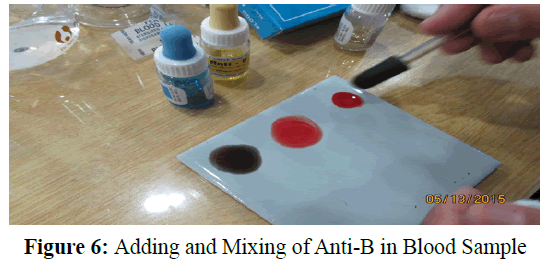
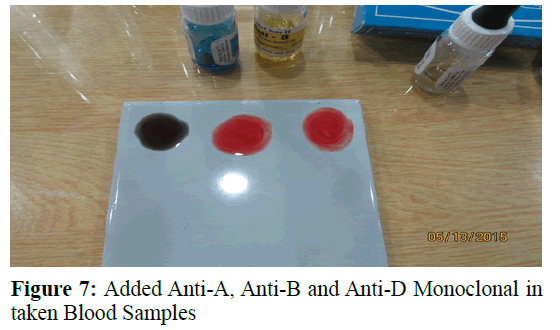
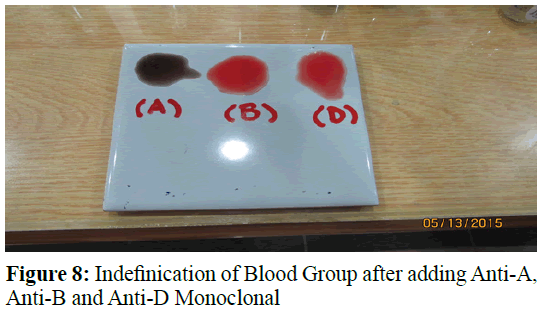
Blood samples were collected by finger prick and the ABO blood grouping will be done by agglutination test using anti-A, anti-B and anti-D human sera (Amin-Ud-Din et al., 2004). The ABO blood groups are determined by the presence of A and B antigens on the surface of red blood cells and anti-A or anti-B antibodies in the serum. Red blood cells of blood type A possess antigen A and serum containing anti-B antibody and similar anti-B has antigen B and antibody A. Blood group AB contains both A and B antigens but no antibodies. Blood group O has no antigens but contains both A and B antibodies. (Hosoi, 2008). For Blood grouping test we need following materials like Blood group set. Frist of all we wash middle finger with the help of mentholated swap then prick the middle finger with the help of sterile disposal lancet and placed the drop of blood on the label glass slides then add the anti-A serum on the label drop A, Anti-B serum, on label B and Anti-D serum on label drop D. Mix the samples with the help of wooden stick aseptically and observed the agglutination and decided blood groups according to ABO blood groups (Figure 1-8).
Results
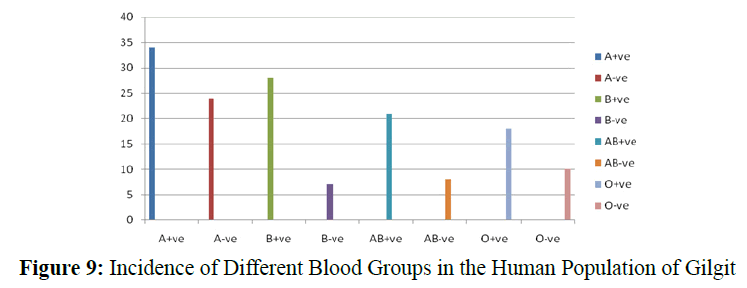
In the present study Blood Groups was studied in the Human Population of Gilgit and found the A+ve has highest count in the total of 150 Human Population of Gilgit while Blood Group B-ve and AB-ve has least. The results showed that the Blood Group A+ve were 34,Blood Group A-ve were 24, Blood group B+ve were 28, Blood Group B-ve were 7, Blood Group AB+ve were 21, Blood Group AB-ve were 8, Blood Group O+ve were 18 and Blood Group O-ve were 10 (Table 1).
| Blood Groups | A+ve | A-ve | B+ve | B-ve | AB+ve | AB-ve | O+ve | O-ve | Total |
|---|---|---|---|---|---|---|---|---|---|
| 34 (22.70%) | 24 (16%) | 28 (18.70%) | 7 (4.70%) | 21 (14%) | 8 (5.20%) | 18 (12%) | 10 (6.70%) | 150 |
Table 1: Overall Blood Groups in the Human Population of Gilgit.
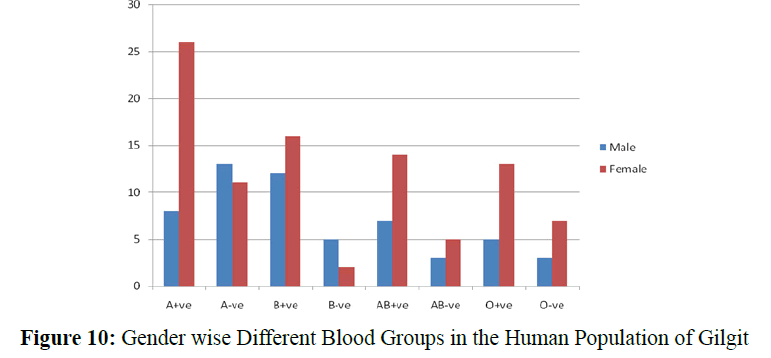
In the present Study the total number of observation for Blood Group A+ve were 34 (22.7%), among these 8 was males and remaining 26 females. This shows that among A+ve Blood Group female were dominate as camper to male. The total number of observation for the Blood Group A-ve were 24 (16%),among these 13 were male and 11 were females (Figure 9). The number of observation for the Blood group B+ve were 28 (18.7%), among these 12 was males and 16 were females (Table 1.1). The total number of observation for the Blood Group B-ve were 7 (4.7%),among these 5 were male and only 2 were females whereas the mean number of investigated for the Blood Group AB+ve were 21 (14%), among these 7 were male and 14 were females (Table 1.2). The total numbers of the observation for the Blood Group AB-ve were 8 (5.2%), among these studied individual 3 were male and 5 were females. The total number of observation for the Blood Group O+ve were 18 (12%) among these 5 were males and remaining 13 were females similarly the mean observation for the Blood Group O-ve were 10 (6.7%) among these 3 were males and 7 were females (Figure 10).
| Blood Groups | A+ve | A-ve | B+ve | B-ve | AB+ve | AB-ve | O+ve | O-ve | Total |
|---|---|---|---|---|---|---|---|---|---|
| Male | 8 | 13 | 12 | 5 | 7 | 3 | 5 | 3 | 56 |
| Female | 26 | 11 | 16 | 2 | 14 | 5 | 13 | 7 | 94 |
| Total | 34 (22.70%) | 24 (16%) | 28 (18.70%) | 7 (4.70%) | 21 (14%) | 8 (5.20%) | 18 (12%) | 10 (6.70%) | 150 |
Table 1.1: Percentage of Different Blood Groups within the population of Gilgit and Danyore
| Gender | Total | ||||
|---|---|---|---|---|---|
| Male | Female | ||||
| Blood groups | A+ve | Count | 8 | 26 | 34(22.70%) |
| Expected Count | 12.7 | 21.3 | 34 | ||
| A-ve | Count | 13 | 11 | 24(16%) | |
| Expected Count | 9 | 15 | 24 | ||
| B+ve | Count | 12 | 16 | 28(18.70%) | |
| Expected Count | 10.5 | 17.5 | 28 | ||
| B-ve | Count | 5 | 2 | 7(4.70%) | |
| Expected Count | 2.6 | 4.4 | 7 | ||
| AB+ve | Count | 7 | 14 | 21(14%) | |
| Expected Count | 7.8 | 13.2 | 21 | ||
| AB-ve | Count | 3 | 5 | 8(5.20) | |
| Expected Count | 3 | 5 | 8 | ||
| O+ve | Count | 5 | 13 | 18(12%) | |
| Expected Count | 6.7 | 11.3 | 18 | ||
| O-ve | Count | 3 | 7 | 10(6.70%) | |
| Expected Count | 3.7 | 6.3 | 10 | ||
| Total | Count | 56 | 94 | 150 | |
| Expected Count | 56 | 94 | 150 | ||
Table 1.2: Cross tab Analysis of Different Blood Groups with Gender
The data shows the eight Blood Groups of 56 Male respondents and 94 Female respondents. Is there is a relationship between the Blood Groups of the samples with Gender (Male and female) at the significance level of 0.05. By using Chi square test the calculated value 10.595 with degree of freedom 7. The tabulated value of chi-Square at degree of freedom 7 is 14.067 and the tabulated value of Chi-Square is greater than the calculated value i.e. 10.05. Therefore we conclude that there is no relationship between Blood Groups and Gender. The results showed that the female has the highest A+ve Blood Group and the Blood Groups which are slightly decreasing are B+ve, AB+ve. However Females have least B-ve Blood Group in Danyore. On the other hand, Male has highest A-ve Blood Group and has least been O-ve and AB-ve Blood Group.
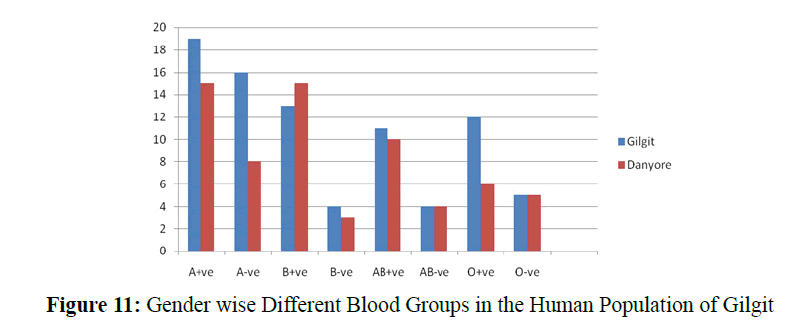
The total Observed number of Gilgit population is 84,among theses 84 individuals 19 was A+ve,16was A-ve,13 was B+ve,4 was B-ve,11was AB+ve,4were AB-ve,12 was O+ve and only 5 was O-ve Blood Group Individuals. The total Studied number of Danyore is population is 66, among theses 66 individuals 15 was A+ve, 8 was A-ve,15 was B+ve, 3 was B-ve,10 was AB+ve,4 were AB-ve, 6 was O+ve and only 5 was O-ve Blood Group Individuals. The total of 150 samples from the cities Danyore and Gilgit (Table 1.3). The data shows the eight Blood Groups of 56 Male and 94 Female respondents. There is a relationship between the Blood Groups of the samples with Location (Gilgit and Danyore) at the significance level of 0.05 (Table 1.4). By using Chi square test the calculated value 3.359 with degree of freedom 7 and the tabulated value of chi-Square at degree of freedom 7 is 14.067. This tabulated value of Chi-Square is greater than the calculated value i.e. 3.359. Therefore we conclude that there is no relationship between blood groups and Location (Figure 11).
| Value | Df | Asymp. Sig. (2-sided) | |
|---|---|---|---|
| Pearson Chi-Square | 10.595a | 7 | 0.157 |
| Likelihood Ratio | 10.582 | 7 | 0.158 |
| Linear-by-Linear Association | 0.107 | 1 | 0.744 |
| N of Valid Cases | 150 | ||
| a.4cells(25.0%)have expected count less than 5.The min. expected count is 2.61 | |||
Table 1.3: Distribution of Different Blood Group Individuals within the Human Population of Gilgit and Danyore
| Blood groups * Location Crosstabulation | ||||
|---|---|---|---|---|
| Count | ||||
| Location | Total | |||
| Danyore | Gilgit | |||
| Blood groups | A+ve | 15 | 19 | 34(22.70%) |
| A-ve | 8 | 16 | 24(16%) | |
| B+ve | 15 | 13 | 28(18.70%) | |
| B-ve | 3 | 4 | 7(4.70%) | |
| AB+ve | 10 | 11 | 21(14%) | |
| AB-ve | 4 | 4 | 8(5.20%) | |
| O+ve | 6 | 12 | 18(12%) | |
| O-ve | 5 | 5 | 10(6.70%) | |
| Total | 66 | 84 | 150 | |
| Chi-Square Tests | ||||
| Value | Df | Asymp. Sig. (2-sided) | ||
| Pearson Chi-Square | 3.359a | 7 | 0.85 | |
| Likelihood Ratio | 3.398 | 7 | 0.846 | |
| Linear-by-Linear Association | 0.002 | 1 | 0.961 | |
| N of Valid Cases | 150 | |||
| a. 5 cells (31.3%) have expected count less than 5. The minimum expected count is 3.08. | ||||
Table 1.4: Cross tab Analysis of Different Blood Groups with Locations
The result indicates that in both cities (Danyore and Gilgit) the highest Blood Group is A+ve. The Blood Groups slightly decreasing are A-ve, B+ve, AB+ve and so on. The B-ve Blood Group is the least Blood group.
Discussion
This study addressed and provides the baseline information of blood groups of district Gilgit. In study It is found that the Blood Group A+ve were 22.7%, A-ve were 16%, B+ve were 18.7%, B-ve were 4.7%, AB+ve were 14%, AB-ve were 5.2%, O+ve were 12% and O-ve were only 6.7%. From the study the distribution of blood group A+ve was the highest percentage frequency of 22.7% and the least percentage frequency is that of blood group B-ve with the lowest percentage of 4.7% in all areas of district Gilgit. In males population the blood group A-ve were seen dominant in all study areas while blood group B+ve count the highest percentage in female population.
Landsteiner was the first men in 1901 who discovered the ABO blood groups and afterward the Rhesus antigen (Rh factor) was discovered by wiener and Landsteiner in 1941. So far, atleast 400 antigens associated with erythrocytes have been discovered and many of these are transmitted to nest generation as Mendlian traits.
In modern era, apart from blood transfusion the blood antigen have been established to correlation with certain health issues. For example, the individuals with blood group O are more vulnerable to gastric and duodenal ulcer. The human being all over the world possesses varying frequencies of ABO and Rh antigen at regional, and population level (Ahmad, 2015).
Blood groups and Rh antigen are hereditary. Gene for ABO antigen is on the 9th chromosome and Rh antigen gene is on the 1st chromosome. The ABO blood group and the Rhesus factor or Rh blood group are two of the most notable type groups in humans due to their importance and association with blood transfusion. The blood groups may have some association with diseases like duodenal ulcer, diabetes mellitus, and urinary tract infection. Knowledge of the distribution of ABO and Rh blood groups among any population is useful in health care planning and appropriate allocation of resources, while counseling targeted at appropriate persons ensures the general wellbeing of the individuals or people.
Conclusion
This present study is the first documented report which provide the comprehensive and baseline information of the genetic diversity of district Gilgit. The study presents the importance of ABO blood groups in limited human population of district Gilgit, Pakistan. Knowledge of the distribution of ABO groups among any population is useful in health care planning and appropriate allocation of resources, while counseling targeted at appropriate persons ensures the general wellbeing of the individuals or people.
References
- Ahmed, S. 2015. Prevalence frequency of ABO and Rhesus blood groups in human in district of Rahim Yar Khan, Pakistan. Am. J. Bio. Sci. 3: 141-144.
- Aki, K., Kawazoe, K., Tada, T., Minakuchik, K., Hosoie, E. 2014. Direct Determination of ABO blood groups genotype from whole blood using PCR-Amplification of specific alleles method. Am. J. Bio. Sci. 2: 49-55.
- Amin, A.U.D.A. 2007. Study of certain aspects of human genetics including consanguinity and genetic disorders in human population of DG khan.eprint.hec.govt.pk/4743.
- Aness, M. and Jawad, A. 2011. Distribution of ABO and Rh blood groups alleles in sahiwal district of the Punjab, Pakistan. Pakistan Academy of Sciences 48: 39-43.
- Atire, A.F. 2015. Distribution of ABO and Rh blood groups among students of some Ethnic groups at Dilla University Ethiopia. Int. J. Gent. and Geno. 3: 8.
- Bhatti, R. 2004. Distribution of ABO and Rhesus Blood alleles in a strict endogamous sub-tribe of lower sindh (Pakistan): setharani (tribe: Noohani). Pak. J. Zoo. 36:125-128.
- Hosoi, E. 2008. Biological and Clinical aspects of ABO blood groups. J. med. Invest. 55: 174-182.
- Khalid, M. and Qureshi, M.A. 2006. Frequencies of blood groups antigens and corresponding alleles in the population of mirpur. azad Jammu Kashmir, Pakistan. J. Anim. Pl. Sci. 16: 3-4.
