Research Article - Biomedical Research (2017) Volume 28, Issue 1
Assessment of right ventricular contraction by speckle tracking echocardiography in pulmonary hypertension patients
Yudong Peng, Wei Xu*
Department of Ultrasound, the First Affiliated Hospital of Yangtze University, Jingzhou, PR China
- *Corresponding Author:
- Wei Xu
Department of Ultrasound
the First Affiliated Hospital of Yangtze University
Hangkong road, Jingzhou PR China
E-mail: xuwei700919@sina.com
Accepted on May 12, 2016
Abstract
Background: This study aimed to assess the feasibility and reproducibility of right ventricular (RV) contraction in the circumferential direction in pulmonary hypertension (PH) patients by speckle tracking echocardiography, and evaluate the correlation between RV circumferential strain (CS) and RV 2D parameters such as fractional area change (FAC) and tricuspid annular plane systolic excursion (TAPSE).
Methods: Total 30 patients diagnosed with PH and 20 healthy volunteers were included. Echocardiography was performed. RVCS at 9 segments were quantified and their relationship with RVFAC and TAPSE was investigated.
Results: Peak systolic CS was significantly reduced at the anterior wall, lateral wall, inferior wall in the basal level and lateral wall in the middle level in PH patients compared to healthy volunteers, peak CS at the free wall in the basal level and lateral wall in the middle level showed a modest correlation with RVFAC and TAPSE.
Conclusions: RVCS measured by speckle tracking echocardiography is a feasible and reliable technique for rapid quantification of RV regional function. RV contraction in the circumferential direction is significantly reduced at the free wall in the basal level and the lateral wall in the middle level in PH patients.
Keywords
Echocardiography, Speckle tracking, Pulmonary hypertension, Right ventricular, Contraction
Introduction
Pulmonary hypertension (PH) has been the main cause of right ventricular (RV) failure and may lead to final respiratory failure. PH has become a major cardiovascular disease [1]. There are numerous reports on evaluating RV contraction in the longitudinal direction using speckle tracking echocardiography and how to use longitudinal strain (LS) as a marker to detect early deterioration of RV performance [2]. Recent study showed that measuring RV circumferential strain (CS) using magnetic resonance imaging provided an objective color-coded evaluation of not only longitudinal but also circumferential regional myocardial strains, but it simply divided RV free wall into 3 segments [3]. Up to now there is still no method of systematic measurements of RVCS using echocardiographywhich would provide additional insights into RV function assessment. The aim of this study was to explore whether the regional CS at the RV free wall can be used to identify global RV dysfunction and the correlation with RV fractional area change (FAC) and tricuspid annular plane systolic excursion (TAPSE) among PH patients and healthy controls.
Materials and Methods
Study populations
The study protocol was approved by Ethics Committee of the first affiliated hospital of Yangtze University and all participants gave written informed consent. A total of 20 healthy volunteers were enrolled in this study, they included 12 females and mean age ± standard deviation (SD) was 48 ± 13 years. Exclusion criteria included any evidence suggestive of hypertension, rheumatic disease, diabetes mellitus, heart disease, chest disease, and history of smoking (Table 1). A total of 30 patients diagnosed as PH were enrolled in this study. They included 19 females and their mean pulmonary artery pressure (mPAP) ± SD was 47.4 ± 10. 2 mmHg and mean age ± SD was 52 ± 15 years. 4 patients had a final diagnosis of idiopathic pulmonary arterial hypertension and 21 were associated with connective tissue diseases, the rest were diagnosed as chronic obstructive pulmonary disease. Most patients were from World Health Organization functional class (WHO) groups I (3%), II (30%), or III (53%), with the remainder from group IV. Clinical parameters of PH patients were summarized in Table 1. Approximately 80% of all patients were medically treated for PH at enrollment. All patients underwent echocardiography and right heart catheterization (RHC) within 3 days interval under clinically stable condition. They were preliminarily diagnosed as PH by transthoracic echocardiograpy and then confirmed by RHC. Mean pulmonary artery pressure (PAP) ≥ 25 mmHg evaluated by RHC was used as entry criteria [4]. Exclusion criteria were: (1) inability to obtain adequate 2D image quality. (2) suffer from left heart diseases that may affect RV geometrical morphology. (3) Arrhythmia which may affect the image analysis (Table 1).
| Volunteers | PH patients | P | |
|---|---|---|---|
| N | 20 | 30 | |
| Gender (F/M) | 60% | 63% | 0.934 |
| Age (years) | 43±13 | 47 ± 15 | 0.336 |
| Height (cm) | 164.7 ± 8.5 | 163.0 ± 6.7 | 0.434 |
| Weight (kg) | 57.1 ± 8.1 | 56.5 ± 14.1 | 0.864 |
| BSA | 1.62 ± 0.2 | 1.60 ± 0.3 | 0.795 |
| LV diameter (mm) | 43.5 ± 6.3 | 41.2 ± 7.5 | 0.264 |
| RV diameter (mm) | 21.6 ± 6.1 | 25.7 ± 7.2 | 0.042 |
| LV ejection fraction(%) | 63.7±7.1 | 64.6 ± 6.5 | 0.646 |
| RV FAC(%) | 52.3 ± 9.9 | 44.7 ± 8.1 | 0.005 |
| TAPSE(mm) | 20.4 ± 4.8 | 16.9 ± 4.6 | 0.013 |
| Mean pulmonary artery pressure | — | 48.6 ± 11.6 |
Values are presented as means±standard deviation.
Table 1. General information of the participants, Values are presented as means ± standard deviation.
Methods
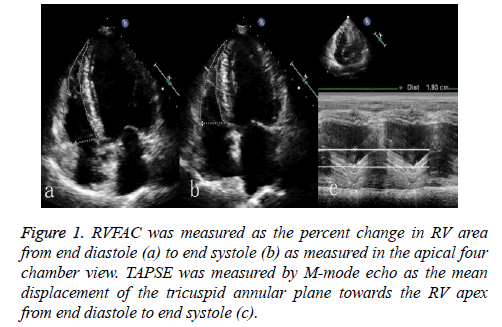
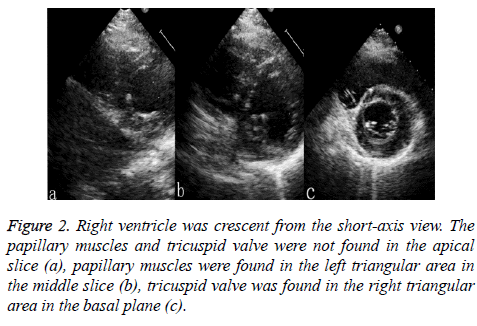
Imaging was performed using ultrasonocardiograph IE33 (Philips Medical Systems, Bothell, WA, USA) equipped with probe S5-1 (frequency ranges from 1 to 5 MHz). The frame rate was set between 60 and 80 frames per second. It is recommended to combine temporal resolution with adequate spatial definition, and to enhance the feasibility of the frameto- frame tracking technique. Vector electrocardiogram was used for R-wave triggering. All patients were examined in left lateral decubitus. First, the detector was placed at the apex to obtain the apical four-chamber view, FAC was calculated according to the formula (Figure 1), and the distance between the end-diastolic and end-systolic was represented by TAPSE. Then the detector was placed at the left of the sternum to obtain the parasternal short-axis view of RV (Figure 2). The two-dimensional images of three continual cardiac cycles were recorded and inputted into the QLAB 9.0 work station (Philips Medical Systems, Bothell, WA, USA).
Figure 2: Right ventricle was crescent from the short-axis view. The papillary muscles and tricuspid valve were not found in the apical slice (a), papillary muscles were found in the left triangular area in the middle slice (b), tricuspid valve was found in the right triangular area in the basal plane (c).
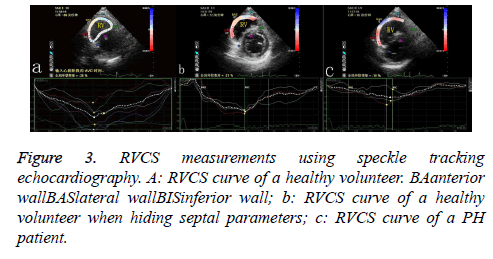
Continuous images were then processed by using Tissue Motion Quantification Software Package to calculate the left ventricular CS. The RV was divided into free wall and interventricular septum, and free wall was further divided into anterior wall, lateral wall and inferior wall (Figure 3). A region of interest was traced on the endocardium and epicardium at end-diastole in the right ventricle from the short-axis view using a point-and-click approach. Special care was taken to fine-tune the region of interest, using visual assessment during cine loop playback, to ensure that segments were tracked appropriately. After the input of the time value (millisecond) of AVO (aortic valve opened) and AVC (aortic valve closed), the package automatically tracked their trajectory and acquired the segmental CS curve.
Statistical analysis
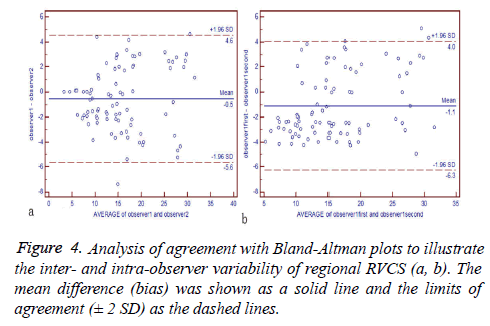
Statistical analysis was performed using MedCalc statistical software package (release 10.0.2.0; MedCalc, Mariakerke, Belgium). Data were presented as mean ± SD. Pearson's correlation coefficient analyses were used to assess the relationship between all CS values and FAC and TAPSE. RV strain measurements in healthy volunteers were compared to the corresponding segments in PH patients using two independent samples t test. P<0.05 was considered significant difference. Inter- and intraobserver variability of CS measurements was calculated by a blinded repeated analysis of 5 cases from each group, i.e., volunteers and patients. The rereads were separated by 4 weeks from the initial reading to avoid recall bias. The Bland-Altman analysis was used to test the variability between the two observers and repeated studies.
Results
Characteristics of the study population
We found no significant differences between 30 PH patients and 20 volunteers with respect to the age (PH 52 ± 15 years vs. Control 48 ± 13 years; p=0.34) and gender (PH 63% female vs. Control 60% female; p=0.93).
A total of 450 segments of 20 volunteers and 30 PH patients were assessed for regional CS analysis using speckle tracking echocardiography. 23 segments (5.1%) were excluded from the study due to suboptimal image quality. The RVCS curve was negatively peaked in PH group and control group, indicating that the RV circumferential length is shortened at the systolic period. The peak CS appeared when the aortic valve closed in control group, while it appeared before the aortic valve closed in PH group. In PH patients and healthy volunteers, the peak CS of the RV free wall assessed by speckle tracking echocardiography was presented (Table 2). Compared to healthy volunteers, peak systolic CS was significantly reduced at the anterior walllateral wallinferior wall in the basal level and lateral wall in the middle level (P<0.05), whereas no significant differences were found in the remaining segments (Table 2).
| Parameters | Control group | PH group | P |
|---|---|---|---|
| CS bas aw (%) | -21.4±4.8 | -17.6± 3.6 | 0.004 |
| CS bas lw(%) | -21.0± 5.4 | -16.7± 4.4 | 0.004 |
| CS bas iw(%) | -21.9± 4.9 | -18.4± 4.0 | 0.010 |
| CS mid aw (%) | -21.2± 6.5 | -18.5± 5.2 | 0.118 |
| CS mid lw(%) | -21.5± 5.6 | -18.6± 3.8 | 0.047 |
| CS mid iw(%) | -20.9± 5.5 | -18.4± 4.6 | 0.091 |
| CS api aw (%) | -17.2± 4.2 | -17.4± 4.5 | 0.875 |
| CS apilw(%) | -17.8± 4.0 | -17.5± 5.2 | 0.828 |
| CS apiiw(%) | -18.1± 5.0 | -18.3± 4.7 | 0.886 |
Bas: Basal; Mid: Middle; Api: Apical; Aw: Anterior Wall; LW: Lateral Wall; IW: Inferior Wall
Table 2. Comparison of the parameters (%, . x ± s).
RV strains in relation to RV dysfunction
The peak CS at the free wall in the basal level and lateral wall in the middle level showed a modest correlation with RVFAC and TAPSE, the peak CS at anterior wall and inferior wall in middle level showed a weak correlation with RVFAC and TAPSE, while the peak CS at the apical level had no obvious correlation with RVFAC and TAPSE (Table 3).
| Parameters | RV FAC | TAPSE | ||
|---|---|---|---|---|
| r | p | r | p | |
| CS bas aw | -0.73 | 0.025 | -0.47 | 0.032 |
| CS bas lw | -0.72 | 0.029 | -0.52 | 0.027 |
| CS bas iw | -0.79 | 0.010 | -0.55 | 0.035 |
| CS mid aw | -0.32 | 0.029 | -0.34 | 0.021 |
| CS mid lw | -0.73 | 0.023 | -0.43 | 0.042 |
| CS mid iw | -0.36 | 0.034 | -0.32 | 0.045 |
| CS api aw | -0.23 | 0.242 | -0.16 | 0.186 |
| CS apilw | -0.19 | 0.159 | -0.09 | 0.165 |
| CS apiiw | -0.33 | 0.365 | -0.21 | 0.216 |
Table 3. CS correlation coefficients with RV FAC and TAPSE.
RV peak CS reproducibility
The inter- and intra-observer variability of all strain measurements was not statistically significant (Figure 4).
Discussion
PH is characterized by increased pulmonary artery pressure (PAP) ≥ 25 mmHg at rest, which leads to RV pressure overload, right heart failure, and ultimately premature death [5]. PH ranges from a rare idiopathic arterial hypertension (PAH) to mild elevations of pulmonary artery pressure commonly observed in association with respiratory and connective tissue diseases. Other causes of PH are congenital heart diseases. RV function is the primary determinant of prognosis in PH. RVFAC is regarded as an important index of systolic RV function [6]. RVFAC is the most commonly utilized echocardiographic 2D measure of RV function and it is correlated with MRI-derived RV ejection fraction [7]. For PH patients, it is important to acquire RV systolic function at the early stage. MRI, angiocardiography and other techniques measuring right ventricular volume are not widely used due to the prohibitive cost. Speckle tracking echocardiography can accurately evaluate RV deformation and gain the global and regional systolic function.
In this study, although patients with inadequate 2D image quality were excluded, there were still 23 segments included in the later image analysis. The application of speckle tracking echocardiography in the circumferential direction is limited by the image quality. Beyond that, it is a feasible, reproducible and time-efficient tool for the characterization of RV regional deformation. In this study we investigated the clinical utility of speckle tracking echocardiography to identify global RV dysfunction in PH. Regional peak CS at the free wall in the basal level and the lateral wall in the middle level showed modest correlations with FAC and TAPSE, the markers of global dysfunction. Previous studies have indicated that RV contraction differs considerably from the left ventricular (LV) contraction. Whereas LV blood ejection is accomplished by circumferential shortening, RV function is mainly achieved by the shortening of its free wall in the longitudinal direction. The reduction of the peak CS at the free wall in the basal level and lateral wall in the middle level in PH patients suggests that the peak CS could be a sign for RV dysfunction and may be used to monitor RV function in PH patients in clinical settings.
In control and PH groups, RVCS curves were negative, which means that RV is shortened in the circumferential direction at systolic period. The reduction in longitudinal and circumferential strains is a response to the increase of RV after load. Segmental peak RVLS values for patients with PH are decreased at three levels: base, mid, and apex [1]. In our study, compared with control group, the peak CS at the free wall in the basal level and lateral wall in the middle level in PH group decreased (P<0.05), which indicates that RV short-axis contractility was reduced in PH patients. Similar results were reported by Shehata et al. who used fast strain-encoded magnetic resonance imaging to demonstrate a decrease in RV circumferential contraction in the basal level in PH patients, but no differences in the middle and apical level [8]. In the normal RV, there was a predominantly longitudinal over circumferential free wall shortening. RV circumferential contraction is increased in the older people, which may be a compensatory response to the reduction of longitudinal function [9]. Not all segmental peaks CS were different between PH and control group in our study, suggesting a compensatory response to the reduction of longitudinal function of PH patients. RVCS can be used as a potential detector to distinguish the severe right ventricular dysfunction.
Our study has some limitations. First, the number of patients studied was relatively limited and the comparison in regional strain was conducted in nine segments for peak CS quantification. However, the purpose of this study was to compare the feasibility and reproducibility of speckle tracking echocardiography for the regional assessment of myocardial strain so that a number of 50 participants resulting in N=450 segments for peak CS assessment in total was considered appropriate for statistical analysis. Second, the present study did not allow for the evaluation of the diverse impacts of different disease stages or etiologies of PH. Further studies with controlled enrollment of patients with different stages and etiologies of PH need to be conducted to address this issue. Third, RVCS peak appeared early in the PH group, comparing strains in two groups at different time points may lead to a bias.
In summary, RVCS in PH patients and healthy volunteers can be quantitatively measured using speckle tracking echocardiography. RV contraction in the circumferential direction is significantly reduced at the free wall in the basal level and the lateral wall in the middle level in PH patients, which shows a modest correlation with global RV dysfunction. Strain measurement with speckle tracking echocardiography is clinically feasible and reproducible, and it could be a potential detector of the severity of PH in clinical practice.
References
- Calcutteea A, Lindqvist P, Soderberg S, Henein MY. Global and regional right ventricular dysfunction in pulmonary hypertension. Echocardiography 2014; 31:164-171.
- Brili S, Stamatopoulos I, Misailidou M. Longitudinal strain curves in the RV free wall differ in morphology in patients with pulmonary hypertension compared to controls. Int J Cardiol 2013; 167: 2753-2756.
- Hoeper MM, Barst RJ, Bourge RC. Imatinibmesylate as add-on therapy for pulmonary arterial hypertension: results of the randomized IMPRES study. Circulation 2013; 127: 1128-1138.
- McLaughlin VV, Archer SL, Badesch DB. ACCF/AHA 2009 expert consensus document on pulmonary hypertension. J Am CollCardiol 2009; 53: 1573-1619.
- McGoon MD, Kane GC. Pulmonary hypertension: diagnosis and management. Mayo Clinic Proceedings. 2009; 84: 191-207.
- Anavekar NS, Skali H, Bourgoun M. Usefulness of right ventricular fractional area change to predict death, heart failure, and stroke following myocardial infarction (from the VALIANT ECHO Study). AM J Cardiol 2008; 101: 607-612.
- Anavekar NS, Gerson D, Skali H, Kwong RY, Yucel EK, Solomon SD. Two-Dimensional Assessment of Right Ventricular Function: An Echocardiographic–MRI Correlative Study. Echocardiography 2007; 24: 452-456.
- Shehata ML, Basha TA, Tantawy WH, Lima JA. Real-time single-heartbeat fast strain-encoded imaging of right ventricular regional function: normal versus chronic pulmonary hypertension. MagnReson Med. 2010; 64:98-106.
- Kukulski T, Hubbert L, Arnold M, Wranne B, Hatle L, Sutherland GR. Normal regional right ventricular function and its change with age: a Doppler myocardial imaging study. J Am SocEchocardiogr 2000; 13:194-204.


