Research Article - Journal of Biomedical Imaging and Bioengineering (2019) Volume 3, Issue 1
Analyzing the impact of neuromarketing to promote brand image based on EEG signals
Hamed Hakkak*, Mohammad Mahdi Khalil Zade, Mahdi AzarnooshDepartment of Biomedical Engineering, Mashhad Branch, Islamic Azad University, Iran
- Corresponding Author:
- Hani M. Abd Elsalam
Department of Zoology Zagazig
University, Egypt
E-mail: hmmsama@hotmail.com
Accepted date: January 1, 2019
Citation: Hakkak H, Zade MMK, Azarnoosh M.. Analyzing the impact of neuromarketing to promote brand image based on EEG signals. J Biomed Imag Bioeng. 2019;3(1):95-105.
Abstract
Nervous marketing with the activation of the attention of individuals, subconsciously moves people's minds towards the advertised brand and neutralizes involuntary behaviors. This ability is essential for rational functions. In this study, the main goal is to see understandable changes in the EEG signal through exposure-free advertising, during the neurological marketing. Advertising is on a brand and tablet brand and is aimed at promoting a brand. In this regard, images of the logo of the brands are displayed in two stages in succession (between the two stages, the ad is displayed) and simultaneously, the brain signal is recorded. After the signal is prepared, features are extracted in three frequency, time-frequency and non-linear sections, and the optimal extraction algorithm and classification-based feature are characterized by the optimal characteristics and given to the classifier, in accordance with Objectives given to it determine which subject is in the classification. According to a questionnaire defined at the beginning and the end of the protocol, four classes are determined (positive effect of the advertisement, somewhat effective, neutral effect and negative impact). After reviewing the results, it became clear that advertisements had attracted more people's attention than advertised brands. After implementing the protocol and comparing the results of the questionnaire and the classifiers, the project was performed with an acceptable error of 4.78% (ann) and 8.37% (svm).
Keywords
Neuromarketing, Steganography, EEG Signal, Marketing, Classifications.
Introduction
During neuromarketing some changes occur in EEG signals that studying and analyzing them can yield to valuable information about performance of biological systems at the time of marketing . In the present study, the main question is whether the ads based on the influence of the subconscious during neuro-marketing cause understandable changes in electroencephalogram signals? Although many studies have been done separately about neuro-marketing, but at the same time none of them examined the brain signal behavioral pattern of people with processing engineering and its effect on a particular brand advertising effectiveness. Hence, an important innovation of this research is studying the steganography methods aimed at influencing on subconscious mind to advertise a brand in neuro-marketing. Neuro-marketing is understanding brain function without engaging in intricate details to use it to improve marketing operations. Neuromarketing is aim to better transmission of marketing messages and increase the likelihood of purchase by the audience.
Marketing research addressing the role of arousal in attitude formation and change mostly looks at arousal as a merely conscious emotion. However, a substantial body of research, in cognitive psychology and neuroscience, now offers insights on the implicit, subliminal reactions of individuals to external stimuli, sustaining that unconscious emotions may drive to different attitudinal responses. By employing electrodermal activity, a physiological measure, to assess unconscious arousal and self-reported scales to assess conscious arousal, the study reveals that conscious and unconscious arousal are two independent emotional responses and they influence attitude toward the product differently. The study extends theory on emotions and provides an initial step toward using physiological measures to evaluate consumer emotional response to new products [1].
There are different ways to measure the changes in the activity of different parts of the brain like functional magnetic resonance imaging (fMRI), EEG and steady state topography (SST), that these methods measure the activity of specific brain region. The above mentioned methods are used to evaluate the stimuli in different types of marketing such as visual (pictures / posters), audio (radio and music), audio and video (video) [2].
Conventional neuromarketing methods are mostly investigating the changes in the range of alfa and theta waves during visual stimuli. EEG signals taken from a subject in all the time. The obtained signal is pre-processed by using fast fourier transform (FFT) and Butterworth filter used to extract statical properties of alfa and theta waves. The extracted features are attributed to simple classification to determine the subject's behavior in brand advertising [2].
The neural mechanisms underlying conscious and unconscious visual processes remain controversial. Blindsight patients may process visual stimuli unconsciously despite their V1 lesion, promoting anatomical models, which suggest that pathways bypassing the V1 support unconscious vision. On the other hand, physiological models argue that the major geniculostriate pathway via V1 is involved in both unconscious and conscious vision, but in different time windows and in different types of neural activity. According to physiological models, feed forward activity via V1 to higher areas mediates unconscious processes whereas feedback loops of recurrent activity from higher areas back to V1 support conscious vision. With transcranial magnetic stimulation (TMS) it is possible to study the causal role of a brain region during specific time points in neurologically healthy participants. In the present study, measured unconscious processing with redundant target effect, a phenomenon where participants respond faster to two stimuli than one even when one of the stimuli is not consciously perceived. tested the physiological feed forward-feedback model of vision by suppressing conscious vision by interfering selectively either with early or later V1 activity with TMS. Our results show that early V1 activity (60 ms) is necessary for both unconscious and conscious vision. During later processing stages (90 ms), V1 contributes selectively to conscious vision. These findings support the feed forward-feedback-model of consciousness [3].
Visual attention is an important feature of human visual system. The brain filter out information and so enables eye to focus on specific areas of interest. Many biologically inspired algorithms to mimic the HVS interesting features are used for various applications. Although hidden motives are not consciously understandable but they can help people to understand the conscious behavior. Steganography is very important in the field of imaging and many articles discuss about its importance [4].
With widespread applications of 3D technology, measuring quality of experience (QoE) for 3D multimedia content plays an increasingly important role. In this paper, propose a full reference stereo image quality assessment (SIQA) framework which focuses on the innovation of binocular visual properties and applications of low-level features. On one hand, based on the fact that human visual system (HVS) understands an image mainly according to its low-level features, local phase and local amplitude extracted from phase congruency (PC) measurement are employed as primary features. Considering the less prominent performance of amplitude in IQA, visual saliency is applied into the modification on amplitude. On the other hand, by fully considering binocular rivalry phenomena, we create the cyclopean amplitude map and cyclopean phase map. With this method, both image features and binocular visual properties are mutually combined with each other. Meanwhile, a novel binocular modulation function in spatial domain is also adopted into the overall quality prediction of amplitude and phase. Extensive experiments demonstrate that the proposed framework achieves higher consistency with subjective tests than relevant SIQA metrics [5].
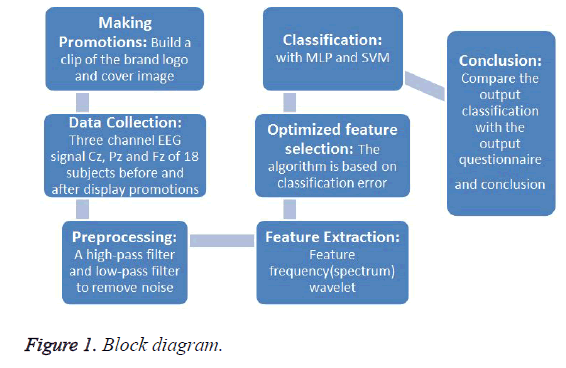
In this study, at Figure 1 first the clips containing brand promotion are made of famous photos and brand logo. After that 18 subject’s electroencephalogram signals while displaying images of three channels FZ, CZ and PZ were segmented in 2-seconds windows. Then after applying the filter and averaged signals, different characteristics of signals were extracted and the results in 3 above mentioned channels were determined y among them, those which were selected as the most appropriate features using a classifier based algorithm error, import to the neural network as optimal features to data is segregated in some classes. At last by examining changes before and after propaganda in classes and comparing it with the results of the questionnaire, we can conclude about ads effectiveness.
In the second part, a review of previous research on the neuromarketing and its psychological effects is presented. The third part is dedicated to data introduction, signal processing methods, introducing and explaining the extracted features, an algorithm for searching the most suitable feature set, neural network classification and grading standard questionnaire. Part four presents the result of EEG signal analysis during displaying ads and classification of subjects in different classes. In the fifth part, discussion about the results of this study and previous studies are discussed while some suggestions for future research in this field is presented.
Related Works
The study of history shows that most researches in the field of Neuromarketing are limited to aspects of valuation of brands or just comparing different ads. In general, most of these studies have not provided a way to advertise a brand.
Based on the studies have been done about neural imaging techniques in neuroscience, approximately 70% of the methodologies used functional magnetic resonance imaging (FMRI) while about 25% used brain electrical tomography (EEG) and just 5% pay attention to magnetic tomography (MIJ). In particular, when a high temporal resolution in television commercials processing is required from time to time, EEG and MEG are used as the best methods. However, it is worth noting that despite the existing recommendations based on the combination of different techniques, most studies have been conducted neuroimaging and only two studies combined imaging with psycho-physiologic tools such as electromyography, galvanic skin response and heart rate. The ultimate goal of neuromarketing is to investigate the formation of consumer behavior, factors that determine customer preferences and the way of choosing different brands.
Neuroimaging helps in understanding human decisions and it gives a new dimension to specialists to institutionalize new concepts and achievements [6].
The goal is to identify the brand of a large auto company like Toyota, Porton and Suzuki through a wireless EEG signal in Malaysia. Advertising for simulation and response signals for stimuli is collected by 14 channels with sampling frequency of 128 HZ. Alfa frequency band is extracted of the EEG signal data by using the Butterworth filter. Alpha band frequency spectrum is obtained by Fast Fourier Transform (FFT) and EEG signal is used for extraction of three statistical features such as power spectral density (PSD), spectral energy (SE) and the center of the spectrum (SC). Two non- linear method (KNN) and probabilistic neural network (PNN) is used to classify advertising subject. Experimental results show that people mainly prefer Toyota commercial vehicles compare to other brands. Experimental findings are for evaluating the performance of different statistical features of Alfa wave in understanding the customer expectances about various car brands that has been done by two simple non-linear classifications [2].
Oscillatory brain rhythms can bias attention via phase and amplitude changes, which modulate sensory activity, biasing information to be processed or ignored. Alpha band (7–14 Hz) oscillations lateralize with spatial attention and rhythmically inhibit visual activity and awareness through pulses of inhibition. Here we show that human observers’ awareness of spatially unattended targets is dependent on both alpha power and alpha phase at target onset. Following a predictive directional cue, alpha oscillations were entrained bilaterally using repetitive visual stimuli. Subsequently, presented either spatially cued or uncued targets at SOAs either validly or invalidly predicted in time by the entertainers. Temporal validity maximally modulated perceptual performance outside the spatial focus of attention and was associated with both increased alpha power and increased neural entrainment of phase in the hemisphere processing spatially unattended information. The results demonstrate that alpha oscillations represent a pulsating inhibition, which impedes visual processing for unattended space [4].
Emotional reactions to marketing stimuli are essential to tourist destination marketing, yet difficult to validly measure. A neuromarketing experiment was performed to establish whether brain event-related potentials (ERPs), elicited by destination photos, can be used to evaluate the effectiveness of tourist destination marketing content in movies. Two groups of participants viewed pictures from the cities of Bruges and Kyoto. Prior to viewing the pictures, one group saw an excerpt from the movie In Bruges, which positively depicts Bruges' main tourist attractions. The other group saw a movie excerpt that did not feature Bruges (the Rum Diary). An early emotional response was observed to the subsequently presented Bruges pictures for the In Bruges group only; no reliable between-group differences were found in ERPs to pictures from Kyoto. In conclusion, EEG-based neuromarketing is a valuable tool for evaluating the effectiveness of destination marketing, and popular movies can positively influence affective destination image [7].
Pseudorandom binary sequences play a significant role in many fields, such as error control coding, spread spectrum communications, and cryptography. In recent years, chaotic system is regarded as an important pseudorandom source in the design of pseudorandom bit generators (PRBGs). Among them, most are based on one or more fixed chaotic systems, and the generated binary sequences come to be stationary. However, these kinds of chaotic PRBGs can be attacked by reconstructing the phase space or using some statistical analysis methods. In this study, a scheme for chaotic PRBG based on non-stationary logistic map is proposed. The authors design a dynamic algorithm to change the driven parameter sequence (not random) into a random-like sequence. The variable parameters disrupt the phase space of the system, which can resist the phase space reconstruction attacks effectively. They prove that the non-stationary logistic map is still chaotic under Wiggins’ chaos definition. The numerical analysis shows that the generated binary sequences have good cryptographic properties and can pass the well-known statistical tests. The authors’ chaotic PRBG based on nonstationary logistic map is a novel scheme in the design of PRBG, and is more secure than the PRBGs based on fixed chaotic systems [24].
Marketing and promotions of various consumer products through advertisement campaign is a well-known practice to increase the sales and awareness amongst the consumers. This essentially leads to increase in profit to a manufacturing unit. Re-production of products usually depends on the various facts including consumption in the market, reviewer’s comments, ratings, etc. However, knowing consumer preference for decision making and behavior prediction for effective utilization of a product using unconscious processes is called “Neuromarketing”. This field is emerging fast due to its inherent potential. Therefore, research work in this direction is highly demanded, yet not reached a satisfactory level. In this paper, we propose a predictive modeling framework to understand consumer choice towards E-commerce products in terms of “likes” and “dislikes” by analyzing EEG signals. The EEG signals of volunteers with varying age and gender were recorded while they browsed through various consumer products. The accuracy of choice prediction was recorded using a user-independent testing approach with the help of Hidden Markov Model (HMM) classifier. We have observed that the prediction results are promising and the framework can be used for better business model [29].
A GfK-EMO Scan, facial expression recognition software, is used to investigate the long-term effect of advertising on individual attitudes toward driving. The effects of high emotional and low emotional advertising were measured using the GfK-EMO software on 60 participants with a 50/50 male to female ratio. Each participant was subjected to either a high emotional or low emotional safe driving video advertisement [30].
While watching the advertisement, the GfK-EMO facial recognition software recorded the unconscious emotions of participants who were also requested to fill a modified version of the National Survey of Speeding Attitudes and Behavior. A driving attitude score was then computed using this survey directly after the participant had viewed the advertisement and again two weeks later. Noticeable differences in the attitude score were recorded between participants having watched the high emotional advertisement against participants having watched the low emotional advertisement. The high emotional advertisement generated a higher and more durable safe driving attitude score in comparison to the low emotional advertisement [30].
Materials and Methods
Construction of visual provocations
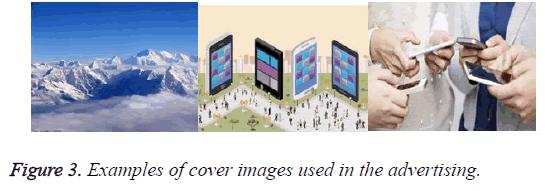
In this project, six brands of mobile phones and tablets likes Apple, LG, HTC, Samsung, Sony and Huawei Figure 2 are used and one of them will be advertised. To do this, well known and famous logos were used because mental conditions for all brands should be the same. To close the mentality of the people in each picture, brand image displayed 25 times randomly and sequentially. Various images can be used more to cover, but the rise of images cover a person's mind away from the main subject. So it is better to reduce the number of images used for this work. In Figure 3 examples of the images used in this project.
Due to the fact that these images should be displayed between cover images, it must attract person's attention at once. Show before and after ads are that brand images display for 2 seconds and consecutive all-white pictures show for 1 second. In displaying advertisement, promo images and covers showed 2 seconds successively and between each set of pictures, white images are shown about 4 seconds in Figure 4.
Registration protocol and data collection
In this project students from different disciplines are carried out signal recording. The number of 6 mobile brand images was displayed and students should just look at the pictures and think about the brand during this time. All subjects were male and aged 20-30 years old. Signal recording has been done in the light and temperature controlled room in medical engineering laboratory of Mashhad Azad university. Test site temperature has been set at 25 C. Subject were asked to be motionless and stay in convenient and steady state and refrain from blinking eye excess movements as far as possible.
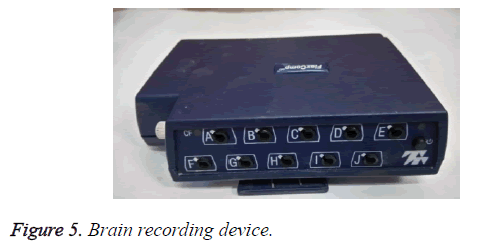
Flex-Comp-Infiniti has been used to record signals using 4 channels, 3 channels for EEG signal and one channel for pulses. The image of this device is shown in Figure 5.
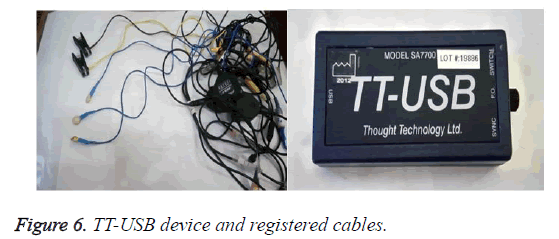
The device is connected to a computer through a converter called TT-USB Figure 6, and the electrodes were connected to the head with special cables Figure 6. The location of electrodes is impregnated with conductive adhesives into the head and ears.
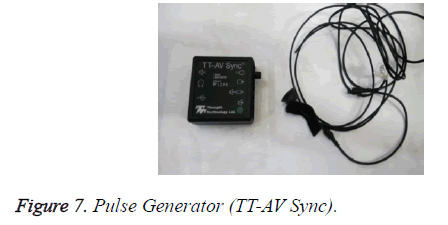
Because images are displayed continuously and the signal is recorded, the TT-AV Sync device Figure 7 is used to isolate the signal and intercept it. The method works in such a way that a square in the corner of the image with the same frequency changes with black and white images. A corresponding cable is connected to the display and the other end to the device.
In this study, EEG 3-channel signal recording is done with Flex Comp Infinite. To record the EEG signal, channels are selected that in addition to covering the head in general locations, have been proved in previous studies too. As a result, in accordance with 10-20 standard, frontal, central and parietal channels along the median line of the scalp on the skin were recorded in the form of unipolar with a reference to the left and right ear lobes.
Before the first recording, questionnaire number 1 was done to rerecord the mentality of individuals toward brands, after displaying ads, the questionnaire number 2 used to assess advertising. At the end of showing second series brands, questionnaire number 1 was used again to assess the impact of advertisement on mentality of people. According to different mentalities toward various brands, it can't expect that all subjects be in same conditions but it must be close as far as possible.
In this research a low-bass filter with a cutoff frequency of 60 HZ was use to remove high frequency noise and baseline was removed by a high pass elliptic filter with a cutoff frequency of 0.5 HZ and signal bandwidth is 55 KHZ [17,20].
Feature extraction and data processing
In this study, based on the previous studies on brain signals and signal structure, three category characteristics (frequency, timefrequency, non-linear) were chosen for signal processing. The main target is to assess changes in brain signals in order to find out whether or not ads are effective and to provide a way to prove the effectiveness of advertising using the optimal extracted features.
At this point we prepare pre-processed signal for future extraction. The signal of each subject is recorded in three parts that the first and third parts are six sections (6 brands) and each part contain 25 section that should be combined; It means the existing signal contains 150 parts and every brand has 25 sections. According to the order of displaying images in the sections relating to each brand, each part must be separated to divide each signal into 6 categories. Each category corresponds to a brand and it works with synchronous averaged [11] 25 parts of each brand.
The process is intended to assess the work in four classes: 1) Positive attitude toward the brand (+2); 2) Somewhat positive attitude toward the brand (+1); 3) Neutral brand attitude (0); 4) People have a negative attitude towards the brand and the brand quality is not satisfactory (-1). Finally, after extracting, all attributes placed in a matrix as feature matrix and therefore each subject has 6 feature matrix and 6 brands and to be given as input to the classifier.
In this study, by use of previous studies on brain signals, three feature categories were selected to process the signal. Characteristics must be optimized to reduce errors and costs, the technique using classification error evaluation function and known as wrapper methods [12]. The features are given to the algorithm and so the algorithm provides category with the lowest error as output. The precision of method for determining the sample class is good but computational costs are relatively high [22].
Frequency domain characteristics have shown a good performance in different critical signal processing and in most articles associated with the estimation of power spectrum. In this work, Butterworth 4 [17] used to extract any signal waves [2]. Characteristics of the theta band spectral density power and spectral energy of delta band were selected [15,18].
In order to lay a soiled foundation for feature extraction in our approach, the DD-DWT is explored to decompose EEG signals into numerous details at various resolutions. The DD-DWT procedure of a signal is schematically depicted in Figure 3. One low frequency sub-band (expressed as c) and two high frequency sub-bands (expressed as d) are obtained at each decomposition stage when the input signal travels through the DD-DWT system [28].
The time – frequency feature extraction for ERP signals were obtained, Wavelet coefficients extracted by the above method [28] and since the ERP signal frequency is less than 35 Hz, only the specified signals were derived as valid coefficients [8]. Mean mother wavelet db4 and mother wavelet variance decomposition level 3 were selected here [16,25].
The non-linear and chaotic signal is EEG another approach. On the other hand EEG signal is non-linear and chaotic so we should use chaotic describing tools, substrate absorption and non-liner signal [24]. In this research, according to the same works in the brain signal processing, Poincare cut platform is used for feature extraction. Quality is phase space and it shows dynamic changes and bed absorption system qualitatively. Poincare cut is one of the quantification tools in this space. In fact, Poincare cut is images of a motion that capture in certain intervals. In this area mean, total absolute and spectral density power [18] of the Poincare cut are selected [13,14].
These statistical features used as a single input vector to the MLPNN classifier, could be viewed as a feature extraction and reduction (Optimize it) step in the process detection [26].
Classifier
A classifier is a technique that utilizes various independent variable values (features) as input and predicts the corresponding class to which the independent variable belongs [32]. In the EEG signal analysis, the features can be any kind of extracted information from the signal, such as energy, entropy, power etc. and the class can be the type of task or the stimulus used during the recording. A classifier has a number of parameters that need to be learned from training data. The learned classifier is a model of the association between the features and the classes. For example, for given feature x of a class y, the classifier is a function f that predicts the class y = f(x). After the learning, the classifier is able to predict new instances that have not been used in the training data. Thus, the performance of the classifier is tested on a different set of instances [31].
For training and testing SVM in comparison with the correct neural network, the number of training data and test is considered the same. Also in contrast to neural network, SVM classifier about education accuracy performs better but the accuracy of neural network output test is better than SVM.
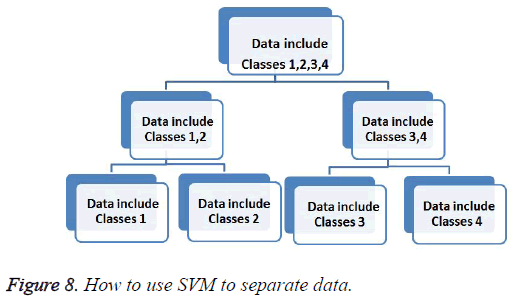
Due to the nature of SVM classifier, this classification is generally done over neural networks and it is a very important feature in classification [18,23]. In fact, aside from some differences between these two models, they are actually teaching a very similar structure via two different methods [9]. A view of how to use the network SVM come in Figure 8.
ANN can acquire data with a training set of data using the learning algorithm. Backpropagation learning algorithm is used in ANN. Through back-propagation, ANN attempts to correlate inputs and the desired output. To achieve the desired output, the weights of interlink nodes are adjusted in each epoch using the training process [27]. Artificial neural networks (ANN) were successfully used in a wide variety of medical applications. The multilayer perceptron neural network (MLPNN) is presumably the most commonly employed neural network architecture due to its powerful characteristics such as generalization (ability to classify unseen data), parallelism, and ease of use in the testing phase once the model has been saved. In major classification problems, the desired output vector has its components 1's and 0's, with 1 indicates the class to which belongs the corresponding input vector [26].
The purpose of the classification with MLP neural network is to determine the effectiveness of advertising on subjects. Typically, multilayer neural networks can be classified as nonlinear categorization using general back propagation algorithm (BP). Total data percentage was considered for training whereas testing was performed on just 30% of them. Support vector machines transfer data to higher dimensional space so that data in new space will have the highest resolution. This transfer is done by using kernel functions and high number of kernel function selection is one of the strengths of this method. This algorithm finds two major plane parallel which are placed in the most distance from each other and at the same time consisted of the lowest number of data training; this distance is called margins. Major parallel plates and determined margin between them, specifies the decision boundary between two categories [11,19].
To demonstrate the effectiveness of the proposed feature extraction scheme in cognitive function classification, the SVM and multi-layer perceptron (MLP) Byes classifiers were used [31]. The SVM used a kernel trick to transform the data points into a higher dimensional space and then separated them by a hyperplane with a maximal margin. The MLP is a neural network-based method, which is commonly used for performing a different variety of detection and estimation tasks. For more details about SVM and MLP Bayes [33-35].
Results
A direct comparison of the results with the previous research in EEG signals was hard due to the variety of EEG datasets, wavelet types, decomposition levels, participants’ variability, and the cognitive tasks used. However, a brief comparison with the previous related studies is presented here. The information about the dataset, feature extraction methods, cognitive tasks, machine learning algorithm and the classification performance reported in previous studies are presented in Table 1 [31]. The list of studies in Table 1 have used the time domain, frequency domain, autoregressive (AR) coefficient and/or wavelet transform-based features for EEG classification in a cognitive task as mentioned in ‘‘Related work’’ section. The majority of the studies have used nonlinear classifiers (e.g., ANN and kernel-based SVM), which are complex in nature and time consuming to build the classification model. In the case of using very few instances in the classification as mentioned in a few studies in Table 1, it may causes the over fitting problem in classification [36].
| Ref | Year | Subjects (instances) | EEG scalp Electrodes | Cognitive task | Feature | Classifier | Accuracy (%) |
|---|---|---|---|---|---|---|---|
| 38 | 2003 | 4 | 6 | Five task as reported by Keirn and Aunon [37] | Wavelet packet | RBF network | 85.3 |
| 39 | 2004 | 4 | 6 | Five task as reported by Keirn and Aunon [37] | DWT | ANN | 74.40-82.30 |
| 40 | 2006 | 7 | 6 | Five task as reported by Keirn and Aunon [37] | AR Coefficients | SVM, ANN and ELM | 53.98-56.07 |
| 41 | 2007 | 2 | 6 | Five task as reported by Keirn and Aunon [37] | Wavlet Packet Entropy up to seven levels | SVM | 87.5-93.00 |
| 42 | 2007 | 7 | 6 | Three task classified(Baseline,Mental letter, Multiplication) from Keirn and Aunon[37] | Frequency Bands Power and AR Coefficients | SVM with RVF Kernel | 70 |
| 43 | 2009 | × | × | - | Wavelet relative energy | ANN | 95.2 |
| 44 | 2009 | 7 | 6 | Five task as reported by Keirn and Aunon [37] | Empirical mode decomposition, time and frequency domain features | ANN and LDA | 87.35-91.17 |
| 45 | 2009 | 4 | 6 | Five task (Baseline or relaxed state, Visual Counting, Mental letter composing geometric object rotation)as reported by Keirn and Aunon [37] | Dwt with db4 up to level 5 | K-NN | 81.48-89.58 |
| 46 | 2009 | 3 | 8 | Three cognitive task(imagination of left hand movement and imagination of right hand movement, and generation of words) | Power spectral density feature | ANN and SVM | 65.90-68.35 |
| 47 | 2011 | 7 | 6 | Five task as reported by Keirn and Aunon [37] | Immune feature | SVM | 85.4-97.5 |
| 48 | 2014 | 120 | × | Raven's progressive metric | Frequency Bands power | ANN | 88.89 |
| This work | 2014 | 8(560) | 128 | Baseline (eyes open), RAPM | Wavelet relative energy | SVM | 98.75 |
| MLP | 98.57 | ||||||
| K-NN | 98.21 | ||||||
| Naïve Bayes | 83.57 |
Table 1. Summary of existing feature extraction and classification techniques for EEG in cognitive tasks [31].
Questionnaire
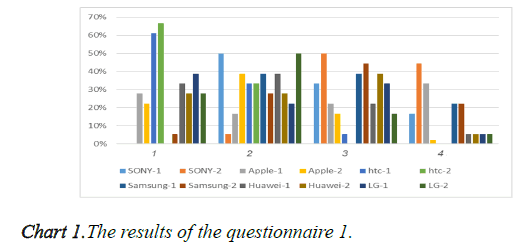
This questionnaire has 23 questions and aims to measure brand image (brand, service, timeliness, quality, variety / selection and atmosphere). Figure 2 shows the positive impact of advertising on subjects 1 and 2, respectively are related to before and after ads in Chart 1.
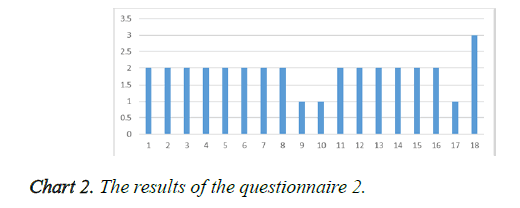
Questionnaire number 2 is filled after displaying advertisement to evaluate the advertising effect on brand success. Scaling and ranking is the same as questionnaire number 1 and 77% of subjects prove its positive impact. And this issue can be seen in Chart 2.
Classification with MLP neural network
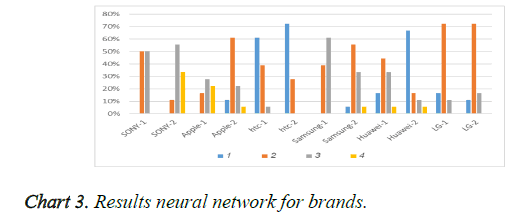
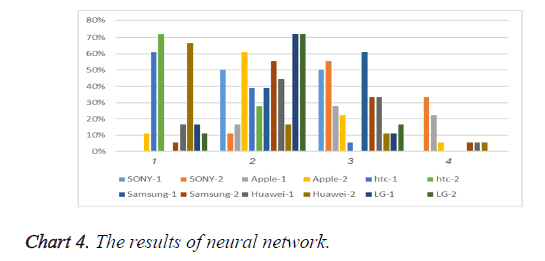
We obtained network output by executing neural network for 12 categories and all subjects, and rounded the decimal outputs; After classification the subjects belonging to the class and the percentages obtained and then the results presented in Charts 3 and 4.
To examine the fact that to what extent outputs has followed the initial classification, differences between the percentages of subjects obtained from questionnaires results and neural network classification. Considering the differences, we can find error that is presented in Table 2.
| Name | Percent accuracy | Percent error |
|---|---|---|
| SONY-1 | 93,52 | 6.48 |
| SONY-2 | 93,52 | 6.48 |
| Apple-1 | 99,22 | 87.2 |
| Apple-2 | 94,91 | 5.09 |
| htc-1 | 92,13 | 7.87 |
| htc-2 | 93,99 | 6.01 |
| Samsung-1 | 98,15 | 1.85 |
| Samsung-2 | 96,3 | 3.7 |
| Huawei-1 | 96,3 | 3.7 |
| Huawei-2 | 94,44 | 65.5 |
| LG-1 | 95,37 | 36.4 |
| LG-2 | 96,76 | 3.24 |
| average | 95.38 | 4.78 |
Table 2: Accuracy neural of network result.
Classification with SVM
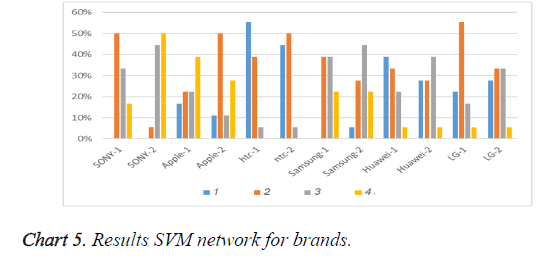
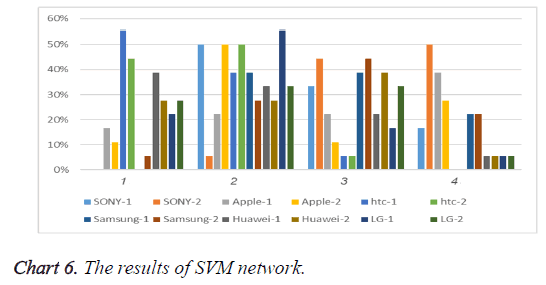
SVM's output obtained by running it for 12 categories and all subjects, classification done and with summing data classification for different classes, belonging percentage of subjects and classes became clear and the results are shown in Charts 5 and 6.
To examine the fact that to what extent outputs has followed the initial classification, differences between the percentages of subjects obtained from questionnaires results and SVM network classification. Considering the differences, we can find error that is presented in Table 3.
| Brand name | Percent accuracy | Percent error |
|---|---|---|
| SONY-1 | 98.88 | 11,1 |
| SONY-2 | 81.91 | 8,82 |
| Apple-1 | 93.98 | 6,02 |
| Apple-2 | 81.77 | 18,23 |
| htc-1 | 10.97 | 2,99 |
| htc-2 | 81.91 | 8,82 |
| Samsung-1 | 76.91 | 8,33 |
| Samsung-2 | 94.44 | 5,56 |
| Huawei-1 | 93.73 | 6,27 |
| Huawei-2 | 100 | 0 |
| LG-1 | 54.85 | 15,55 |
| LG-2 | 42.9 | 9,76 |
| average | 91.63 | 8,37 |
Table 3. The Impact of Advertising on the subject ANN output.
Table 4 shows the changes in subjects than the brands, positive numbers indicate an increase compared to the class, negative numbers show a decrease compared to the class and zero represents no change. From this table, we can conclude that promotion for Sony and Huawei brands had a positive impact on people, HTC and Samsung brands have almost no effect and Apple and LG brands almost had a negative impact. Considering that the aim of the project was to promote Sony and weaken other brands, this favorable influence had been shown on objects too.
| Brand name | Class 1 | Class 2 | Class 3 | Class 4 |
|---|---|---|---|---|
| Sony | 0 | -44.5 | 16.7 | 27.8 |
| Apple | -5.5 | 22.2 | -5.5 | -11.1 |
| Htc | 5.5 | 0 | -5.5 | 0 |
| Samsung | 5.5 | -11.1 | 5.5 | 0 |
| Huawei | -5.5 | -11.1 | 16.6 | 0 |
| LG | -11.1 | 27.7 | -16.6 | 0 |
Table 4. Impact of Advertising on the subject with questionnaire.
Feature extraction was done according to similar works and articles and 14 features achieved in three frequencies, time frequency and phase space groups which were used to evaluate the features from optimal feature extraction algorithm based on classification error and 7 features were optimized. So we can conclude that:
1) Characteristics of the phase space result of Poincare cut off frequency have better separation than frequency and time frequency features. 2) The average properties for the frequency and time- frequency characteristics are more suitable compare to others. 3) Given that optimal features for each part of brandrelated signal were extracted separately, and we choose the most frequent features, it can be concluded that the brand effects on people have been closed to each other. SVM and ANN output characteristics for optimal network Performance were obtained for 12 categories and all the subjects and the results are shown in Tables 5 and 6.
| ANN | Class1 | Class2 | Class3 | Class4 |
|---|---|---|---|---|
| Sony | 0 | -55.5 | 16.6 | 44.5 |
| Apple | -5.5 | 22.2 | -22.2 | -5.5 |
| Htc | 11.1 | 0 | -11.1 | 0 |
| Samsung | 0 | -5.5 | 5.5 | 0 |
| Huawei | 11.1 | 11.1 | -5.5 | -16.6 |
| LG | 0 | -5.5 | 0 | 5.5 |
Table 5. The Impact of Advertising on the subject ANN output.
| SVM | Class1 | Class2 | Class3 | Class4 |
|---|---|---|---|---|
| Sony | 0 | -38.9 | 5.5 | 16.7 |
| Apple | 11.1 | 44.5 | -5.5 | -16.7 |
| Htc | 11.1 | -11.1 | -5.5 | 0 |
| Samsung | 5.5 | 16.7 | -27.8 | 5.5 |
| Huawei | 50 | -27.8 | -22.2 | 0 |
| LG | -5.5 | 0 | 5.5 | 0 |
Table 6. The Impact of Advertising on the subject with SVM output.
We can come to the following conclusions:
1) Neural network classifier splits class 2 with more errors than other three classes. SVM classifier divides classes 2 and 3 with more errors than others, so we can conclude that class 2 was not well separated and it is a major contributor to total error; 2) Arrange of the neural network error for various brands is as follows: Apple-1< Samsung-1< LG-2< ... < SONY-1، SONY-2< htc-1 ; 3) order of support vector machine for different brands errors is as follows : Huawei-2 < htc-1< Samsung-2< ... < SONY-1< Apple-1< LG-1; 4) Less error means better spliting of optional features of brand space.
Conclusion
The purpose of this paper is to stimulate people s’ mind to advertise based on subconsciously influence over neuromarketing and understandably changes in EEG signals when the ad images.
In this context the images of brands that public images of their names are sequentially displayed and simultaneously record brain signals are performed. After preparation and preprocessing the signal characteristics in the frequency, timefrequency and nonlinear domain extraction and with optimal feature extraction algorithm based classification errors, enhanced features was specified and the classifier was given and according to the Target determined that the subject appears in any class (promoting positive impact, somewhat effective, neutral and negatively impact) is compared to brands. After reviewing the results, it was found that advertising could draw for most people than the advertised brand.
Advertising used in this study had a positive impact on the advertised brand (Sony) and had negative or almost no effect on the others. Although the features used for classifiers were average of selected features of 12 brands, which was used for all brands, and it was expected that errors increase, the accuracy of the output is acceptable. Due to fewer errors, neural network is better than SVM whereas SVM is more cost effective because of the low volume of data.
References
- Bettiga D, Lamberti L, Noci G. Do mind and body agree? Unconscious versus conscious arousal in product attitude formation. J Bus Res. 2017;75:108-17.
- Murugappan M, Murugappan S, Gerard C. Wireless EEG Signals based Neuromarketing System using Fast Fourier Transform. IEEE 10th International Colloquium on Signal Processing & its Applications. 2014.
- Hurme M, Koivisto M, Revonsuo A, et al. Early processing in primary visual cortex is necessary for conscious and uncon
