Research Article - Biomedical Research (2016) Health Science and Bio Convergence Technology: Edition-I
Analysis of radio frequency reflectance type PPG sensor based on systolic amplitude and source wavelength
Nivedita Daimiwal1*, Dr. Betty Martin2, Dr. M Sundararajan3, Revati Shriram41Research scholar, Faculty of Electronics Engineering, Sathyabama University, Chennai, India
2Assistant Professor, Sathyabama University, Chennai, India
3Dean Research, Bharath Institute of Higher Education and Research, India
4Cummins College of Engineering for Women, Pune, India
- *Corresponding Author:
- Nivedita Daimiwal
Research Scholar Faculty of Electronic Engineering
Sathyabama University
India
Accepted date: April 20, 2016
Abstract
PPG (photoplethysmography) sensors are capable of measuring blood volumetric changes in the subcutaneous vessels. The transmission type of measurement is limited to only a few specific positions whereas the reflectance type of PPG sensor can be easily applied on various parts of the body surface. To determine the quality of reflectance type photoplethysmography signal, various parameters are analysed like the source-detector distance and the source wavelengths (660 nm and 860 nm). The experimental set up for light reflectance measurement is surface mount light-emitting diodes (LEDs) with two different wavelengths (660 nm and 860 nm) of light were tested in the experiment and by varying the distance between the source and the detector. The excitation signal used for LED is AC varying from range of 300 kHz and above and analysing the advantages as compared to DC excitation. Detector used is OPT101. The work in this paper analyses systolic amplitude (SA) using MATLAB for two wavelengths 660 nm and 860 nm. The sensors are designed for two distances, 1 cm and 1.5 cm respectively. Observations were taken for two different wavelengths with two different distances for 10 females in the age group 20 to 50 years. The results show that SA amplitude decreases as the source and detector distance increases. In Paired t-test using Minitab 17, the mean of SA of PPG signal acquired with a distance of 1 cm between the source and detector was observed to be greater than the mean of SA of PPG signal which was acquired with a distance of 1.5 cm (p<0.1). Systolic amplitude of 860 nm for oxy-Hb is greater than 660 nm for deoxy-Hb, so we concluded that the system can be used for measurement of concentration change in deoxy-Hb and oxy-Hb due to increase in blood during brain activity.
Keywords
Average filter, OPT 101, Reflectance type PPG (Photoplethysmography), RF (Radio frequency), Systolic amplitude, Wavelength.
Introduction
Using photons as sensing elements in optical sensor are important and relevant in the field of non-invasive measurement. Optical sensors are simple construction, relatively inexpensive and easy to use in comparison to the EEG and MRI. As the disposable sensors are not required like in the ECG recording. Blood volume changes in tissue are synchronous with the heart rate. This technique is most preferred for heart rate measurement. There are two basic types of PPG sensors; transmittance and reflectance type. The reflectance type of sensor can be applied on any part of body surface. Sensor can be placed on various locations like fingertip, palm, neck, forearm, etc. The transmittance sensor has limitation that it can be applied only on fingertip or ear lobes [1,2]. The plethysmography signal contains information about the heart rate, blood pressure changes, blood vessel pulsations, breathing and even more [3]. The ease of use and installation, non-invasive nature and rich information content make photoplethysmography a very useful tool for monitoring the processes of the human body. PPG-based technology can be found in a wide range of commercially available medical devices for measuring oxygen saturation, blood pressure and cardiac output [4].
Modes of PPG
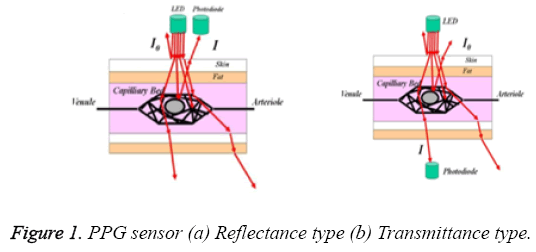
There are two basic types of PPG sensors namely the transmittance and reflectance type as shown in Figure 1.
Transmittance mode: Source and detector are placed opposite to each other. The photo detector resistance is a function of incident light intensity. The photo detector is made from semiconductors and hence the resistance of the photo detector decreases when light is incident on it. During heart muscles contraction, blood is pumped and the volume of the blood in the finger increases. It changes the optical density of the finger and hence the amount of light transmitted is reduced and this increases the resistance of photo detector. To avoid blood heating LED’s are used as light sources. The transmittance sensor has limitation that it can be applied on fingertip or ear lobe.
Reflectance mode: The source and the detector are on the same side. It is possible to change the distance between the source and the detector. The reflected and scattered light from the skin is detected by photo detector. The intensity of reflected light depends upon the blood saturation of the blood vessels [5].
The depth where there is 37% drop in the intensity on the incident body surface is called the penetration depth. This depth depends on the extinction coefficient of tissue. Extinction coefficient is the combination of absorption and scattering coefficient. Absorption coefficient depends on the wavelength and scattering coefficient decreases as the wavelength increases [5]. To analyse the quality of reflectance photoplethysmography sensor the factors are wavelength of light, the distance between the light source and detector and the optical properties of the tissue [6-8].
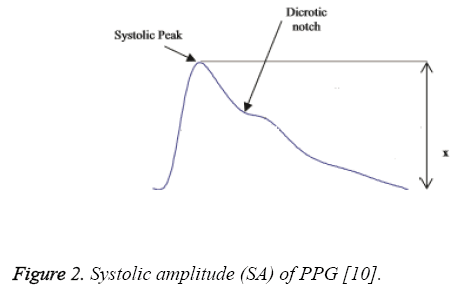
Systolic Amplitude (SA): To sense blood volume changes due to arterial blood flow in the body surface ‘SA’ (x) is a major indicator [9,10]. SA is related to stroke volume [11,12]. SA is suitable for measurement of continuous blood pressure based on pulse arrival time [13]. SA of PPG is shown in Figure 2.
Figure 2: Systolic amplitude (SA) of PPG [10].
Materials and Methods
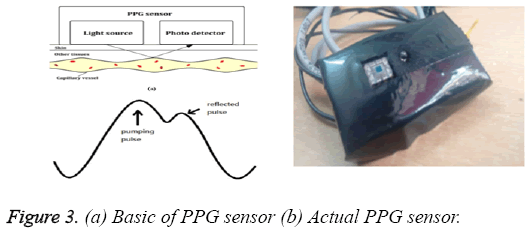
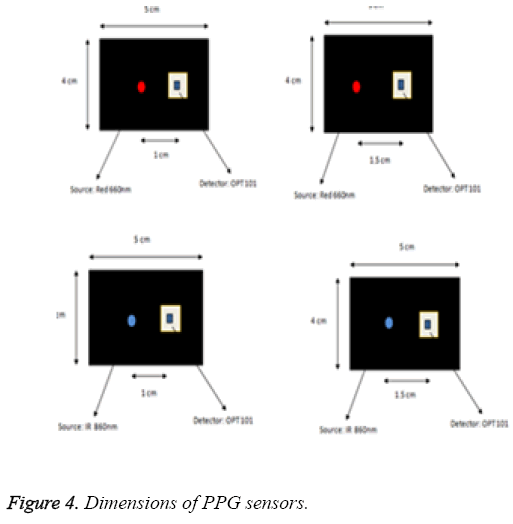
PPG sensor: Four reflectance type of PPG sensors were designed for two wavelengths 660 nm and 860 nm with two distances 1 cm and 1.5 cm (Figures 3 and 4) [14].
Optical sensor design
Use a square shaped box as an enclosure.
Mount the photo source (LED) and photo detector (OPT 101) on small piece of PCB.
Use shielded cable for supply of photo source and OPT 101 connection.
Make holes on box of the size same as that of OPT 101 and LED.
Fit the PCB in the box and pack it by using sponge.
OPT101 was selected as a detector [15] because its spectral response was seen for considerable range. The LEDs and OPT-101 were arranged on a small piece of PCB. The PCB was sandwiched between two pieces of black colour shoe pad, so as to reduce the effect of noise and ambient light. Two sensors of similar pattern for LEDs [16] of different wavelengths were developed to observe the PPG signal. Shielded wiring was used to reduce noise interference and increase the accuracy.
Excitation signal to sensor: The AC signal penetrates deeper into thick tissues due to variation in frequency. A frequency range of 300 kHz-2 MHz and above has been applied and upon increasing the frequency a better signal was obtained as compared to DC signal.
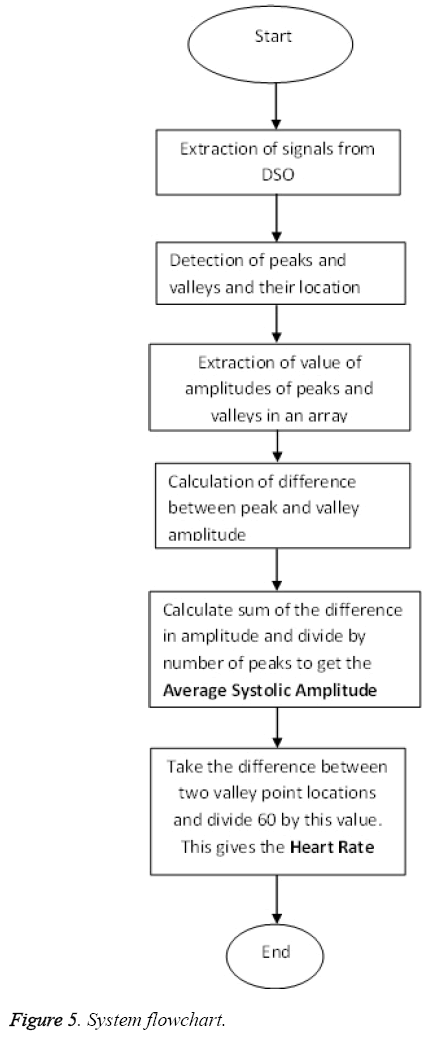
The system flowchart for analysis of PPG signal done in the MATLAB is shown in Figure 5.
Signal conditioning circuit
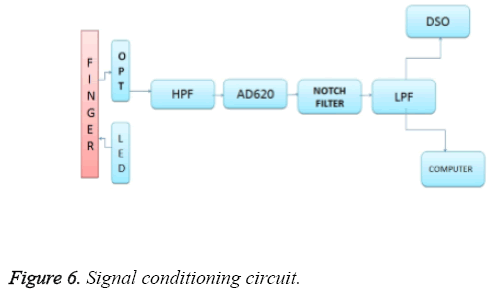
The signal conditioning circuit for obtaining PPG signal is as shown in the Figure 6. The signal conditioning steps are as follows:
1. Step I: Filtering-Output from the PPG sensor is passed through high pass filter whose cut off frequency is set to 0.5 Hz.
2. Step II: Amplification- After filtering operation, the next step is amplification by using instrumentation amplifier AD-620. The AD-620 requires only one external resistor to set the gains of 1 to 10,000. AD-620 with its high accuracy of 40 ppm maximum non-linearity, low offset voltage of 50 µV max, is best for use in precision data acquisition systems. The gain of AD-620 is set by external resistor (R=1.5 KO). Substituting the value of R, the gain of AD-620 is 34. Here, we assume the capacitor value as 1 µF. Substituting all the values resistor value is calculated as 318 KO. So, the resistor value is taken nearer to this value as 330 KO.
Step III: Notch Filter- After amplification, the output of AD-620 is given to notch filter. This notch filter is the combination of multiple feedbacks (MFB) and inverting adder to remove 50 Hz ac mains noise.
Results and Analysis
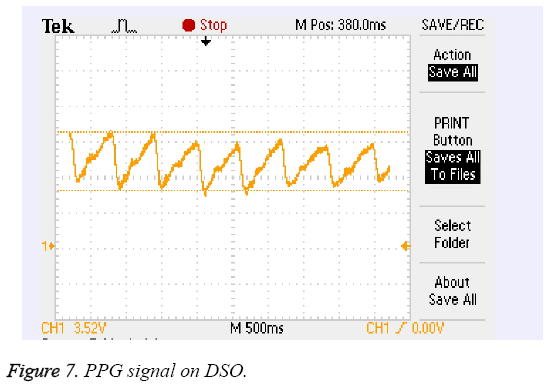
The analysis of PPG signal was done using following steps. PPG signals are extracted from DSO. The .csv files recorded using DSO shown in Figure 7 is been processed in MATLAB.
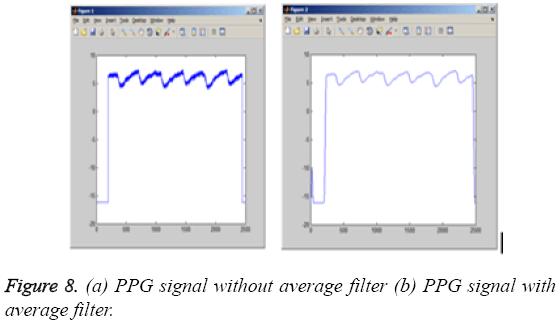
Removal of noise was done using average filter. Signal after noise removal is as shown in Figure 8. Peaks, valley points and their amplitude are stored in an array.
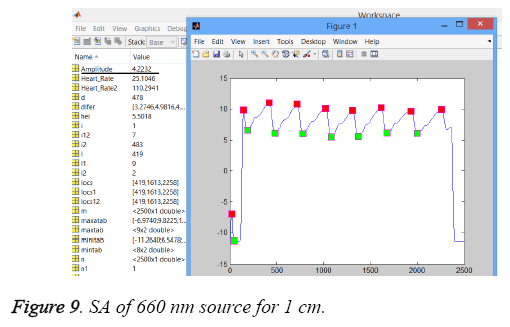
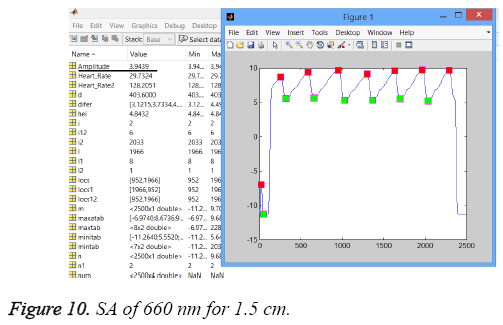
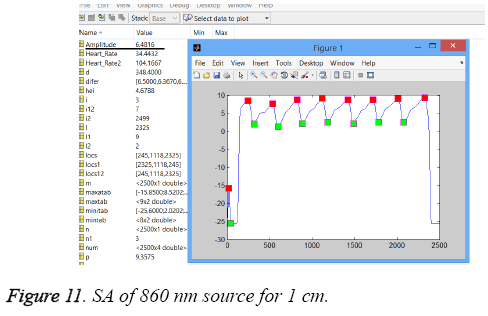
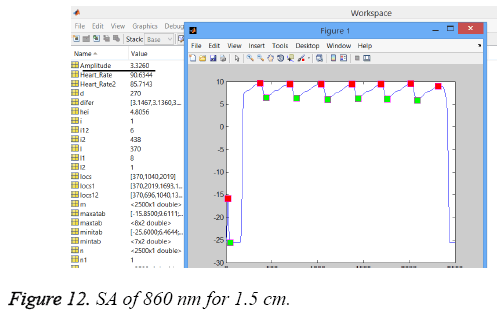
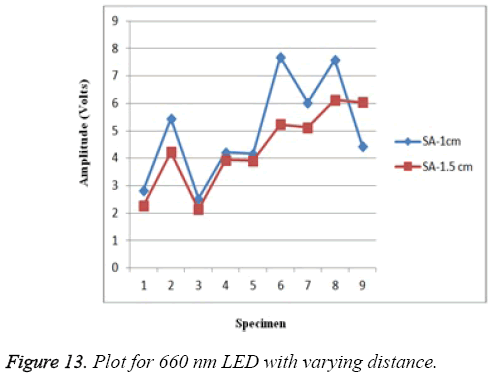
Average systolic amplitude was calculated by taking sum of the differences in amplitude and by dividing it by the number of peaks. Analysis of peaks, valley point and SA of 660 nm source for 1 cm and 1.5 cm are shown in Figure 9 and Figure 10, respectively. And also of 860 nm source for 1 cm and 1.5 cm are shown in Figure 11 and Figure 12, respectively. Figure 13 shows the plot for 660 nm with varying distance.

ΔT=Time between two successive peaks of PPG signal.
Table 1 and Table 2 shows SA for 1 cm and 1.5 cm and heart rate for 660 nm and 860 nm respectively.
| Gender | Age | SA-1 cm (Volts) | SA-1.5 cm (Volts) | HR (BPM) | |
| Specimen 1 | F | 22 | 2.8306 | 2.2616 | 106 |
| Specimen 2 | F | 22 | 5.4518 | 4.2243 | 83 |
| Specimen 3 | F | 22 | 2.5269 | 2.1398 | 105 |
| Specimen 4 | F | 22 | 4.2232 | 3.9439 | 90 |
| Specimen 5 | F | 21 | 4.1783 | 3.912 | 90 |
| Specimen 6 | F | 22 | 7.695 | 5.2341 | 110 |
| Specimen 7 | M | 32 | 6.0417 | 5.123 | 79 |
| Specimen 8 | M | 38 | 7.6052 | 6.1243 | 86 |
| Specimen 9 | M | 49 | 4.4561 | 6.0365 | 76 |
Table 1: SA and Heart rate of different specimen.
| Gender | Age | SA-1 cm (Volts) | SA-1.5 cm (Volts) | HR (BPM) | |
| Specimen 1 | F | 22 | 3.2686 | 2.6854 | 70 |
| Specimen 2 | F | 22 | 6.8168 | 3.4204 | 67 |
| Specimen 3 | F | 22 | 3.2938 | 2.5342 | 93 |
| Specimen 4 | F | 22 | 6.4816 | 3.326 | 94 |
Table 2: SA and Heart rate of different specimen.
Statistical analysis
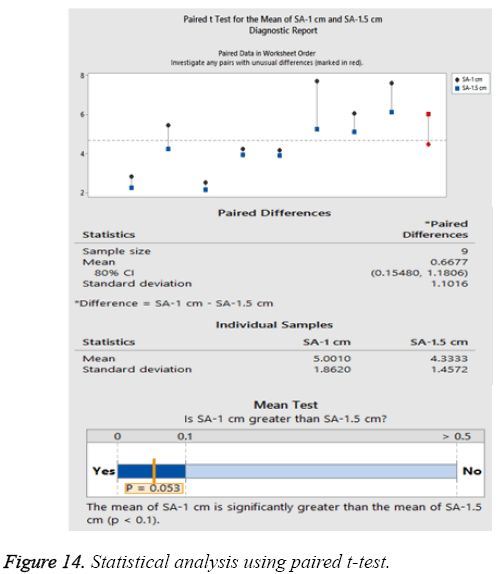
Statistical analysis was carried out using Minitab 17. Paired t test was used for calculating the mean of SA of PPG signals acquired from the sensors where the distance between the source and detector is 1 cm and 1.5 cm. The results are shown in Figure 14.
Conclusion
Reflectance type of PPG sensor is designed using LED (660 nm, 860 nm) as source and OPT101 as a detector .The PPG signal is captured for different wavelengths for different specimens. As the source and detector distance increases, the systolic amplitude decreases. By carrying out statistical analysis using paired t test, the mean of SA of PPG signal acquired with a distance of 1cm between the source and detector was observed to be greater than the distance of 1.5 cm (p<0.1). Penetration depth is observed to be more for IR LED. Response time of IR LED (860 nm) is found to be more than the clear red LED. This system can be used for measurement of concentration change in deoxy-Hb and oxy-Hb due to increase in blood during brain activity. Analysing the SA of PPG signal obtained from the reflectance type of sensor plays a very important and crucial role in understanding the haemodynamic functionalities of the body.
References
- Huang FH, Yuan JP, Kang-Ping, Chang HH. Analysis of Reflectance Photoplethysmograph Sensors. World Academy of Science Engineering and Technology. 2005; 5:11-29.
- Allen J. Photoplethysmography and its application in clinical physiological measurement. Physiology meas. 2007; 28: R1-R39.
- Chua CP, Heneghan C. Continuous Blood Pressure Monitoring using ECG and Finger Photoplethysmogram, The 28th Annual International Conference of the IEEE Engineering in Medicine and Biology Society. 2006.
- Sundararanjan M. Optical sensor based instrument for correlative analysis of human ECG and breathing signal, Int J Electr Eng R. 2009; 1: 287-298.
- Cromwell, Weibell FJ, Pfeiffer EA. Biomedical and Measurements. Eastern Economy Edition, New Delhi, second edition. 2009.
- Joseph JC, Brown MJ. Introduction to Biomedical Equipment Technology. 1993.
- Anderson RR and Parrish JA . The optics of human skin. J Invest Dermatol. 1981; 77: 13-19.
- Mendelson Y, Ochs B. Non-invasive Pulse Oximetry utilizing Skin reflectance Photoplethysmography. IEEE Tran Biomed Eng. 1988; 35: 798-805.
- Asada HH, Shaltis P, Reisner A, Sokwoo R, Hutchinson RC. Mobile monitoring with wearable photoplethysmographic biosensors. IEEE Engineering in Medicine and Biology Magazine. 2003; 22:28-40.
- Mohamed EL. On the Analysis of Fingertip Photoplethysmogram Signals. Current Cardiology Reviews. 2012; 8: 14-25.
- Murray W, Foster P. The peripheral pulse wave: information overlooked. Journal of Clinical Monitoring and Computing. 1996; 12: 365-377.
- Dorlas J, Nijboer J. Photo-electric plethysmography as a monitoring device in anaesthesia. Application and interpretation. British J Anaes. 1985; 57: 524-530.
- Chua CP, Heneghan C. Continuous Blood Pressure Monitoring using ECG and Finger Photoplethysmogram. The 28th Annual International Conference of the IEEE Engineering in Medicine and Biology Society. 2006.
- Nivedita D, Sundhararajan M, Revati S. Comparative Analysis of LDR and OPT 101 Detectors in Reflectance type PPG sensor. IEEE conference, ICCSP 2014.
- Data Sheet of OPT101 [http://www.ti.com/lit/ds/symlink/opt101.pdf] LED Datasheet.
- Laulkar R, Nivedita D. Acquisition of PPG signal for diagnosis of parameters related to heart. Physics and Technology of Sensors (ISPTS), 1st International Symposium, IEEE Conference Publications. 2012.
