Research Article - Journal of Food Science and Nutrition (2019) Volume 2, Issue 2
Analogous pairs of polar and non-polar antioxidants in rosemary-gallic acid microemulsion system for deep frying application.
- * Corresponding Author:
- Chow PY
Head of Innovation and Application Excellence
Food Technologies Kemin Industries Inc
Singapore
Tel: +6564904907
E-mail: edwin.chow@kemin.com
Accepted Date: April 20, 2019
Citation: Heng HFE, Ong XL, Chow PYE. Analogous pairs of polar and non-polar antioxidants in rosemary-gallic acid microemulsion system for deep frying application. J Food Sci Nutr. 2019;2(2):1-6.
DOI: 10.35841/food-science-.2.2.1-6
Visit for more related articles at Journal of Food Science and NutritionAbstract
The aim of the study was to compare the frying performance of soybean oil using microemulsified rosemary-gallic acid (RG30ME) liquid against non-microemulsified RG30 liquid in deep-fat frying of French fries. Frying trials were conducted for 70 frying cycles. The oil samples were analyzed for induction period at 100°C, peroxide value (PV), p-anisidine value (AV), acid value, % total polar compounds (TPC) and colour parameters after every 10 frying cycles and the results were statistically analyzed. Frying performance of soybean oil in terms of number of extra frying cycles and % improvement offered by microemulsified RG30ME liquid were compared against an untreated control and non-microemulsified RG30 liquid for all quality parameters. Overall, addition of microemulsified RG30ME liquid at 250 and 500 ppm respectively improved the frying performance of soybean oil by 280% and 940% for induction period, 125% and 150% for % total polar compounds and 50% and 70% in TOTOX value respectively in comparison to untreated control. When compared to non-microemulsified RG30 liquid at the same inclusion rate of 500 ppm, improvement by 34% for induction period, 11% for % total polar compounds and 6% in TOTOX value respectively were observed. Microemulsified RG30ME liquid is unique, as it is based on a microemulsion carrier allowing better distribution of the antioxidants combined with a better solubility into oil matrices, resulting in protection against oxidation in deep fat frying application.
Keywords
Polar Paradox, Rosemary, Gallic acid, Microemulsion, Deep-fat frying.
Introduction
The concept of "Polar Paradox" has been useful in explaining several observations regarding functionality of polar antioxidants in non-polar systems, and less polar antioxidants in polar systems. This theory confirmed that the polar antioxidants from the short-chain gallate group had the highest ability to delay the formation of peroxides but has limited solubility in bulk oil which hindered them to be used in higher concentration. Non-polar antioxidants like rosemary extract will uniformly dissolve into bulk oils thus having little active antioxidants at the surface area where reactive oxygen species are entering.
It is understood from our in-house study that Kemin’s FORTIUM® gallic acid-rosemary blend antioxidants (RG30) has proven to be efficacious in retarding the deterioration of oils. Encapsulation of active ingredients using microemulsion offers exciting possibilities for enhancing the solubilization, stability and efficacy of additives in general [1-6]. More recently, by applying microemulsion, a microemulsified version of RG30 liquid is developed. In this paper, we report the outcome of dose-dependent frying trial designed to test the hypothesis that microemulsified antioxidant product shows improved efficacy over corresponding non-microemulsified preparations, leading to better protection of the quality of the frying oil at lower dosages. We have formulated microemulsified gallic acidrosemary blend antioxidants using emulsifying systems which are comprised of homogenous liquid mixtures of oil, surfactant and co-emulsifier to solubilize polar and non-polar antioxidant molecules. A frying trial was set up using soybean oil for frying French fries to compare the efficacy of using microemulsified RG30ME liquid treated at 250 ppm and 500 ppm against nonmicroemulsified RG30 liquid treated at 500 ppm to compare the frying performance in terms of number of extra frying cycles and % improvement. This trial also served to demonstrate the uniqueness of using the microemulsion in developing a customized antioxidant blend to help food processing companies better differentiate and position in the marketplace.
Materials and Methods
Materials
The microemulsified gallic acid-rosemary liquid (RG30ME) and non-microemulsified RG30 liquid (RG30) containing the same level of ~33 wt% rosemary extract and ~10 wt% gallic acid were produced in Kemin Food Technologies, Singapore. Briefly, the rosemary extract and gallic acid are dissolved in propylene glycol, polysorbate 80 and glyceryl mono-oleate while microemulsified RG30 liquid was made following the same procedure except the rosemary extract and gallic acid are solubilized in microemulsion liquid [7]. (containing Tween 80, water, limonene, ethanol, and glycerol). Soybean oil and French fries used in the frying process were purchased from a local supermarket.
Treatments and dosages
The different treatments used for the frying experiment using soybean oil were prepared as shown in Table 1. A domestic deep-fat fryer (Philips Deep Fryer HD6159) with a 2-L-volume vessel was used for the deep-fat frying. Temperature was monitored with digital thermometers. For each deep-frying cycle, after heating the oil to and maintained constantly at 180°C, French fries (100 g per batch) was added and deep fried for 3 mins for one frying cycle. After every 10 frying cycles, oil top up of 100 ml from the respective treatments were added. Samples of frying oils (100 g) after every ten frying cycles were collected (0, 10, 20, 30, 40, 50, 60 and 70) and cooled to room temperature before storing at 4°C prior to further analyses. Frying trials were conducted in duplicates (n=2) (Table 1).
Table 1. Treatments used in frying and their inclusion rate (inclusion rates are in ppm).
| Treatment | Inclusion rate (ppm) |
|---|---|
| NC | Soybean oil (without antioxidant) |
| T1 | Soybean oil with 500 ppm RG30 |
| T2 | Soybean oil with 250 ppm RG30ME |
| T3 | Soybean oil with 500 ppm RG30ME |
Physio-chemical analysis of oil
Peroxide value (PV), p-anisidine value (AV) and oxidative stability index (OSI) were analysed following AOCS official method Cd 8-53, Cd 18-90 and Cd 12b-92 respectively (AOCS 1990). TOTOX value is calculated by the formula AV + 2PV to indicate an oil’s overall oxidation state and total polar compounds (TPC) using TESTO 270 cooking oil tester. Acid value was determined using a modified method from AOCS Official Method Cd 31-63 (AOCS, 2017) and colour parameters using Hunterlab Colorflex EZ.
Statistical analysis
Analysis of variance (ANOVA) and multiple range tests were conducted using Statgraphics Plus version 5.0 software package.
Comparison of frying performance
Frying performance of soybean oil was measured in terms of number of extra frying cycles and % improvement offered by microemulsified RG30ME liquid against untreated control and non-microemulsified RG30 liquid for all quality parameters. For each quality parameter, number of extra frying cycles provided by microemulsified RG30ME liquid with respect to untreated control and non-microemulsified RG30 liquid was calculated by subtracting frying cycle of untreated control and nonmicroemulsified RG30 liquid from microemulsified RG30ME liquid. Similarly, the % improvement in frying performance offered by microemulsified RG30ME liquid with respect to untreated control and non-microemulsified RG30 liquid was measured by finding the percentage of number of extra frying cycles with respect to the frying cycle of untreated control and non-microemulsified RG30 liquid.
Results and Analysis
Induction period
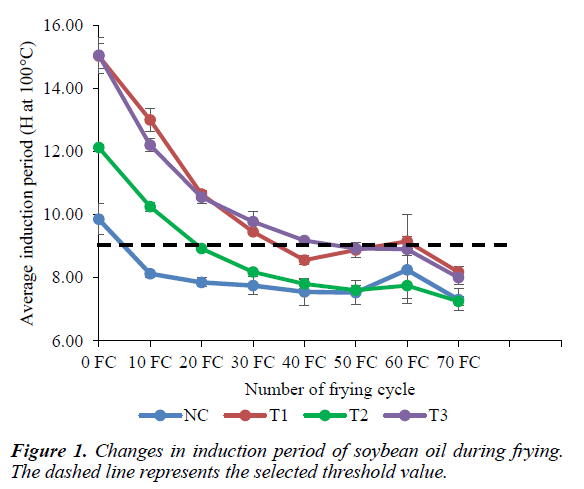
Induction period (oxidative stability index, OSI) is a direct evidence for changes in oxidative resistance. Induction period of frying oils were measured at 100°C. There was a decrease in induction period observed in all the treatments due to deterioration of oil with increasing number of frying cycles as shown in Figure 1. Table 2 shows that for both the non-microemulsified RG30 treated oil and microemulsified RG30ME treated oil at 500ppm, there were differences observed between these treatments and significantly difference (p<0.05) compared to untreated control throughout the frying cycles. It is estimated from Figure 1 (as indicated by the dotted line), the frying performance of untreated oil in terms of OSI at 5th frying cycle matched the non-microemulsified RG30 and microemulsified RG30ME treated oil: 500 ppm at 35th and 47th frying cycle respectively and microemulsified RG30ME treated oil: 250 ppm at 19th frying cycle (Table 2).
Table 2. Changes in induction period (hours at 100°C) of soybean oil during frying.
| Characteristics | Frying cycles | Frying systems | |||
|---|---|---|---|---|---|
| NC | T1 | T2 | T3 | ||
| Induction period (h) at 100°C | 0 | 9.85 ± 0.49Ba | 15.03 ± 0.39Fc | 12.13 ± 0.11Fb | 15.05 ± 0.57Fc |
| 10 | 8.13 ± 0.11Aa | 13.00 ± 0.35Ed | 10.25 ± 0.14Eb | 12.20 ± 0.21Ec | |
| 20 | 7.85 ± 0.14Aa | 10.65 ± 0.07Dc | 8.93 ± 0.04Db | 10.55 ± 0.21Dc | |
| 30 | 7.75 ± 0.28Aa | 9.45 ± 0.07Cb | 8.18 ± 0.04Ca | 9.78 ± 0.32Cb | |
| 40 | 7.55 ± 0.42Aa | 8.55 ± 0.14ABb | 7.80 ± 0.14BCa | 9.18 ± 0.11BCb | |
| 50 | 7.53 ± 0.39Aa | 8.88 ± 0.25ABCb | 7.60 ± 0.14ABa | 8.93 ± 0.11Bb | |
| 60 | 8.25 ± 1.06Aa | 9.15 ± 0.85BCa | 7.75 ± 0.42BCa | 8.90 ± 0.21Ba | |
| 70 | 7.30 ± 0.35Aa | 8.18 ± 0.18Ab | 7.25 ± 0.14Aa | 8.00 ± 0.21Ab | |
A-FMeans within a column (between frying cycles) with different letters are significantly different (p<0.05)
a-dMeans within a row (between treatments) with different letters are significantly different (p<0.05).
Total polar compound (TPC)
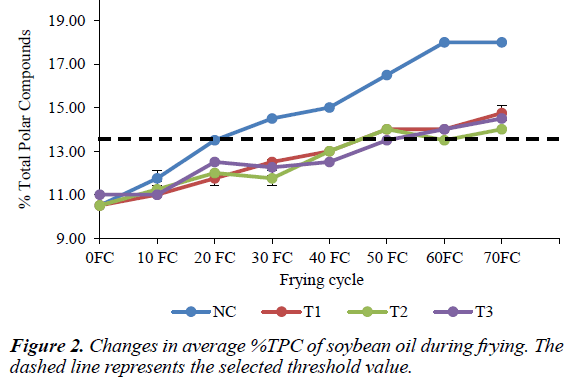
Total polar content is one of the key quality parameters to judge the quality of cooking oil or frying oil. The polar compounds are results of oxidation of fat or oil during deep-fat frying. As oxidation progresses, polarity of byproducts of oxidation increases and it results in fat deterioration. The maximum level of polar content should not exceed 25 g/100 g oil (i.e. 25%) [8-11]. Table 3 shows that TPC generally increased with frying time in all the treatments but none of the treatments reached the 25% limit. Figure 2 also shows that TPC of untreated oil remained significantly (p<0.05) higher as compared to the other treatments throughout the frying process, indicating the improvement in the frying performance of antioxidant treated oil. It is estimated from Figure 2 (as indicated by the dotted line), the frying performance of untreated oil in terms of TPC at 20th frying cycle (which is about half the 25% limit) matched the non-microemulsified RG30 and microemulsified RG30ME treated oil: 500 ppm at 45th and 50th frying cycle respectively and microemulsified RG30ME treated oil: 250 ppm at 45th frying cycle.
Table 3. Changes in induction period (hours at 100°C) of soybean oil during frying.
| Characteristics | Frying cycles | Frying systems | |||
|---|---|---|---|---|---|
| NC | T1 | T2 | T3 | ||
| Total Polar Compound (%) | 0 | 10.50 ± 0.00Aa | 10.50 ± 0.00Aa | 10.50 ± 0.00Aa | 11.00 ± 0.00Ab |
| 10 | 11.75 ± 0.35Bb | 11.00 ± 0.00Ba | 11.25 ± 0.35Bab | 11.00 ± 0.00Aa | |
| 20 | 13.50 ± 0.00Cc | 11.75 ± 0.35Ca | 12.00 ± 0.00Ca | 12.50 ± 0.00Bb | |
| 30 | 14.50 ± 0.00Dc | 12.50 ± 0.00Db | 11.75 ± 0.35Ca | 12.25 ± 0.35Bab | |
| 40 | 15.00 ± 0.00Db | 13.00 ± 0.00Ea | 13.00 ± 0.00Da | 12.50 ± 0.00Ba | |
| 50 | 16.50 ± 0.00Ec | 14.00 ± 0.00Fb | 14.00 ± 0.00Fb | 13.50 ± 0.00Ca | |
| 60 | 18.00 ± 0.00Fb | 14.00 ± 0.00Fa | 13.50 ± 0.00Ea | 14.00 ± 0.00Da | |
| 70 | 18.00 ± 0.00Fc | 14.75 ± 0.35Gb | 14.00 ± 0.00Fa | 14.50 ± 0.00Eb | |
A-GMeans within a column (between frying cycles) with different letters are significantly different (p<0.05)
a-cMeans within a row (between treatments) with different letters are significantly different (p<0.05).
Peroxide value (PV), p-Anisidine value (AV) and TOTOX value
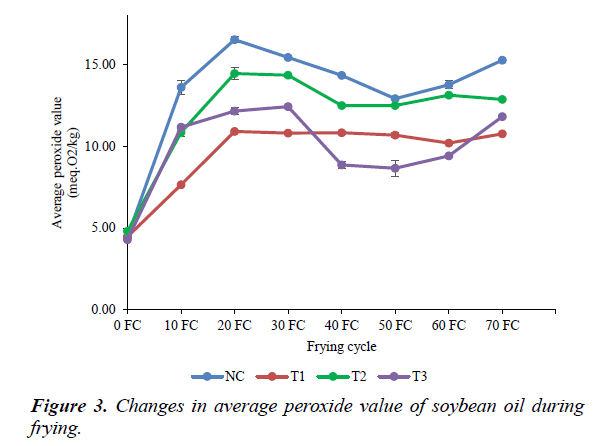
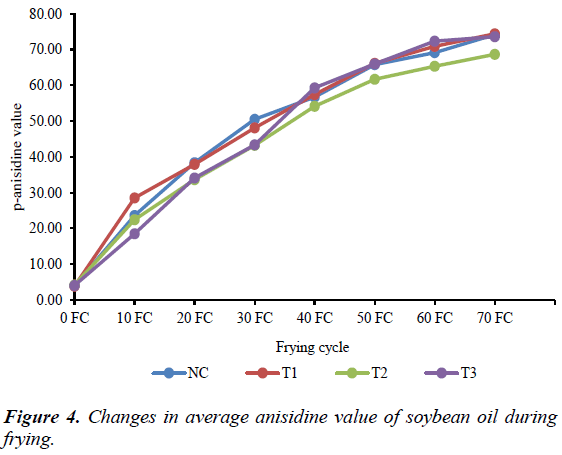
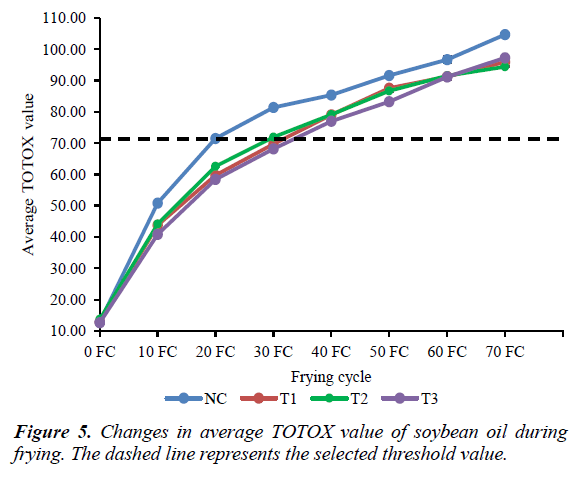
PV is a measure of the amount of peroxides formed in the fats and oils throughout the oxidation process. However, peroxides in oxidized oils are unstable intermediates, which decompose into various carbonyls and other secondary oxidation byproducts readily, principally 2-alkenals and 2, 4-dienals. Typically, when used on oils during frying, PV can be very misleading as peroxides are destroyed under frying conditions and the AV is a more meaningful test than PV for oils during frying because it measures aldehydes which are less easily destroyed under these conditions. The PV and AV results obtained in this trial are shown in Figures 3 and 4 respectively. The PV generally rose and fell during frying, which the same pattern is observed for peroxides in most deep-fat frying studies. The PV of untreated oil remained significantly (p<0.05) higher as compared to the other treatments throughout the frying process. The results of this study also showed that in all treatments, the formation of peroxides seemed to increase rapidly from 0 to 10th of frying cycle, then generally dropped over the rest of the frying cycles since high heat (~180°C) was used on these systems, peroxides formed during oxidation may have decomposed to secondary oxidation products. Slight increase in PV for untreated oil and microemulsified RG30 treated oil at 500 ppm after 50th frying cycle may be due to some errors during analysis. It is evident that peroxide formation is erratic under these conditions and has a large experimental error while the concentration of secondary byproducts of oxidation significantly (p<0.05) increased with frying time as shown in Figure 4. As such, it would be more appropriate to compare the quality of the oxidized oil using the TOTOX value (defined as 2 × PV + AV) which is a parameter regularly used to determine oil quality [12-14]. Non-microemulsified RG30 treated oil at 500 ppm and microemulsified RG30ME treated oil at 250 ppm and 500 ppm showed lower TOTOX values as compared to untreated oil throughout the frying process shown in Table 4 which indicates the improvement in the frying performance of antioxidant treated oil. TOTOX value increased with frying cycles for all treatments as shown in Figure 5. Microemulsified RG30ME treated oil also consistently showed lower TOTOX as compared to non-microemulsified RG30 treated oil at the same inclusion rate of 500 ppm from 0th-60th frying cycle. From Figure 5, the frying performance of untreated oil in terms of TOTOX value at 20th frying cycle (before the increase in TOTOX value for all treatments start to slow down) matched the non-microemulsified RG30 and microemulsified RG30ME treated oil: 500 ppm at 32th and 34th frying cycle respectively and microemulsified RG30ME treated oil: 250 ppm at 30th frying cycle.
Table 4. Changes in TOTOX value of soybean oil during frying.
| Characteristics | Frying cycles | Frying systems | |||
|---|---|---|---|---|---|
| NC | T1 | T2 | T3 | ||
| TOTOX value | 0 | 12.90 | 12.78 | 13.72 | 12.59 |
| 10 | 50.80 | 43.80 | 44.14 | 40.85 | |
| 20 | 71.44 | 59.72 | 62.56 | 58.41 | |
| 30 | 81.36 | 69.73 | 71.94 | 68.18 | |
| 40 | 85.39 | 79.03 | 79.09 | 76.98 | |
| 50 | 91.59 | 87.53 | 86.70 | 83.26 | |
| 60 | 96.67 | 91.24 | 91.55 | 91.16 | |
| 70 | 104.69 | 95.92 | 94.37 | 97.23 | |
Acid value
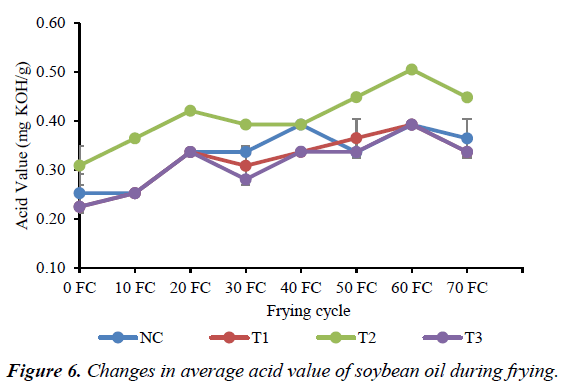
Acid value is the measure of free fatty acids present in the oil and is used to monitor the quality of frying oil. Most of the lipids undergo hydrolysis during frying, liberating free fatty acids resulting in hydrolytic rancidity. Table 5 and Figure 6 show that the acid value for all treatments significantly (p<0.05) increased throughout the frying cycles. Generally, the increase in acid value content could be caused by an increase in rate of hydrolysis when moisture in the substrate is introduced into frying system during frying. Since there was no significant (p<0.05) difference between non-microemulsified RG30 treated oil in comparison to the microemulsified RG30ME treated oil at the same inclusion rate of 500 ppm, it showed that both nonmicroemulsified RG30 liquid and microemulsified RG30ME liquid have no significant role in controlling the hydrolytic rancidity to prevent formation of free fatty acids.
Table 5. Changes in average acid value of soybean oil during frying.
| Characteristics | Frying cycles | Frying systems | |||
|---|---|---|---|---|---|
| NC | T1 | T2 | T3 | ||
| Acid Value (mg KOH/g) | 0 | 0.25 ± 0.04Aab | 0.22 ± 0.00Aa | 0.31 ± 0.04Ab | 0.22 ± 0.00Aa |
| 10 | 0.25 ± 0.00Aa | 0.25 ± 0.00Aa | 0.36 ± 0.00Bb | 0.25 ± 0.00Ba | |
| 20 | 0.34 ± 0.00Ba | 0.34 ± 0.00BCa | 0.42 ± 0.00CDb | 0.34 ± 0.00Da | |
| 30 | 0.34 ± 0.00Bb | 0.31 ± 0.04Bab | 0.39 ± 0.00BCc | 0.28 ± 0.00Ca | |
| 40 | 0.39 ± 0.00Cb | 0.34 ± 0.00BCa | 0.39 ± 0.00BCb | 0.34 ± 0.00Ea | |
| 50 | 0.34 ± 0.00Ba | 0.36 ± 0.04CDa | 0.45 ± 0.00Db | 0.34 ± 0.00Ea | |
| 60 | 0.39 ± 0.00Ca | 0.39 ± 0.00Da | 0.51 ± 0.00Eb | 0.39 ± 0.00Fa | |
| 70 | 0.36 ± 0.04BCa | 0.34 ± 0.00BCa | 0.45 ± 0.00Db | 0.34 ± 0.00DEa | |
A-FMeans within a column (between frying cycles) with different letters are significantly different (p<0.05)
a-cMeans within a row (between treatments) with different letters are significantly different (p<0.05).
Table 6. Changes in average L* value of soybean oil during frying.
| Characteristics | Frying cycles | Frying systems | |||
|---|---|---|---|---|---|
| NC | T1 | T2 | T3 | ||
| L* value | 0 | 64.55 ± 0.01Hc | 64.33 ± 0.01Ha | 64.54 ± 0.01Hc | 64.43 ± 0.00Hb |
| 10 | 63.33 ± 0.01Gc | 63.19 ± 0.01Gb | 62.70 ± 0.02Ga | 63.16 ± 0.01Gb | |
| 20 | 62.64 ± 0.01Fc | 62.29 ± 0.01Fb | 61.57 ± 0.04Fa | 62.28 ± 0.01Fb | |
| 30 | 61.83 ± 0.03Ed | 61.55 ± 0.03Eb | 60.90 ± 0.01Ea | 61.69 ± 0.01Ec | |
| 40 | 61.07 ± 0.01Dc | 60.93 ± 0.01Db | 60.23 ± 0.06Da | 61.27 ± 0.01Dd | |
| 50 | 60.25 ± 0.03Cb | 60.49 ± 0.03Cc | 59.50 ± 0.01Ca | 60.85 ± 0.01Cd | |
| 60 | 59.68 ± 0.02Bb | 60.13 ± 0.01Bc | 59.18 ± 0.03Ba | 60.21 ± 0.00Bd | |
| 70 | 59.28 ± 0.04Ab | 59.64 ± 0.01Ac | 58.86 ± 0.01Aa | 59.82 ± 0.00Ad | |
A-HMeans within a column (between frying cycles) with different letters are significantly different (p<0.05)
a-dMeans within a row (between treatments) with different letters are significantly different (p<0.05).
Colour parameters
Colour, determined by L* (represents the lightness (0 yield black,
100 yield white), a* (represents the redness, negative value
indicates green, positive value indicates red) and b* (represents
the yellowness, negative value indicates blue, positive value
indicate yellow) is a visual indication for the deterioration of
frying oil samples caused by various reactions [15]. Chroma
(calculated by  also reflects colour intensity or
saturation and thus could be a good indicator of consumer
acceptance. Table 6 shows that the L* value for all treatments
significantly (p<0.05) decreased throughout the frying cycles
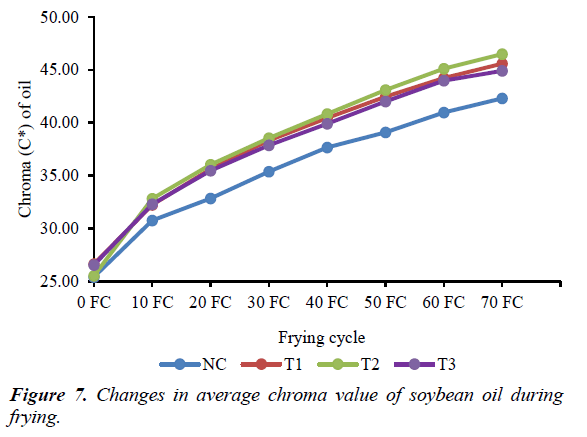
whereas Figure 7 shows that chroma value for all treatments increased throughout the frying cycles. From Table 6, the L*
value for untreated oil was significantly (p<0.05) higher than
that of the other treatments while the chroma value for the
untreated oil was lower than that of the other treatments shown
in Table 7. This is because even though increase in chroma
value can be due to accumulation of non-volatile decomposition
products such as free fatty acids [16], oil treated with natural
antioxidants will darken more than untreated oil due to the
presence of carotenoids [14,17] in rosemary which contributed to the faster increasing in chroma value throughout the frying
cycles. Additionally, gallic acid may complexed with trace
minerals present in the oil, imparting a higher chroma value
throughout the frying cycles. As such, oil colour darkening may
not indicate rapid oxidation and thus may not be the best oil
quality parameter.
Table 7. Changes in average chroma value of soybean oil during frying.
| Characteristics | Frying cycles | Frying systems | |||
|---|---|---|---|---|---|
| NC | T1 | T2 | T3 | ||
| Chroma value | 0 | 25.40 ± 0.02 | 26.64 ± 0.02 | 25.53 ± 0.01 | 26.54 ± 0.00 |
| 10 | 30.74 ± 0.03 | 32.22 ± 0.01 | 32.81 ± 0.01 | 32.29 ± 0.01 | |
| 20 | 32.83 ± 0.04 | 35.62 ± 0.00 | 36.03 ± 0.06 | 35.46 ± 0.02 | |
| 30 | 35.36 ± 0.02 | 38.31 ± 0.03 | 38.54 ± 0.04 | 37.85 ± 0.01 | |
| 40 | 37.66 ± 0.03 | 40.43 ± 0.04 | 40.82 ± 0.05 | 39.90 ± 0.01 | |
| 50 | 39.09 ± 0.01 | 42.46 ± 0.02 | 43.10 ± 0.06 | 42.01 ± 0.01 | |
| 60 | 40.95 ± 0.01 | 44.23 ± 0.04 | 45.11 ± 0.03 | 43.98 ± 0.01 | |
| 70 | 42.30 ± 0.06 | 45.58 ± 0.01 | 46.48 ± 0.00 | 44.89 ± 0.02 | |
Conclusions
The results of this study show that soybean oil treated with microemulsified RG30ME liquid have better frying performance and oxidative stability over the soybean oil treated with similar dosage of non-microemulsified RG30 liquid throughout the frying process which can be attributed to the effect of microemulsion nanotechnology. Table 8 shows the comparison of frying performance in terms of number of extra frying cycles and % improvement by microemulsified RG30ME liquid against untreated control and non-microemulsified RG30 liquid in soybean oil. With this exciting trial data, it supported both the economical and beneficial effect of using microemulsified RG30ME liquid for deep-fat frying application. With extra number of frying cycles and % improvement through better antioxidant utilization efficiency, the microemuslified RG30ME liquid can help food processing companies better differentiate and position in the marketplace.
Table 8. Changes in average L* value of soybean oil during frying.
| Treatment | 250 ppm | |||
|---|---|---|---|---|
| Quality parameters | Vs. Untreated control | |||
| No. of frying cycles | % Improvement | |||
| Induction period | 14 | 280 | ||
| Total polar compound (%) | 25 | 125 | ||
| TOTOX value | 10 | 50 | ||
| 500 ppm | ||||
| Quality parameters | Vs. Untreated control | Vs. Non-microemulsified RG30 liquid | ||
| No. of frying cycles | % Improvement | No. of frying cycles | % Improvement | |
| Induction period | 42 | 940 | 12 | 34 |
| Total polar compound (%) | 30 | 150 | 5 | 11 |
| TOTOX value | 14 | 70 | 2 | 6 |
References
- Garti N. Microemulsions, emulsions, double emulsions and emulsions in food in Formulation Science. Proceeding from formulation forum '97-Association of formulation chemists 1998;1:147-21.
- Garti N, Clement V, Leser M, et al. Sucrose esters microemulsions. J Mol Liq 1999;80:253-96.
- Holmberg K. Quarter century progress and new horizons in microemulsions: Micelles, Microemulsions and Monolayers (1stedn), New York: Dekker 1998;161-91.
- Solans C, Pons R, Kunieda H. Overview of basic aspects of microemulsions: Industrial Applications of Microemulsions. New York: Dekker 1997;66:1-17.
- Spernath A, Yaghmur A, Aserin A, et al. Food Grade Microemulsions Based on Nonionic Emulsifiers: Media to Enhance Lycopene Solubilization. J Agric Food Chem 2002;50:6917-22.
- Spernath A, Yaghmur A, Aserin A, et al. Self-Diffusion Nuclear Magnetic Resonance, Microstructure Transitions, and Solubilization Capacity of Phytosterols and Cholesterol in Winsor IV Food-Grade Microemulsions. J Agric Food Chem 2003;51:2359-64.
- Chow PY, Gue SZ, Leow SK, et al. Solid self-microemulsifying system (S-SMECS) for enhanced bioavailability and pigmentation of highly lipophilic bioactive carotenoid. Powder Technology 2015;274:199-204.
- American Oil Chemists? Society. Acid value of fats and oils, AOCS Of?cial Method Cd 31-63, AOCS International, Urbana, IL 2017.
- American Oil Chemists? Society. p-Anisidine value, AOCS Of?cial Method Cd 18-90, AOCS International, Urbana, IL 2017.
- American Oil Chemists? Society. Peroxide value, AOCS Of?cial Method Cd 8b-90, AOCS International, Urbana, IL 2017.
- Chen WA, Chiu CP, Cheng WC, et al. Total Polar Compounds and Acid Values of Repeatedly Used Frying Oils Measured by Standard and Rapid Methods. JFDS 2012;21:58-65.
- Decker EA, Elias RJ, McClements JD. Oxidation in Foods and Beverages and Antioxidant Applications: Management in Different Industry Sectors. Elsevier 2010;201.
- Moigradean D, Poiana MA, Gogoasa I. JAPT 2012;18(4):272-6.
- Nayak RK, Dash U, Rayaguru K. Quality assessment of mustard oil in deep fat frying. Asian J Dairy & Food Res 2016;35(2):168-71
- Srivastava Y, Semwal AD. A study on monitoring of frying performance and oxidative stability of virgin coconut oil (VCO) during continuous/prolonged deep fat frying process using chemical and FTIR spectroscopy. J Food Sci & Tech 2015;52(2):984-91.
- Sunisa W, Worapong U, Sunisa S, et al. Quality changes of chicken frying oil as affected of frying conditions. Int Food Res J 2011;18:615-20.
- Dumbrava DG, Molddovan C, Raba DN, et al. Vitamin C, chlorophylls, carotenoids and xanthophylls content in some basil (Ocimum basilicum L.) and rosemary (Rosmarinus officinalis L.) leaves extracts. JAPT 2012;18(3):253-8.
