Research Article - Biomedical Research (2017) Volume 28, Issue 6
An image processing framework for white matter segmentation in suspected Alzheimer's disease
Gnana Jebadas D*, Albert Raj ADepartment of Electronics and Communication, DMI Engineering College, Kanayakumari, Tamil Nadu, India
- *Corresponding Author:
- Gnana Jebadas D
Department of Electronics and Communication
DMI Engineering College, Tamil Nadu, India
Accepted date: November 21, 2016
Abstract
White Matter (WM) atrophy is a good marker of cognitive decline and progression of Alzheimer’s disease (AD). Precise segmentation of WM from structural Magnetic Resonance (MR) images is pivotal in the accurate quantification of WM atrophy. An image processing framework for the accurate segmentation of WM is proposed in this article. The proposed framework comprises background removal, restoration of the image with Non-Local Means (NLM) Filter, enhancement with Contrast Limited Adaptive Histogram Equalization (CLAHE), skull stripping and k-Means segmentation with histogram guided initialization. The framework exhibited a mean Dice Similarity Index (DSI) of 87.27% with a standard deviation of ± 5.74, on axial plane MR images of T1 series, from 30 subjects, against manual segmentation as ground truth.
Keywords
Alzheimer’s disease, White matter atrophy, Segmentation, k-Means, Image based biomarkers.
Introduction
Alzheimer’s disease (AD) is a neurodegenerative disorder characterized by progressive cognitive decline [1]. Approximately forty four million people across the globe are either direct victims of Alzheimer’s or the dementia caused by it, indirectly, as per 2016 disease statistics of World Alzheimer’s Society [2]. Investigations to develop methods for its early diagnosis is one of the most live areas of Alzheimer's related research. Early diagnosis of AD enables disease specific treatment before irreversible brain damage or cognitive decline occur. As the methods for early detection of AD, strategies for evaluating the disease progression and the effect of treatment are also equally important. Objective biomarkers can supplement subjective methods for evaluating psychophysiological and mental status, for ruling out AD in its pre-clinical stage and to assess its progress.
As a part of the efforts to develop biomarkers for the early diagnosis of AD, Balthazar et al. specifically observed the involvement of White Matter (WM) atrophy in mild AD [3]. In line with this observation, Frings et al. reported that annual decline of temporal WM volume in AD is larger than controls [4]. Guo et al. also exhibited the confidence that the pattern of WM volume reductions helps to understand the underlying pathologic mechanisms in AD [5]. Through a meta-analysis of the available voxel-based morphometry studies, Li et al. [6] and Wang et al. [7] confirmed the possibility of WM atrophy in AD. Migliaccio et al. concluded that the patterns of WM damage in Early-age Onset Alzheimer's Disease (EOAD) and in its atypical variants such as logopenic variant of Primary Progressive Aphasia (lv-PPA) and Posterior Cortical Atrophy (PCA) are consistent with the psychological symptoms, cognitive decline and Grey Matter (GM) atrophy patterns [8].
Ouyang conducted multimodal canonical correlation analysis and joint independent component analysis to identify the covariance patterns of the grey and white matter atrophy by fusing structural MR and Diffusion Tensor (DT) images [9]. This literature reported that the GM volume is linked with WM fractional anisotropy. Agosta et al. also reported significant and anatomically congruent correlations between WM changes and regional GM atrophy in patients with AD [10].
Brunetti et al. measured the absolute and fractional volumes of WM with an unsupervised multi-parametric post-processing segmentation, based on estimates of relaxation rates (1/T1 and 1/T2) and proton density from spin-echo series [11]. WM fractions significantly correlated with mini-mental status examination and blessed dementia scale. Compared with normal brain segments, AD patients exhibited decreased WM fractions (-9.79 ± 6 2.47%), with the changes more apparent in early onset of the disease.
From the above facts it can be concluded that measurement of WM atrophy from MRI can supplement the information provided by neuropsychological tests during the diagnosis of AD and the assessment of its severity. WM atrophy is a good marker of cognitive decline and progression of AD. It can reflect the volumetric reduction in GM also.
Accurate segmentation of WM is crucial to identify WM atrophy. The conventional methods employed in literature for the segmentation of WM includes Probabilistic Graph Cut (PGC) [12], the combination of PGCs and Geometric Shape Priors (GSP) [13], Fuzzy C-Means (FCM) [14], Density Based Clustering Approach (DBCA) [15] and Region Growing (RG) [16].
Apart from the above methods, a K-Nearest Neighbour (KNN) classifier which uses the spatial as well as intensity information as its feature vector was used by Anbeek et al. [17]. WM, CSF and GM were segmented by Thresholding the probability maps which represents the probability of each voxel to be a member of a particular tissue class, with respect to an arbitrary threshold. The method suggested by Cercignani et al. [18] to segment these tissue classes was based on the 2D histogram of the mean diffusivity and fractional anisotropy derived from the DT images. For the simultaneous segmentation of GM, WM and CSF from image pairs, in N.A. Thacker et al. a series of linear equations were formed which accounts for the proportional tissue volumes in individual voxels [19]. The equations used the prior information of the intensity of pure tissues to derive the proportion of each tissue within the voxels.
In Graph Cut based segmentation the minimum cut criteria sometimes recommend cutting isolated nodes in the graph because of the minimal cut criteria accomplished when such nodes are segregated [12,13]. Except, literature none of the trials were on MR images of AD [14]. However, the performance of FCM employed in this literature depends on the degree of fuzzification and most likely FCM produces empty clusters when employed for segmentation tasks [14]. DBCA segmentation produces satisfactory results if the morphological structures lie sufficiently apart in the greyscale space [15]. The performance of region growing heavily relies on the definition of the initial seed points and the homogeneity criterion [16]. The efficacy of the segmentation in literature depends on the selection of the threshold of probability which decide the membership criterion of voxels to a particular tissue class [17]. The method suggested by Cercignani et al. is exclusively applicable to DT images [18]. Generally, T1 weighted images of MRI are used to characterize the WM atrophy rather than DT. The method suggested by Thacker et al. [19], offers accurate segmentation results only when at least one of the images has a good tissue contrast or the intensity of the tissue classes in the images are just opposite to each other as in image negatives.
The performance of any segmentation method depends on the pre-processing, especially restoration and contrast enhancement, in MR images. As the segmentation methods are not found viable, a fully automated and comprehensive image processing framework which comprises algorithms for restoration as well as enhancement of axial plane structural MR images and segmentation of WM from the pre-processed image without the use of any arbitrary constant or manual intervention is proposed in this article. In section 2 the steps involved in pre-processing and analytical formulation of k- Means segmentation algorithm along with its histogram guided initialization are discussed. In section 3 the segmentation results produced by the proposed framework is objectively evaluated with the help of Dice Similarity Index (DSI) against manual ground truth.
Methodology
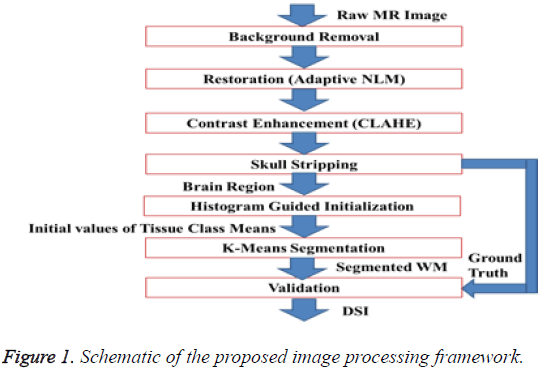
The schematic of the image processing framework, proposed in this article is depicted in Figure 1. The proposed framework comprises background removal, restoration of the image with Non-Local Means (NLM) Filter, enhancement with Contrast Limited Adaptive Histogram Equalization (CLAHE), skull stripping and k-Means segmentation with histogram guided initialization. Background removal, restoration and contrast enhancement fall under ‘pre-processing’. The skull and scalp regions has to be removed from the MR image before the segmentation process because k-Means segmentation produces more reliable outcome when the number of tissue classes are less. But, the presence of background grid with strong edges in the MR image makes the gradient or edge based approaches for skull stripping challenging. Hence, background region is removed before any further steps. Background is removed by multiplying the original MR image with a mask [20]. The mask is constructed by performing a series of morphological operations on the binary edge map of the MR image. The binary edge map of the raw MR image is generated by gradient based Thresholding. The morphological operations performed on the binary edge map include dilation, hole filling, border clearing and erosion. Gradient is computed with Sobel mask. For dilation of the traced edges, horizontal and vertical structuring elements of length three are used. Erosion is performed with a diamond strel object with a length one. Laplacian of Gaussian (LOG) which is an alternative for gradient threshold edge detection, used in background removal has a demerit of Spaghetti effect.
Normally, MR images contain Rician distributed noise. The noise inherent in the image may affect the performance of skull stripping and segmentation of WM. Ordinary spatial filters like Gaussian kernel may remove the noise but they hamper the intensity contrast between GM and WM. Hence, to remove noise from the background eliminated image, a modified configuration of NLM filter which adaptively selects its operational parameters based on the statistics of the noise inherent in the image is used [21,22]. The radius of the search window, radius of similarity window and coefficient of noise variance in the modified NLM are selected as 9, 3 and 7, respectively. The noise variance is computed using the noise estimator kernel proposed by Immerkear [23].
The intensity contrast between the WM and GM has to be improved for the ease of their segmentation. The overall contrast of the image should be appreciable as an intensity based method is used for the skull stripping also. Global Histogram Equalization (GHE) is one of the widely used contrast enhancement technique in medical image computing. GHE disturbs the mean intensity of the image and oversaturates it. In this work, the contrast of the background eliminated image is improved in the proposed framework by using Contrast Limited adaptive Histogram Equalization (CLAHE) [24,25]. CLAHE preserve the mean brightness of the image, does not enhance noise and preserves the information content. The parameter setting of CLAHE suitable for MR images suggested in literature [26] which is tile size=8 × 8, clip limit=0.01 and desired shape of the histogram of the contextual region as ‘exponential’ is followed.
Similar to the background elimination, the skull and scalp regions from the MR image, after restoration and enhancement, are stripped by multiplying the image with a binary multiplication mask. This binary multiplication mask is generated by filling the holes in the Largest connected component with high solidity, in the binary image. In turn, the binary image is obtained via intensity Thresholding the enhanced image against an adaptive threshold, computed using Otsu’s method [27]. The method of brain extraction, based on LCC is simple and algorithmically feasible.
To segment WM from the extracted brain region k-Means segmentation is used. k-Means produce tighter clusters than hierarchical clustering, especially if the clusters are globular. It is computationally faster than hierarchical clustering. The k- Means algorithm is initialized by the mean intensity of tissue classes computed by histogram guided initialization. The concept of histogram guided initialization is as follows, let ‘μ’ be the vector of mean intensity of different tissue classes present in the pre-processed MR image,
 →(1)
→(1)
The range of pixel intensities of the pre-processed MR image is divided into ‘k’ intensity bins, with k+1 intensity points between the maximum and minimum intensity.
 →(2)
→(2)
where, ‘k’ is the number of tissue classes, ‘IH’, the maximum intensity in the pre-processed MR image and ‘IL’, the minimum intensity. As pointed earlier, minimum number of tissue classes ‘k’ in the axial plane MR images is four, GM, WM, CSF and background. The mean of pixel intensities falling within the bin represent the mean intensity of tissue class corresponding to that bin as evident in Equation 3
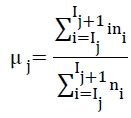 →(3)
→(3)
where ‘i’ is the intensities present in the jth bin and ‘ni’ is the histogram of these intensities. The tissue class mean, estimated from histogram guided method is used to initialize the k-Means algorithm.
k-Means clustering [28] employed for segmenting WM comprises the steps such as initialization of cluster centres, initial clustering, and cluster centre updating and final clustering. In k-Means clustering, let the initialized cluster centres at the first iteration be,
 →(4)
→(4)
The pixel intensities actually present in the pre-processed MR image are redistributed to one of the classes or clusters such that,
 →(5)
→(5)
where, i=1, 2, 3,......,k and j=1, 2, 3,……,k but I ≠ j and Cj is the cluster or tissue class with class mean or cluster centre μj. Generalizing Equation 5, at the nth iterative step,
 →(6)
→(6)
Before the (n+1)th iteration, class means or cluster centres are updated, such that the sum of squared distances from all samples or intensities in the tissue class or cluster Cj (n) to the cluster centre is minimized. In fact, new cluster centre is just mean intensity of the tissue class Cj,
 →(7)
→(7)
where Nj is the number of samples in the cluster Cj at nth iteration Cj (n) and Nj is the number of intensities in the jth tissue class in the pre-processed MR image. The algorithm converges when the condition Equation 8 is satisfied and tissue class mean updating would be terminated.
 →(8)
→(8)
The accuracy of the WM segmentation achieved by the proposed framework is validated by using DSI [29], with manual segmentation as the ground truth. DSI is a modified version of Jaccard Index (JI). The JI estimates what fraction of the composite volume constituted by the volume computed by the automated method and ground truth are concordant.
 →(9)
→(9)
 →(10)
→(10)
where SA and SM represent the area estimated by automated strategy and manual ground truth, respectively. The pre-processing, segmentation of WM and validation is performed in Matlab®.
The images used in this study are Structural MR Images of 30 AD patients (15 males and 15 females, mean age: 69.89 ± 9.78 years) and 30 controls (15 males and 15 females, mean age: 65.84 ± 9.63 years), obtained from Hind Labs, Government Medical College, Kottayam, Kerala, India.
Results
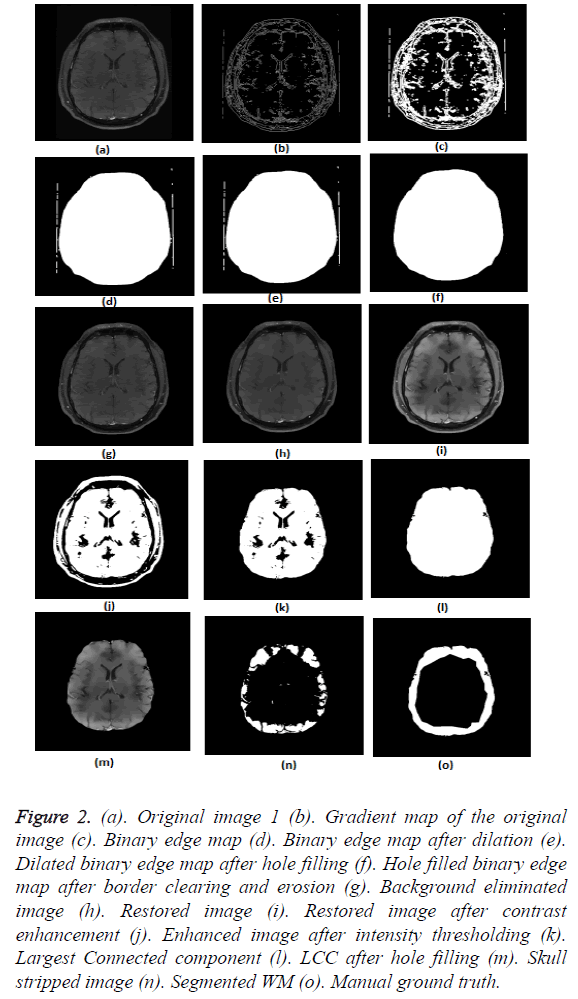
The results of pre-processing and segmentation are depicted in Figure 2. The figure elaborately demonstrates the results at intermediate levels of background elimination (Figures 2b-2g) and skull stripping (Figures 2h-2m), as well.
Figure 2: (a). Original image 1 (b). Gradient map of the original image (c). Binary edge map (d). Binary edge map after dilation (e). Dilated binary edge map after hole filling (f). Hole filled binary edge map after border clearing and erosion (g). Background eliminated image (h). Restored image (i). Restored image after contrast enhancement (j). Enhanced image after intensity thresholding (k). Largest Connected component (l). LCC after hole filling (m). Skull stripped image (n). Segmented WM (o). Manual ground truth.
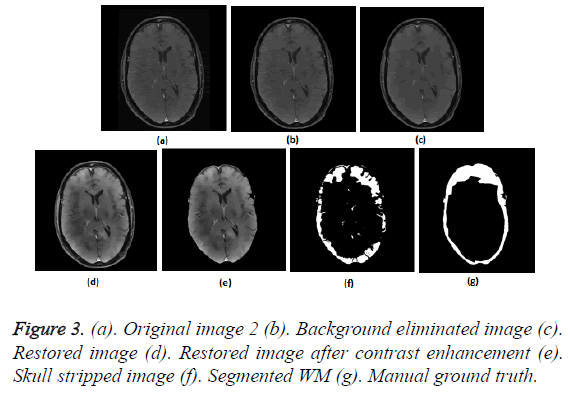
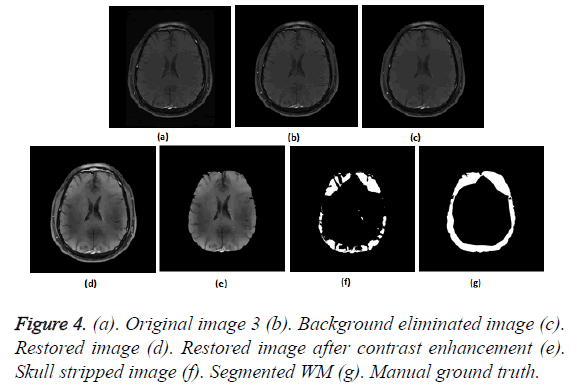
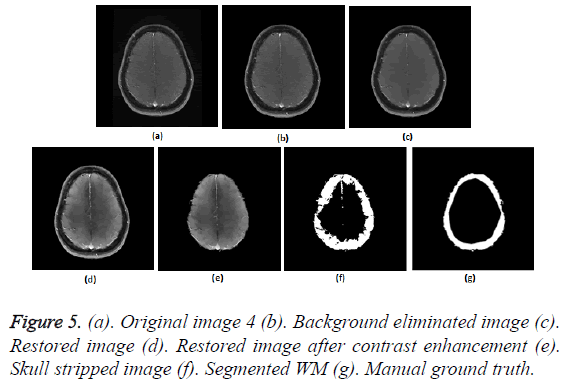
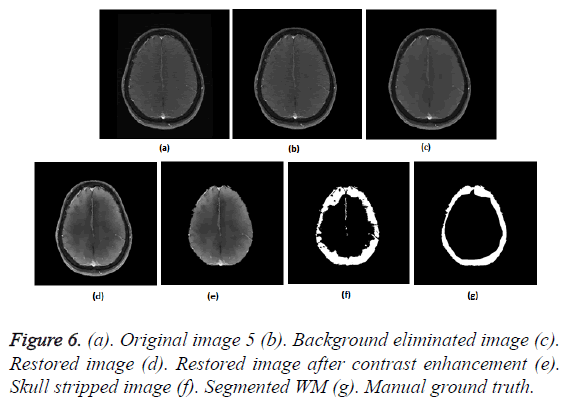
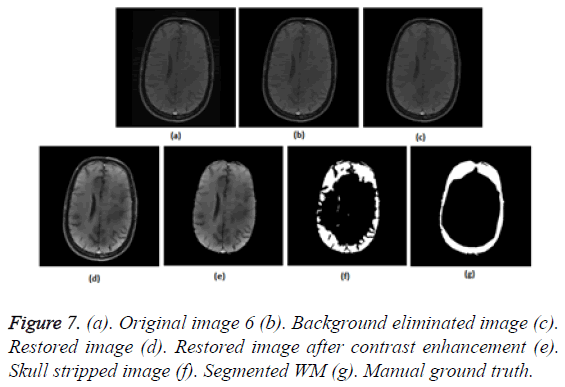
To prove the efficacy of the proposed image processing framework, the results of background elimination, restoration, enhancement and skull stripping on five more test images are illustrated in Figures 3-7.
Figures 2a-2g show the raw MR image with background, the output images at intermediate stages of generation of multiplication mask for background removal and the background eliminated image. It is obvious from the gradient image in Figure 2b that the edges present in the background are equally strong as that of the boundary of the brain region. If the edges in the background image grid, they may affect the skull stripping. The multiplication mask used for background removal is obtained by performing few steps of morphological operations on the binary edge map (Figure 2c) generated by Thresholding the gradient map in Figure 2b. The dilation interconnects and links the pixels in the binary edge map as visible in Figure 2d. Completely connected edges are a mandatory requisite for the hole-filling to be effective. The background elimination mask after hole filling is shown in Figure 2e. Border clearing eliminates the boundary ‘1’s in the multiplication mask and ‘1’s in its 4-connected neighbourhoods and smoothen the irregularity at the outer boundary of the binary multiplication mask. The erosion excludes the edges present in the background as evident in Figures 2f and 2g, Figures 3b and Figure 4b, Figure 5b, Figure 6b and Figure 7b confirms the efficacy of the proposed background elimination strategy on multiple test MR images. It is apparent from the figures that the structures other than the morphologies are removed from the raw MR image after background elimination.
It is apparent from the restored images in Figures 2h, 3c, 4c, 5c, 6c and 7c that adaptive NLM well preserves the weak edges between GM and WM while smoothening the noise inherent in homogeneous regions. It is obvious from the qualitative inspection of the contrast enhanced images in Figures 2i, 3d, 4d, 5d, 6d and 7d that CLAHE has good noise suppression capabilities and the degree of contrast enhancement is sufficient to support characterization of GM and WM such that k-Means can yield accurate segmentation outcomes. It can be observed in Figures 2j, 3e, 4e, 5e, 6e and 7e that the proposed skull stripping is able to extract brain region from the axial plane T1 images, equally well. As skull stripping accurately extracts the brain region, effectively eliminating skull and scalp, the number of tissue classes in the resultant image comes down and this would enhance the accuracy of k-Means segmentation algorithm.
The ground truth of WM furnished in Figures 2g, 3g, 4g, 5g, 6g and 7g are contoured from the skull striped images available in Figures 2m, 3e, 4e, 5e, 6e and 7e. Even after contrast enhancement the grey level contrast between GM and WM is not sufficient to allow manual contouring of WM. Hence, the proposed framework offers WM segmentation better than manual contouring. It is quite impossible to distinguish the WM and GM from the original images available in Figures 2a, 3a, 4a, 5a, 6a and 7a, without pre-processing. The cortical WM segmented by the proposed framework are provided in Figures 2n, 3f, 4f, 5f, 6f and 7f. Against the manual ground truth the framework exhibited a mean Dice Similarity Index (DSI) of 87.27% with a standard deviation of ± 5.74, on axial plane MR images of T1 series, from 30 subjects. This reveals that the WM segmentation produced by the proposed frame work is appreciable and reliable.
Discussions
The methods available in literature [12-19] have focussed only on segmentation of WM. But, the reliability of WM segmentation exclusively depends on the efficacy of preprocessing, especially when the MR image is noisy and intensity contrast between GM and WM is insufficient. This article has introduced a comprehensive image processing framework comprising restoration, enhancement, skull stripping and segmentation with special focus on each. The frame work suggested in this paper is fully automated when compared to methods like RG [16]. The outcome of RG exclusively depends on the manually defined seed point.
The methods already existing [12-19] uses arbitrarily defined parameters. For example, the degree of fuzzification in literature [14], seed point and the homogeneity criterion used in literature [16] and threshold of membership probability [17]. Unlike these methods, the proposed framework adaptively computes the operational parameters of the restoration, enhancement and segmentation algorithms. For example, the threshold of gradient modulus, which is an operational parameter of NLM is computed directly from the standard deviation of noise in the image, rather than specifying it manually. Similarly, the initial values of tissue class mean required for k-Means algorithm is computed adaptively from the input image itself, using a newly proposed method which is histogram guided initialization.
The method suggested by Cercignani et al. [18] is exclusively applicable to DT images. Generally, T1weighted images of MRI are used to characterize the WM atrophy rather than DT. The proposed method is designed for T1 weighted images. Except, literature [14] none of the trials were on MR images of AD. However, the performance of FCM employed in this literature [14] depends on the degree of fuzzification and mostly FCM produces empty clusters when employed for segmentation tasks. It has been observed that the k-Means algorithm used in the proposed framework does not produce empty clusters. DBCA segmentation [15] produces satisfactory results if the morphological structures lie sufficiently apart in the greyscale space. The proposed framework could distinguish GM and WM structures, without depending on the intensity contrast between them significantly. The segmentation method proposed by Thacker et al. works on a pair of images, provided at least one of the images has a good tissue contrast and the intensity of the tissue classes in the second image is just the reverse of the first image [19]. These kind of specific requirements are not appreciable as far as a segmentation algorithm is concerned.
In short, the proposed framework is comprehensive, adaptive, fully automated, exclusively suitable for T1 weighted MRI series, does not produce empty clusters and its performance does not depend on contrast between GM and WM. DSI value of 82% to 93% obtained for the proposed image processing is reflecting that segmented WM region comply well with the manually segmented region.
Conclusions
A complete image processing framework for pre-processing structural MR images and for the segmentation of WM from the pre-processed image is demonstrated in this article. The framework exhibited a mean Dice Similarity Index (DSI) of 87.27 with a standard deviation of ± 5.74, on axial plane MR images of T1 series, from 30 subjects, against manual ground truth. The proposed image processing framework is able to extract the brain parenchyma, accurately eliminating skull, scalp and CSF. The most crucial step in the quantitative analysis of WM atrophy is the segmentation of WM. WM atrophy is a pre-clinical indicator of AD and it is one of the widely used markers for evaluating the disease progression. Consequently, the proposed image processing framework is helpful for the early detection and follow-up of AD.
In continuation to the reported study in this paper, statistical significance of volume computed from the segmented WM to characterize Alzheimer’s related atrophy can be evaluated. The proposed image processing framework can be further modified to devise a scheme for GM segmentation. Perhaps, the whole brain, WM and GM volumes may collectively offer better specificity and sensitivity during the diagnosis of AD in its preclinical stage.
References
- Selkoe DJ, Lansbury PJ.Alzheimers disease is the most common neurodegenerative disorder. Basic Neurochemistry: Molecular, Cellular and Medical Aspects Philadelphia, Lippincott-Raven(6th edn.) 1999.
- Alzheimers Statistics 2016. http://www.alzheimers.net/resources/alzheimers-statistics/
- Balthazar MLF, Yasuda CL, Pereira FR, Pedro T, DamascenoBP, Cendes F. Differences in grey and white matter atrophy in amnestic mild cognitive impairment and mild Alzheimers disease. Eur J Neurol2009; 16: 468-474.
- Frings L, Yew B, Flanagan E, Lam BYK, Hull M, Huppertz HJ. Longitudinal grey and white matter changes in frontotemporal dementia and Alzheimers disease.PLoS ONE 2014; 9.
- Guo X, Wang Z, Li K, Li Z, Qi Z, Jin Z, Yao L, Chen K. Voxel-based assessment of gray and white matter volumes in Alzheimers disease. NeurosciLett2010; 468: 146-150.
- Li J, Pan P, Huang R, Shang H. A meta-analysis of voxel-based morphometry studies of white matter volume alterations in Alzheimers disease. NeurosciBiobehav Rev 2012; 36: 757-763.
- Wang WY, Yu JT, Liu Y, Yin RH, Wang HF, Wang J, Tan L, Radua J, Tan L. Voxel-based meta-analysis of grey matter changes in Alzheimers disease. TranslNeurodegener2015; 4.
- Migliaccio R, Agosta F, Possin KL, Rabinovici GD, Miller BL, Gorno-Tempini ML. White matter atrophy in Alzheimers disease variants.Alzheimers Dementia 2015; 8: S78-S87.
- Ouyang X, Chen K, Yao L, Hu B, Wu X, Ye Q, Guo X. Simultaneous changes in gray matter volume and white matter fractional anisotropy in Alzheimers disease revealed by multimodal CCA and joint ICA. Neurosci 2015; 301: 553-562.
- Agosta F, Pievani M, Sala S, Geroldi C, Galluzzi S, Frisoni GB,Filippi M. White matter damage in Alzheimer disease and its relationship to gray matter atrophy. Radiol 2011; 258: 853-863.
- Brunetti A, Postiglione A, Tedeschi E, Ciarmiello A, Quarantelli M, Covelli EM, Milan G, Larobina M, Soricelli A,Sodano A, Alfano B. Measurement of global brain atrophy in Alzheimers disease with unsupervised segmentation of spin-echo MRI studies. J MagnResonImag2000; 11: 260-266.
- Sen M, Rudra AK, Chowdhury AS, Elnakib A, El-Baz A. Cerebral white matter segmentation using probabilistic graph cut algorithm. Multi-Modality State of the Art Medical Image Segmentation and Registration Methodologies 2nd Chapter 2011; 41-67.
- Chowdhury AS, Rudra AK, Sen M, ElnakibA, El-Baz A. Cerebral white matter segmentation from MRI using probabilistic graph cuts and geometric shape priors. Proc IEEE IntConf Image Proc Hong Kong 2010; 3649-3652.
- Tokunaga C. Fuzzy-based segmentation of brain parenchymal regions with Alzheimers disease into cerebral cortex and white matter in 3.0-T magnetic resonance images. Proc World Autom Cong Kobe 2010; 1-5.
- Roy S, Bhattacharyya DK. Segmentation of cortical grey and white matters from MRI using density based clustering approach. ProcIntSympAdvComputCommun2015; 181-185.
- Wasserthal C, Engel K, Rink K, Brechmann A. Automatic segmentation of the cortical grey and white matter in MRI using a region-growing approach based on anatomical knowledge.Bildverarbeitung Fur Die MedizinInformatikAktuell2008; 437-441.
- Anbeek P, Vincken KL, Bochove GSV, Osch MJPV,Grond JVD. Probabilistic segmentation of brain tissue in MR imaging.NeuroImage 2005; 27: 795-804.
- Cercignani M, Inglese M, Zajdel MS, Filippi M. Segmenting brain white matter, grey matter and cerebro-spinal fluid using diffusion tensor-MRI derived indices. MagnResonImag2001; 19: 1167-1172.
- Thacker NA, Jackson A. Mathematical segmentation of grey matter, white matter and cerebral spinal fluid from MR image pairs.Br J Radiol2001; 74: 234-242.
- Madhukumar S, Santhiyakumari N. Segmentation and volume estimation of tumor edema complex. J Med Imag Health Inform2015; 5: 615-621.
- Joseph J, Sivaraman J, Periyasmay R, Simi VR. Noise based computation of decay control parameter in nonlocal means filter for MRI restoration. J Med Imag Health Inform2016; 6: 1027-1037.
- Joseph J, Sivaraman J, Periyasmay R, Simi VR. An edge preservation index for evaluating nonlinear spatial restoration in MR images.Curr Med Imag Rev2016; 12.
- Immerkear J. Fast noise variance estimation. Comp Vis Image Underst1996; 64: 300-302.
- Karel Z. Contrast limited adaptive histogram equalization. Graphic Gems IV San Diego Acad Press Prof1994; 474-485.
- Pizer SM, Amburn EP, Austin JD, Cromartie R, Geselowitz A, Greer T, Romeny BTH, Zimmerman JB. Adaptive histogram equalization and its variations. Comp Vis Graphics Image Proc1997; 39: 355-368.
- Simi VR, Joseph J. Degradation of geometric, textural and intensity features of MR images with respect to clip-limit and histogram specification in contrast limited adaptive histogram equalization. J Biomed EngSocInd2016; 55-61.
- Otsu N. A threshold selection method from gray-level histograms. IEEE TransSys ManCybern 1979; 9: 62-66.
- Ray S, Turi RH. Determination of number of clusters in k-Means clustering and application in colour image segmentation. Proc 4th IntConfAdvPattRecogn Dig Tech1999; 137-143.
- Lee J, Su H, Cheng PE, Liou M, Aston AD, Tsai AC,Chen CY. MR image segmentation using a power transformation approach. IEEE Trans Med Imag 2009; 28: 894-905.
