Research Article - Journal of Neurology and Neurorehabilitation Research (2016) Volume 1, Issue 1
A Chaos Based Neuro-Cognitive Approach to Study Emotional Arousal In Two Sets Of Hindustani Raga Music
Shankha Sanyal, Archi Banerjee*, Ranjan Sengupta, Dipak GhoshSir C.V. Raman Centre for Physics and Music Jadavpur University, Kolkata 700032, India
- Corresponding Author:
- Archi Banerjee
Sir C.V. Raman Centre for Physics and Music Jadavpur University, Kolkata, India
Tel: 03324142862
E-mail: archibanerjee7@gmail.com
Received date: May 30, 2016; Accepted date: June 14, 2016; Published date: June 17, 2016
DOI: 10.35841/neurology-neurorehabilitation.1.1.19-37
Visit for more related articles at Journal of Neurology and Neurorehabilitation ResearchAbstract
The raga is said to be the soul of Hindustani music. Each raga in Hindustani music is associated with particular or a variety of emotional experiences. In this paper, we took a neurocognitive physics approach to quantitatively evaluate the emotions induced by two sets of Hindustani raga music. The study reports the change in the complexity of EEG brain rhythms while they listen to Hindustani music (instrumental) of contrast emotions. The two set of raga clips chosen for our analysis are Chayanat (romantic/joy) and Darbari Kannada (sad/ pathos) on the first day while Bahar (romantic/joy) and Mian ki Malhar (sad/ pathos) on the second day. 20 subjects voluntarily participated in the EEG study, who were made to listen to 2 min ‘alaap’ section of each raga. Detrended fluctuation analysis (DFA) was used to determine the complexity of neuronal oscillations in 5 electrodes, when the subjects listened to clips of contrast emotions. Alpha and theta brain rhythms were extracted from each of these electrodes and power spectral density (PSD) evaluated to estimate the alpha and theta power in all these electrodes. The results show that the complexity of brain rhythm varies significantly when the emotion of music changes from happy to sad.
Keywords
Hindustani raga music, EEG, Alpha and theta spectral power, Non-linear analysis, Detrended fluctuation analysis
Introduction
Listening to music and appreciating it is a complex process that involves memory, learning and emotions [1,2]. Music is remarkable for its ability to manipulate emotions in listeners [3,4]. The human brain, which is one of the most complex organic systems, involves billions of interacting physiological and chemical processes that give rise to experimentally observed neuro-electrical activity, which is called an electroencephalogram (EEG). The use of EEG signals as a vector of communication between men and machines represents one of the current challenges in signal theory research. However, the exact way in which the brain processes music is still a mystery. There has also been an increased interest in understanding the relation between music and language, to examine brain network that are overlap and unique to these two functions as well in the area of music and emotion. It is a commonly accepted notion that music has the ability to both express emotions and induce emotional responses in the listener. Depending on the way sound waves are listened or pronounced, they have an impact in the way neurological (brain and nerve) system work in the human body. Neurological studies have identified that music is a valuable tool for evaluating the brain system [5]. Its observed that while listening to music, different parts of the brain are involved in processing music, this include the auditory cortex, frontal cortex and even the motor cortex [6]. Research findings indicate some of the cognitive tests are more influenced by exposure to music [7]. The human brain is organized by chaos-a complex non-linear system generating non-linear and non-stationary signals [8-10]. Non-stationarity in brain arise because of different time scales involved in the dynamical process-dynamical parameters are sensitive to the time scales and hence in the study of brain one must identify all relevant time scales involved in the process to get an insight in the working of brain [11]. Non-linear based fractal methods detect nonstationarities in the analyzed signals, which are not easily analyzed by linear methods like FFTs, whose basic drawback is they do not take into account the spikes in EEG signals [12].
Traditionally, the human EEG power spectrum is divided into at least five frequency bands:
(i) delta (δ) 0-4 Hz, (ii) theta (θ) 4-8 Hz, (iii) alpha (α) 8-13 Hz and (iv) beta (β) 13-30 Hz.
Pleasant music causes decrease in alpha power in left frontal lobe whereas unpleasant music produces decrease in alpha power in right frontal lobe [13]. Fm theta has been most often interpreted as a correlate of heightened mental effort and sustained attention required during a multitude of operations. It has also been shown that pleasant music would elicit an increase of Fm theta power [14]. The effect of Indian classical music and rock music on brain activity (EEG) was studied using Detrended fluctuation analysis (DFA) algorithm, and multi scale entropy (MSE) method [15]. Most of us listen to music of our choice during our leisure time or while working /studying. Hence, we sought to find the reactivity of brain to musical clips in the alpha and theta frequency domains.
Music cognition has become a very interesting interdisciplinary subject of research since emotions elicited by music are complex processes comprising of several interacting parameters which are very difficult to assess objectively [16]. Nonetheless, modeling of emotion is also a challenging problem. With the development of neuro-sensors like EEG one can modestly attempt to identify correlates relevant to different specific emotions. Unfortunately, the current global scenario deals the problem without going into details of the intricate waveform of the EEG signal. Fortunately very rich non-linear techniques are accessible to extract relevant correlates of specific emotions using quantitative parameters [17] put forward DFA, which was suitable for the nonstationary time series to investigate the long-range and power-law correlation in EEG signals. The scaling exponent computed from this technique gives a measure of degree of roughness or the irregularity of the EEG signal called the fractal dimension (FD) of the signal. The method was used to detect the related degree within the DNA molecular chain initially, and then it was used widely in fields of life science [18], meteorology [19], hydrology [20], economic [21], etc. DFA method was applied in [22] to show that scale-free long-range correlation properties of the brain electrical activity are modulated by a task of complex visual perception, and further, such modulations also occur during the mental imagery of the same task. In case of music induced emotions, DFA was applied to analyze the scaling pattern of EEG signals in emotional music [23] and particularly Indian music [15]. Applications of fractal dimension in EEG analysis were given in [24,25] where music was used to elicit emotions. In concentration levels of the subjects were recognized from EEG, and FD values were used as the classification features. Music in this subcontinent has great potential in this study because Indian music is melodic and has somewhat different pitch perception mechanisms. Hindustani music is monophonic or quasi monophonic. Unlike the western classical system, there is no special notation system for music. Western classical music is based on harmonic relation between notes. Raga, according to Sanskrit dictionary, is defined as "the act of coloring or dyeing" (the mind in this context) and "any feeling or passion especially love, affection, sympathy, vehement desire, interest, joy, or delight" [26,27]. The melodic mode (raga) structures in the Hindustani music system may demand qualitatively different cognitive engagement. In Hindustani music, ragas are said to be associated with different rasas (emotions). However, one particular raga is not necessarily associated with one emotion; a comprehensive summary is available in Semiosis in Hindusthani Music [28]. There have been a few studies which assess the emotion elicited by different ragas of Hindustani music [29-33]. In the study made by [29], Western listeners were asked to rate the expression of emotions by 12 different ragas. The study made by [31] also studied the Raga-Rasa relationship and on a cross-cultural paradigm where listeners from both India as well as from West participated. A recent study by [33] with 122 participants across the globe revealed that not only a particular raga is capable of eliciting emotion, but the emotional content varies across different portions of the rendition of raganamely alaap and gat. All these are human response studies which strengthen the assumption that Hindustani ragas are powerful elicitor of emotion.
Very few studies were conducted by biosensors and robust algorithm in this domain to study the cognition in Hindustani music [34-36] the most interesting of which is the comparison of retention of the ragas in Hindustani music in the brain using DFA technique [35]. So, we chose, two sets of ragas- Chayanat and Darbari; Bahaar and Mian ki Malhar, which according to the text is said to evoke contrast emotions and studied their brain electrical response with the help of various linear as well as non-linear techniques. The musical stimuli consisted of 2 minutes of alaap part of each raga played in the same sitar by the same artist. This was done to avoid any disparity in emotion identification which may arise due to change in timbral parameters. The 4 musical clips were first standardized on the basis of a listening test comprising of 50 participants where they were asked to mark the clips according to the emotions perceived in a response sheet. Next, 20 participants chosen arbitrarily from the set of 50 respondents who participated in the listening test and EEG data was recorded for the 20 participants following the same procedure as used in Banerjee et al. Only the EEG experiment using the set of two new ragas were conducted after a span of two weeks. We used a widely used non-linear technique, DFA to assess the scaling pattern of EEG signals. The advantage of using this model is that we can define the arousal and valence levels of emotion with the help of calculated FD values. Although there is an emerging picture of the relationship between induced emotions and brain activity, there is a need for further refinement and exploration of neural correlates of emotional responses induced by music. In view of this, the present investigation attempts to assess in-depth the effect of two pairs of contrasting sets of instrumental Hindustani classical musical stimuli on EEG pattern of human brain quantitatively using the DFA technique and the power spectral intensity (PSI) study of alpha and theta brain rhythms. This paper is essentially the report of new, quantitative data on the effect of Hindustani musical stimuli in human brain.
Materials and Methods
A. Subjects summary
50 subjects (M=32, F=18) participated in the listening test consisting of the 4 ragas of Hindustani classical music-Chayanat, Darbari, Bahar and Mia ki Malhar. They were asked to mark the clips according their emotional content in a response sheet like the one given in Table 1. The data obtained from the listening test was analyzed with the help of a percentage created on the basis of response obtained across different clips. From the confusion matrix, the emotional ratings corresponding to different clips were obtained with different confidence intervals. Out of the 50 participants who participated in the listening tests, 20 musically untrained subjects (M=14, F=6) chosen arbitrarily voluntarily participated in this study. The average age was 23 (SD=1.5 years) years and average body weight was 70 kg. Informed consent was obtained from each subject according to the guidelines of the Ethical Committee of Jadavpur University. All experiments were performed at the Sir C.V. Raman Centre for Physics and Music, Jadavpur University, Kolkata. The experiment was conducted in the afternoon in a normally conditioned room sitting on a comfortable chair and performed as per the guidelines of the Institutional Ethics Committee of SSN College for human volunteer research.
| Name of the informant: | Age: | Sex: | ||
|---|---|---|---|---|
| Clip 1 | Clip 2 | Clip 3 | Clip 4 | |
| Anger | ||||
| Heroic | ||||
| Joy | ||||
| Romantic | ||||
| Serenity | ||||
| Devotion | ||||
| Sorrow | ||||
| Anxiety | ||||
| Others (Mention) | ||||
Table 1: Emotional response sheet given to listeners.
B. Experimental details
A listening test was conducted on 50 subjects and the emotional responses corresponding to the two sets of Hindustani raga clips were standardized as elaborated in Table 1. Next, EEG was taken with the same sets of musical clips for randomly chosen 20 subjects in a gap of 2 weeks. On the first day, the two ragas chosen for our analysis were “Chhayanat” (romantic/joy) and “Darbari Kannada” (pathos/ sorrow). On the second day the two ragas were “Bahaar” (joy) and “Mia ki Malhar” (sorrow/pathos).
From the complete playing of the ragas, segments of about 2 minutes were cut out for analysis of each raga. The emotional part of each clip was identified with the help of experienced musicians. Variations in the timbre were avoided by making the same artist play the two ragas with the same sitar. Amplitude normalization was done for both the signals therefore loudness cues were not present. Each of these sound signals was digitized at the sample rate of 44.1 KHZ, 16 bit resolution and in a mono channel. A sound system (Logitech R Z-4 speakers) with high S/N ratio was used in the measurement room for giving music input to the subjects.
C. Experimental protocol
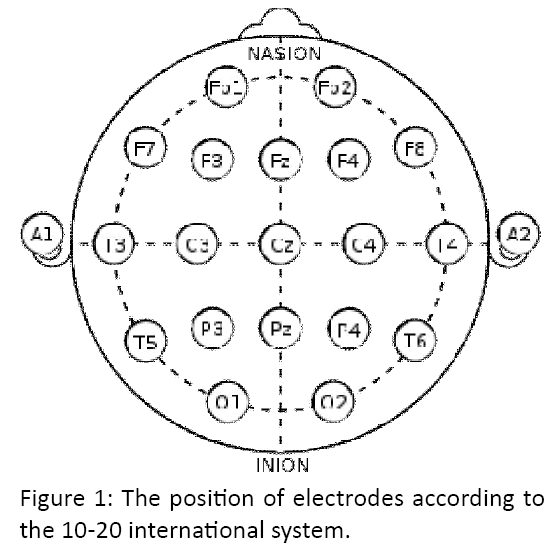
Since the objective of this study was to analyze the effect of Hindustani classical music on brain activity during the normal relaxing condition, the frontal lobe was selected for the study. EEG was done to record the brain-electrical response of two male subjects. Each subject was prepared with an EEG recording cap with 19 electrodes (Ag/AgCl sintered ring electrodes) placed in the international 10/20 system referenced to A1 and A2 electrodes, grounded to FPz electrode. Figure 1 depicts the positions of the electrodes. Impedances were checked below 5 kOhms. The EEG recording system (Recorders and Medicare Systems) was operated at 256 samples/s recording on customized software of RMS. The data was band-pass-filtered between 0.5 and 35 Hz to remove DC drifts and suppress the 50 Hz power line interference. Each subject was seated comfortably in a relaxed condition in a chair in a shielded measurement cabin. They were also asked to close their eyes. On the first day after initialization, a 14 min recording period was started, and the following protocol was followed:
1. 2 mins - No Music
2. 2 mins - with Drone
3. 2 mins - With Music 1 (Chhayanat)
4. 2 mins - No Music
5. 2 mins - With Music 2 (Darbari Kannada)
6. 2 mins - No Music (Eyes closed)
7. 2 mins - No Music
On the second day, the same protocol was followed, only Music 1 and Music 2 have been replaced by “Bahar” and “Mian Ki Malhar” respectively.
Methodology
Earlier work based on power spectral analysis speaks in favour of hemispheric lateralization of brain, when it comes to processing of emotions [37,38]. In these works it was seen that the left hemisphere is mostly involved in processing positive emotions while the right hemisphere is engaged in processing of negative emotions. The decrease in alpha power is seen as an indicator of arousal based activity, while Frontal midline (Fm) theta increases as an indicator of pleasantness of music. In this study, we look to put forward a comparative study which links the spectral power values in the linear domain to the alpha and theta scaling exponents obtained from the DFA technique. In order to eliminate all frequencies outside the range of interest, data was band pass filtered with a 0.5-35 Hz FIR filter. The amplitude envelope of the alpha (8-13 Hz) and theta (4-8 Hz) frequency range was obtained using wavelet transform technique proposed by [39]. The amplitude envelope of the different frequency rhythms were obtained for ‘before music’, ‘with music’ as well as ‘without music’ conditions for the five frontal electrodes (F3, F4, F7, F8 and Fz). A number of studies validated the importance of frontal electrodes in case of processing of emotions [35,40-43]. So, we chose to study the variation of scaling exponent corresponding to various frequency rhythms in the five frontal electrodes while listening to music of contrast emotions.
Power spectral intensity (PSI)
To the time series data [x1, x2, ......, xN] we perform the fast fourier transform (FFT) and the result obtained is denoted as [X1, X2, ......, XN] . A continuous frequency band from flow to fup is sliced into K bins, which can be of equal width or not. The bins used are δ (0.5-4 Hz), θ (4-7 Hz), α (8-12Hz), β (12-30 Hz), and γ (30-50 Hz). For these bins, we have band = [0.5, 4, 7, 12, 30, 50]. The PSI of the kth bin is evaluated as given in (7)

Where fs is the sampling rate, and N is the series length. The alpha and theta power values have been computed using the above algorithm for the five frontal electrodes corresponding to various experimental conditions. Our approach divides each 120 sec data epoch into 8 windows, 30 sec wide with each window overlapping the previous by 15 sec. Each window is converted into the frequency domain using FFT. The frequency descriptors of the power bands, delta and alpha rhythms are extracted. The average power corresponding to each experimental condition was computed for all the frontal electrodes. The error bars give the SD values computed from the different values of spectral power for each electrode.
Detrended fluctuation analysis
DFA was introduced by17, as a method for the determination of monofractal scaling properties and the detection of long range correlations in non-stationary signals. The amplitude envelope corresponding to alpha and theta frequency rhythms of total length N is first integrated and then divided into segments of length s. The procedures to compute DFA of a time series [x1, x2,... xN] are as follows. First integrate x into a new series y = [y(1),...,y(N)], where
 eq. (1) and
  is the average of x1, x2,... xN
The root-mean-square fluctuation of the integrated series is calculated by
 eq. (2)
Where  the part is called Detrending.
The relationship between the Detrended series and interval lengths can be expressed as
F(n) ∝ nα eq. (3)
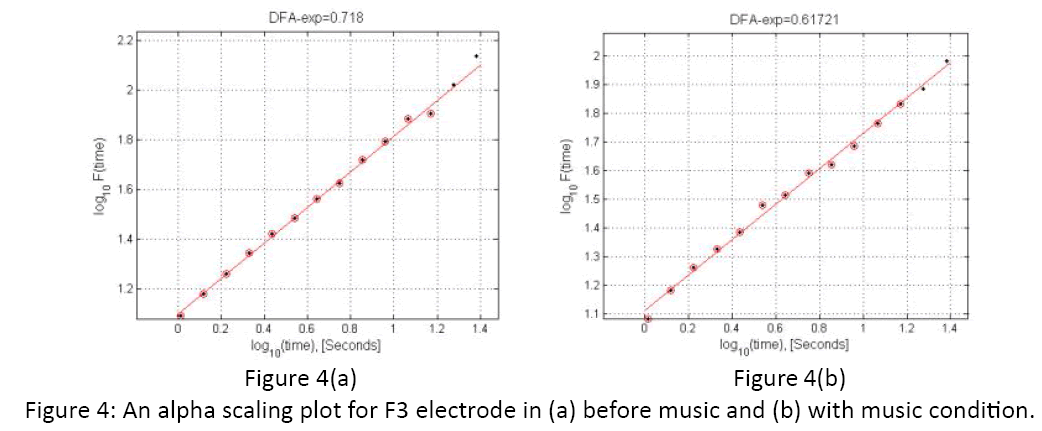
Where α is expressed as the slope of a double logarithmic plot log [F(n)] versus log(n). The parameter α17 (scaling exponent, autocorrelation exponent, self-similarity parameter etc) represents the autocorrelation properties of the signal. When applied to EEG data with LRTC, power-law behavior will generate scaling exponents with greater than 0.5 and less than 1. As the scaling exponent increases from 0.5-1, the LRTC in the EEG are more persistent (decaying more slowly with time). If a scaling exponent is greater than 1, the LRTC no longer exhibits power law behavior. Finally, if the scaling exponent=1.5, this indicates Brownian noise, which is the integration of white noise. DFA technique was applied following the NBT algorithm used in [44]. This technique extracts the amplitude envelope corresponding to each frequency rhythm and the scaling exponent is computed for all the experimental conditions and all the electrodes. The variation of α in the various experimental conditions in different electrodes has been used as a parameter to quantify emotional arousal corresponding to all the musical clips.
Results and Discussions
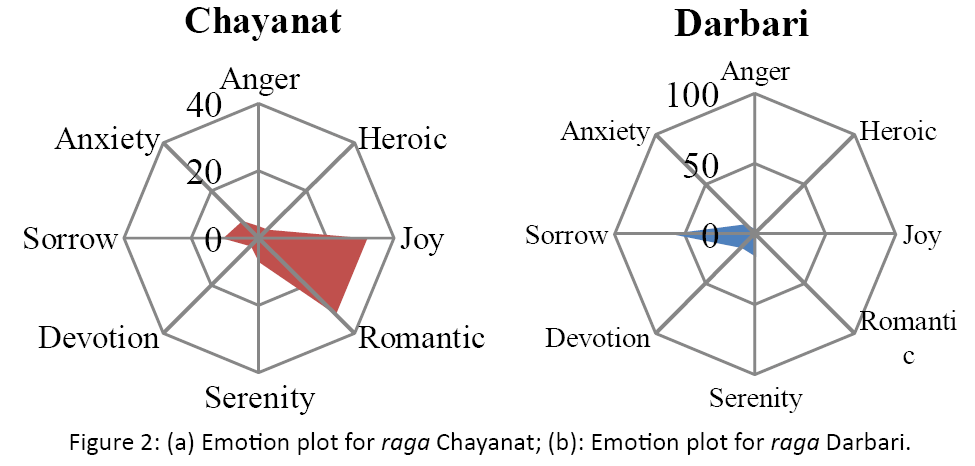
On the basis of listening test data, the following Table 2 is prepared which gives the percentage of listeners who chose a particular emotion in response to the raga clips. On the basis of Table 2, the following radar graphs are drawn (Figure 2a-2d), which clearly indicate that the two sets of Raga clips chosen for our analysis evoke, in general contrasting emotions, though the strength or the intensity of perceived emotions vary significantly from one clip to the other.
Raga |
Anger | Heroic | Joy | Romantic | Serenity | Devotion | Sorrow | Anxiety |
|---|---|---|---|---|---|---|---|---|
Chayanat |
3.57 | 3.57 | 32.14 | 32.14 | 7.14 | 3.57 | 10.71 | 7.14 |
Darbari |
3.45 | 0 | 6.9 | 0 | 15.69 | 13.79 | 60.13 | 10.35 |
Bahar |
2.36 | 3.48 | 69.45 | 11.33 | 3.28 | 3.23 | 3.25 | 3.42 |
Mian ki Mallhar |
0 | 2.04 | 2.12 | 8.59 | 14.44 | 6.42 | 58.68 | 7.68 |
Table 2: Strength of emotional response of a Raga from listening test of 50 informants (in %).
As is evident from the plots, the emotional content of the two sets of 2 min Hindustani raga clips chosen for our study are in complete contrast to one another. The emotional quantity of raga Chayanat varies between joy and romantic with 60% accuracy, which we consider as positive, while that for Darbari varies somewhere in the opposite axis i.e. sorrow-devotion axis with about 60% accuracy for sorrow and 30% for serenity and devotion. For the 2nd set, the values are more precise, having almost 70% accuracy in the joy axis for raga Bahar, while the other raga Mian ki Malhar reports almost 60% accuracy in the sorrow axis. In this way, we have standardized the 4 clips that were chosen for our study and moved on to crosscheck our hypothesis in EEG data analysis of 20 subjects who agreed to participate in the EEG study.
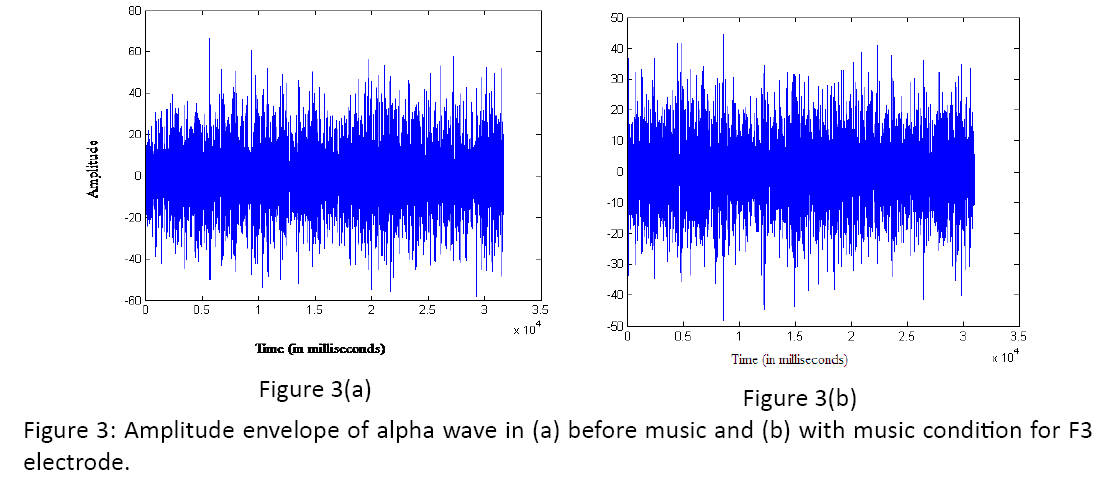
DFA was applied on the extracted amplitude envelopes on a moving window basis with a 30 seconds window size of each experimental interval, taking an overlap of 50% between the windows. A single scaling exponent α was obtained corresponding to each window and thus four scaling exponents were obtained for each experimental condition of 2 minute duration. From the four scaling exponents, weighted average was computed for all the experimental condition. In this way we obtained seven scaling exponents for the total duration of the experimental protocol. A representative figure showing the amplitude envelope of alpha wave as well as a scaling plot of F3 electrode has been given in Figures 3 and 4.
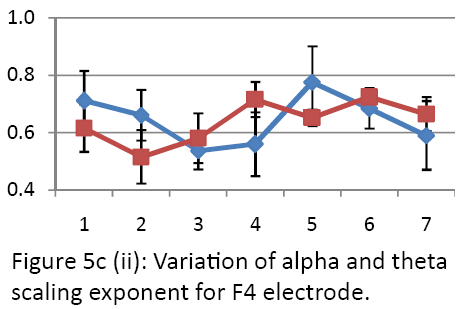
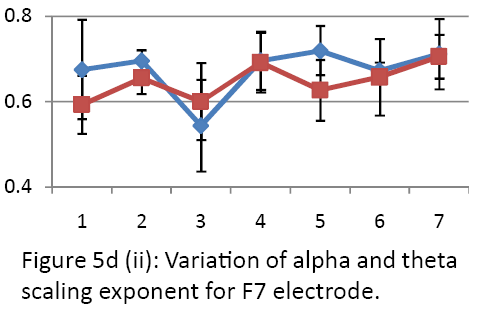
The data for all the participants was averaged and has been given in Table 3 for Day 1 (i.e. for Chayanat and Darbari Kannada) and in Table 4 for Day 2 (i.e. for Bahar and Mia ki Malhar). The numbers 1-7 in the tables below denote the various experimental conditions as described in the methodology section above. The SD values were computed for each experimental condition from the data obtained for the 20 participants and have been given in the table. The SD values have been shown in the form of error bars in the scaling plots. An interesting observation is that, for all the cases, the alpha and theta scaling exponents show a value greater than 0.5 and less than 1, revealing the fact that long range temporal correlations are present in alpha and theta brain waves throughout, irrespective of the stimulus or the removal of it.
| 1 | 2 | 3 | 4 | 5 | 6 | 7 | |||
|---|---|---|---|---|---|---|---|---|---|
| F3 | Theta | 0.62 ± 0.12 | 0.65 ± 0.02 | 0.60 ± 0.02 | 0.66 ± 0.03 | 0.70 ± 0.05 | 0.73 ± 0.03 | 0.63 ± 0.05 | |
| Alpha | 0.60 ± 0.08 | 0.52 ± 0.02 | 0.43 ± 0.03 | 0.63 ± 0.02 | 0.58 ± 0.77 | 0.66 ± 0.05 | 0.66 | ± 0.04 | |
| F4 | Theta | 0.71 ± 0.10 | 0.66 ± 0.08 | 0.53 ± 0.06 | 0.56 ± 0.11 | 0.77 ± 0.12 | 0.68 ± 0.07 | 0.59 | ± 0.12 |
| Alpha | 0.62 ± 0.08 | 0.51 ± 0.09 | 0.58 ± 0.09 | 0.71 ± 0.06 | 0.65 ± 0.03 | 0.72 ± 0.03 | 0.66 | ± 0.06 | |
| F7 | Theta | 0.68 ± 0.11 | 0.69 ± 0.02 | 0.54 ± 0.11 | 0.69 ± 0.07 | 0.71 ± 0.05 | 0.67 ± 0.02 | 0.71 | ± 0.08 |
| Alpha | 0.59 ± 0.06 | 0.65 ± 0.04 | 0.60 ± 0.09 | 0.69 ± 0.07 | 0.62 ± 0.07 | 0.65 ± 0.09 | 0.70 | ± 0.05 | |
| F8 | Theta | 0.77 ± 0.11 | 0.64 ± 0.07 | 0.61 ± 0.14 | 0.76 ± 0.08 | 0.87 ± 0.06 | 0.77 ± 0.06 | 0.75 | ± 0.09 |
| Alpha | 0.58 ± 0.08 | 0.54 ± 0.09 | 0.59 ± 0.09 | 0.78 ± 0.09 | 0.66 ± 0.05 | 0.76 ± 0.08 | 0.64 | ± 0.02 | |
| Fz | Theta | 0.56 ± 0.04 | 0.60 ± 0.02 | 0.61 ± 0.02 | 0.62 ± 0.08 | 0.69 ± 0.07 | 0.66 ± 0.03 | 0.61 | ± 0.05 |
| Alpha | 0.61 ± 0.04 | 0.52 ± 0.08 | 0.54 ± 0.02 | 0.68 ± 0.02 | 0.66 ± 0.03 | 0.62 ± 0.02 | 0.65 | ± 0.08 | |
Table 3: Scaling exponent α computed for different experimental conditions on Day 1.
| Electrode (for alpha frequency range) | “Before Music” with "Music 1" | “Before Music” with "Music 2" | ||||||
|---|---|---|---|---|---|---|---|---|
| DFA | PSI | DFA | PSI | |||||
| p-value | F-value | p-value | F-value | p-value | F-value | p-value | F-value | |
| F3 | 0.042 | 10.83 | 0.00547 | 29.79 | 0.408 | 0.85 | 0.00547 | 29.79 |
| F4 | 0.0014 | 61.02 | 0.00015 | 196.69 | 0.045 | 9.85 | 0.4 | 0.88 |
| F7 | <0.001 | 1569.76 | 0.189 | 2.5 | 0.0036 | 35.1 | 0.0019 | 52.22 |
| F8 | 0.038 | 10.05 | 0.025 | 11.69 | 0.0162 | 20.93 | 0.0231 | 13.5 |
| Fz | 0.175 | 2.7 | 0.9251 | 0.01 | 0.44104 | 0.73 | 0.83 | 0.05 |
Table 4: ANOVA results for alpha frequency range for Day 1.
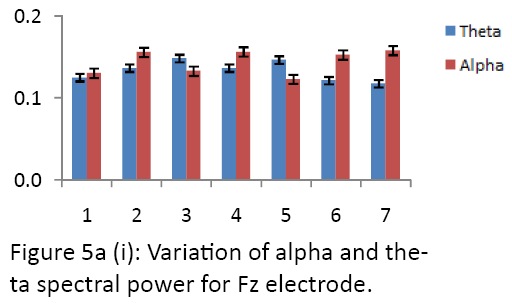
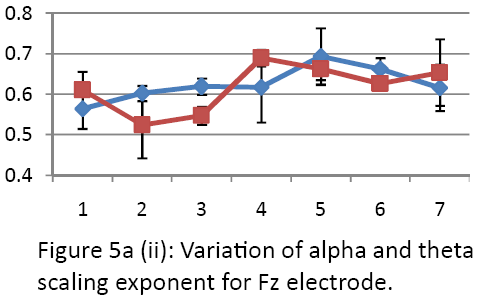
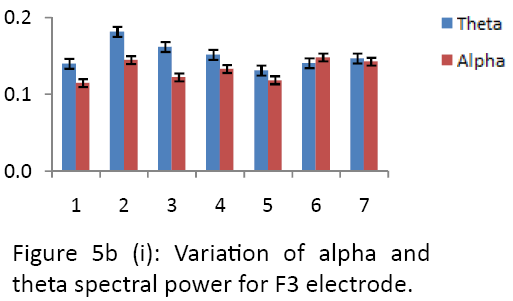
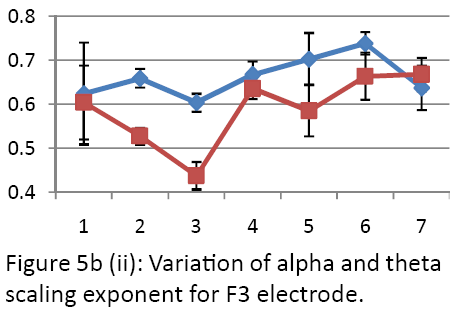
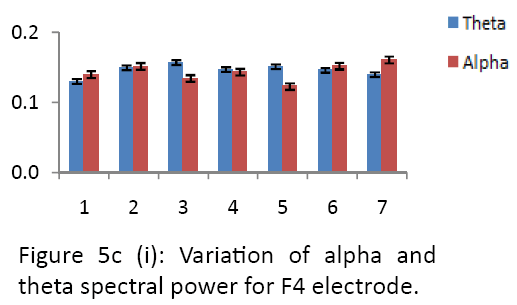
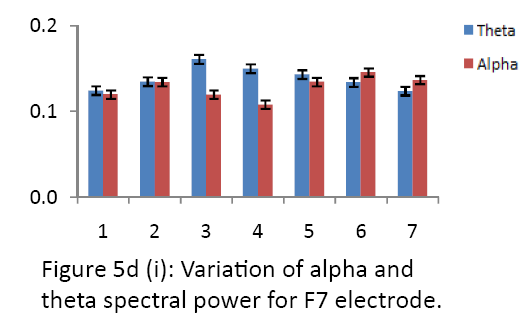
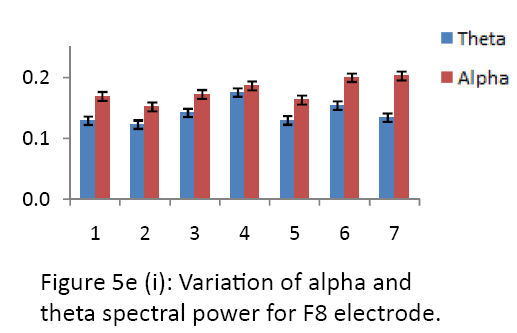
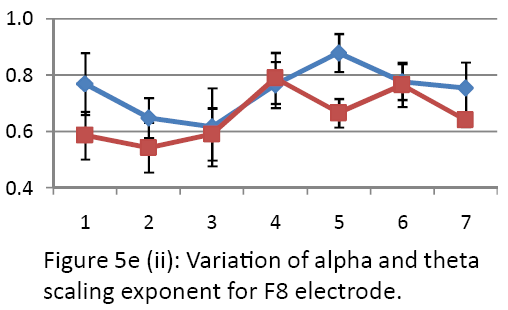
The PSI values of alpha and theta waves were computed from the FFT data of all the frontal electrodes. Figure 5a-5e shows the variation of alpha and theta spectral power values as well as the corresponding scaling exponents for the different experimental conditions in Day 1. The numbers 1-7 in the X-axis signify the different experimental conditions as described in the methodology section above.
In case of odd electrodes i.e. F3 and F7, it is seen from the figures that theta power increases initially on the application of drone, falls on the application of 1st music i.e. Chayanat (which is happy music clip). The scaling exponent α also follows the same trend as is given by spectral power data which shows that the complexity of EEG signals in theta domain increase during drone sound, but shows a sharp dip when happy music i.e. Chayanat is played. During the 2nd music (i.e. Darbari Kannada or sad/pathos music clip) theta power rises again but lower than that of the 1st music, the complexity value increases sharply for the 2nd music, much higher than the 1st music. After the removal of music, theta power as well as complexity decreases gradually after a particular interval of time. In case of alpha frequency domain, spectral power drops for both the 1st and 2nd music in case of odd electrodes. The complexity analysis also follows the same trend, where the 1st and 2nd music causes a drop in complexity, but the 1st music induces a greater dip compared to the 2nd music. The scaling exponent α increases gradually, after the removal of music, and reaches almost to the initial state after a certain interval of time. In case of even electrodes, both F4 and F8, theta power increases both during 1st and 2nd music and decreases gradually after that. The theta scaling exponent decreases during the 1st music and shows a sharp increase during the 2nd music, while the complexity decreases gradually after the removal of 2nd music. In case of alpha frequency domain, the even electrodes, both in F4 and F8, the 1st music cause an increase in complexity while the 2nd music causes a sharp dip in complexity. After the removal of music, the complexity increases gradually. The alpha spectral power also follows the same trend. Interestingly, in the midline frontal electrode, Fz, Fm theta increases for both the 1st and 2nd music, showing that the subjects found both the music pleasant irrespective of the emotional content of the music. The standard deviation values calculated for each of the experimental condition have been shown as error bars in all the above figures. To verify the statistical significance of the data ANOVA tests were performed using the SPSS software for Windows [45]. For each electrode, the p-value was calculated for the two experimental conditions - “before music” and “with Music 1” as well as “before music” and “with Music 2”. The significant value was set to p=0.05 in One Way ANOVA performed here. The results for the ANOVA analysis corresponding to alpha and theta frequency rhythm for the two conditions selected are given in Tables 4 and 5. It is seen that in Fz electrode, the significance level is lowest. It is also verified from the figures that the amount of arousal is lowest in the Fz electrode. All the analysis was performed with 90% confidence interval. The p-values have been found to be below significant for F3 electrode for the 2nd clip. A number of electrodes showed lower significance ratio in case of the 2nd clip, which was supposed to evoke negative emotion both in the power spectral as well as scaling exponent data. The scaling exponents corresponding to various experimental conditions have been given in Table 6 for the 2nd day.
| Electrode (for theta frequency range) | “Before Music” with "Music 1" | “Before Music” with "Music 2" | ||||||
|---|---|---|---|---|---|---|---|---|
| DFA | PSI | DFA | PSI | |||||
| p-value | F-value | p-value | F-value | p- value | F-value | p- value | F-value | |
| F3 | 0.017 | 15.11 | 0.0054 | 29.79 | 0.108 | 4.25 | 0.25 | 0.643 |
| F4 | 0.004 | 32.59 | 0.0058 | 28.8 | 0.152 | 3.11 | <0.001 | 387.6 |
| F7 | <0.001 | 979.61 | 0.045 | 8.21 | 0.013 | 18.19 | 0.33 | 1.19 |
| F8 | 0.002 | 49.09 | 0.74 | 0.13 | 0.643 | 0.25 | 0.09 | 7.01 |
| Fz | 0.64 | 0.25 | 0.13 | 0.73 | 0.192 | 2.45 | 0.187 | 2.52 |
Table 5: ANOVA results for theta frequency range for Day 1.
| 1 | 2 | 3 | 4 | 5 | 6 | 7 | |||||
|---|---|---|---|---|---|---|---|---|---|---|---|
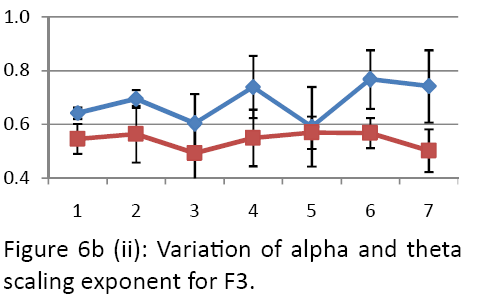
| F3 | Theta | 0.64 ± 0.02 | 0.69 ± 0.03 | 0.60 | ± 0.11 | 0.74 | ± 0.11 | 0.59 | ± 0.14 | 0.76 ± 0.10 | 0.74 ± 0.13 |
| Alpha | 0.54 ± 0.06 | 0.56 ± 0.10 | 0.49 | ± 0.11 | 0.55 | ± 0.10 | 0.56 | ± 0.06 | 0.57 ± 0.05 | 0.50 ± 0.07 | |
| F4 | Theta | 0.68 ± 0.07 | 0.66 ± 0.01 | 0.75 | ± 0.09 | 0.88 | ± 0.09 | 0.69 | ± 0.08 | 0.77 ± 0.12 | 0.71 ± 0.02 |
| Alpha | 0.55 ± 0.04 | 0.62 ± 0.06 | 0.46 | ± 0.13 | 0.51 | ± 0.14 | 0.60 | ± 0.05 | 0.54 ± 0.06 | 0.52 ± 0.05 | |
| F7 | Theta | 0.63 ± 0.11 | 0.59 ± 0.04 | 0.81 | ± 0.14 | 0.90 | ± 0.13 | 0.67 | ± 0.05 | 0.84 ± 0.11 | 0.81 ± 0.12 |
| Alpha | 0.63 ± 0.04 | 0.60 ± 0.02 | 0.46 | ± 0.09 | 0.52 | ± 0.09 | 0.64 | ± 0.03 | 0.54 ± 0.07 | 0.60 ± 0.11 | |
| F8 | Theta | 0.61 ± 0.07 | 0.60 ± 0.06 | 0.75 | ± 0.08 | 0.97 | ± 0.06 | 0.80 | ± 0.05 | 0.88 ± 0.11 | 0.82 ± 0.12 |
| Alpha | 0.60 ± 0.05 | 0.69 ± 0.04 | 0.48 | ± 0.15 | 0.63 | ± 0.10 | 0.67 | ± 0.07 | 0.62 ± 0.09 | 0.61 ± 0.08 | |
| Fz | Theta | 0.73 ± 0.04 | 0.72 ± 0.03 | 0.69 | ± 0.05 | 0.73 | ± 0.11 | 0.68 | ± 0.08 | 0.71 ± 0.11 | 0.68 ± 0.09 |
| Alpha | 0.55 ± 0.06 | 0.57 ± 0.06 | 0.57 | ± 0.07 | 0.54 | ± 0.11 | 0.51 | ± 0.07 | 0.53 ± 0.07 | 0.52 ± 0.04 | |
Table 6: Scaling exponent α computed for different experimental conditions on Day 2.
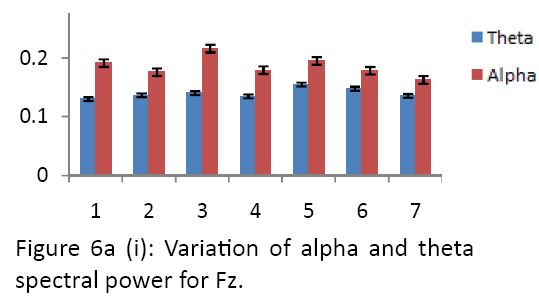
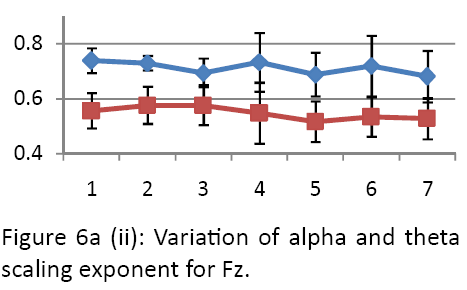
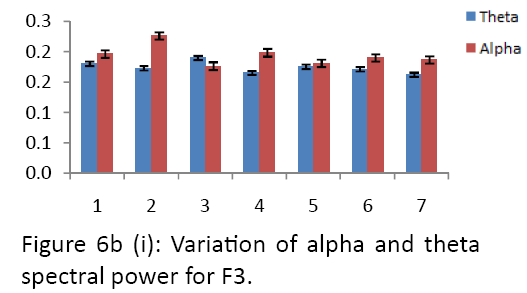
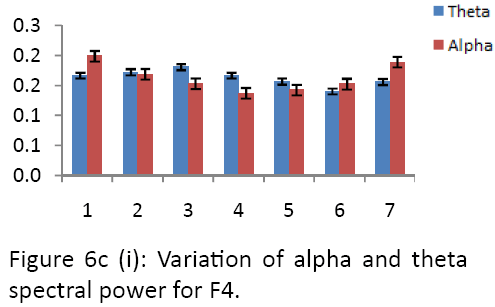
The following Figures 6a-6e shows the variation in alpha and theta spectral power values as well as the scaling exponents in Day 2 (i.e. for Bahar and Mian ki Malhar) for the five frontal electrodes. The alpha power as well as the alpha scaling exponent decreases for the 1st music (i.e. Bahar or joyous raga clip) in the odd electrodes F3 and F7. This goes in line with our previous knowledge, which says that the processing46 of happy emotion takes place in the left hemisphere of the brain. As is found in previous studies decrease in alpha power corresponds to higher arousal based activities, we have also found here that the dip in alpha power corresponds to a dip in complexity of neural activities. The alpha power as well as the alpha scaling exponent decreases for the 1st music (i.e. Bahar or joyous raga clip) in the odd electrodes F3 and F7. This goes in line with our previous knowledge, which says that the processing of happy emotion takes place in the left hemisphere of the brain. As is found in previous studies decrease in alpha power corresponds to higher arousal based activities, we have also found here that the dip in alpha power corresponds to a dip in complexity of neural activities. In case of the 2nd music (i.e. Mian ki Malhar or sad raga clip), there is also a dip in spectral alpha power but the dip is not as significant as in the case of 1st music. But the scaling exponent or the complexity shows a rise corresponding to 2nd music. Interestingly, the even electrodes F4 and F8 follow almost the same pattern as the odd ones, with the alpha scaling exponents showing a sharp dip corresponding to the 1st music, while it rises for the 2nd music. It may be inferred loosely that the emotional content or the emotion eliciting capacity of the 2nd music may not be as strong as that of the 1st music. But the alpha spectral power values form a prominent dip for the 2nd music as compared to the 1st music for the even electrodes. In this case the behavior of the alpha spectral power values goes in opposition to the scaling exponent values. In the frontal midline electrode, i.e. Fz, the alpha power dips for both the music and again increases after the removal of music. The alpha scaling exponent does not vary significantly in the Fz electrode throughout the experimental period. The theta spectral power increases more for the 2nd music, also the dip in theta scaling exponent is more in case of the 2nd music. In the odd electrodes F3 and F7, the theta spectral power again increases for both the music and then decreases after the removal of musical stimuli, while the theta scaling exponent shows a significant dip for the 2nd music while it increases to a small extent for the 1st music. This result is an interesting one, as the subjects may have found the 2nd music (conventionally a sad one) to be more pleasant than that of the 1st. In the even electrodes, F4 and F8, the theta spectral power again increases, to a greater extent for the 2nd music, to a smaller extent for the 2nd music. The theta scaling exponent shows a sharp dip for the 2nd music, while it increases a little for the 1st one. ANOVA tests were conducted in the same way as previously described and the results are given in Tables 7 and 8 for alpha and theta frequency range respectively.
